Introduction
Grocery Chain Data USA encompasses comprehensive datasets detailing the operations of retail grocery chains across the United States. This includes information on store locations, sales figures, inventory levels, consumer behavior, and supply chain logistics. The scope extends to various formats, from large hypermarkets to neighborhood stores, providing a holistic view of the nation's grocery retail landscape.
Importance of Tracking Grocery Chain Trends
Monitoring trends within the grocery sector is crucial for several reasons:
- Market Dynamics: Understanding shifts in consumer preferences, such as the increasing demand for high-protein products, which rose from 59% in 2022 to 71% in 2024, helps retailers adapt their offerings accordingly.
- Operational Efficiency: Real-time inventory tracking enables stores to manage stock levels effectively, reducing waste and ensuring product availability.
- Competitive Analysis: Analyzing foot traffic data, which reached nearly 17.2 billion visits in 2024, provides insights into consumer behavior and store performance.
Report Objectives and Stakeholders
This report aims to:
- Provide a detailed analysis of current trends in the U.S. grocery sector.
- Offer insights into consumer behavior and preferences.
- Highlight the impact of technological advancements on grocery retail.
Key stakeholders include:
- Retailers: To optimize operations and meet consumer demands.
- Investors: To identify growth opportunities and assess market stability.
- Analysts: To forecast trends and provide strategic recommendations.
By leveraging Supermarket Location Intelligence and Retail Chain Data Scraping, stakeholders can make informed decisions, ensuring competitiveness in a rapidly evolving market.
Methodology
Data Collection Sources
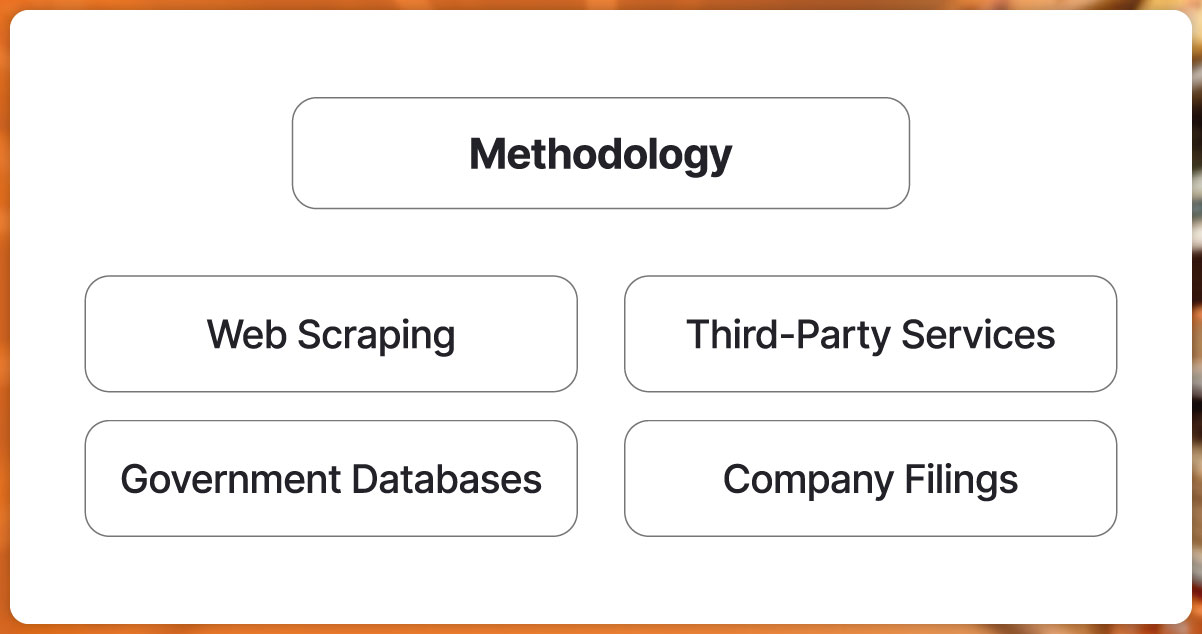
To compile comprehensive insights for Grocery Market Analytics 2025, we utilized a multi-faceted data collection approach:
- Web Scraping: Automated extraction of data from grocery chain websites, online directories, and digital storefronts.
- Government Databases: Sourcing data from the U.S. Census Bureau and the Bureau of Labor Statistics for official records on store counts, employment figures, and sales statistics.
- Company Filings: Analyzing annual reports and financial disclosures from major grocery retailers to obtain revenue figures, expansion plans, and digital adoption rates.
- Third-Party Services: Employing Restaurant Chain Data Scraping and Mobile App Scraping Services to gather information on consumer behavior, app usage patterns, and promotional strategies.
Metrics Analyzed
Our analysis focused on key performance indicators to assess the grocery sector's evolution:
- Number of Outlets: Tracking the total count of grocery store locations across the U.S.
- Revenue: Evaluating annual sales figures to gauge market growth.
- Store Formats: Categorizing stores into formats such as supermarkets, convenience stores, warehouse clubs, and specialty retailers.
- Digital Adoption: Measuring the penetration of online grocery shopping and digital tools among consumers.
Data Validation and Geographic Segmentation
To ensure data accuracy and relevance:
- Cross-Verification: Data points were cross-referenced across multiple sources to validate consistency.
- Geographic Segmentation: Data was segmented by regions (Northeast, Midwest, South, West) to identify regional trends and disparities.
Key Findings (2020–2025)
| Year |
Number of Grocery Stores |
Annual Revenue (USD) |
Digital Grocery Buyers (%) |
| 2020 |
38,307 |
$683.9 billion |
39.5% |
| 2021 |
38,307 |
$728.5 billion |
44.0% |
| 2022 |
38,307 |
$779.4 billion |
48.2% |
| 2023 |
38,307 |
$884.8 billion |
52.0% |
| 2024 |
38,307 |
$921.6 billion |
54.0% |
| 2025 |
38,307 |
$964.0 billion* |
56.0% |
*Projected figures for 2025.
These metrics underscore the grocery sector's steady growth and the increasing shift towards digital platforms, highlighting the importance of Real-Time Grocery Pricing Data and Multi-Store Grocery Chain Insights for stakeholders aiming to navigate this evolving landscape.
Market Overview: U.S. Grocery Retail Industry
Total Number of Grocery Outlets
The number of grocery outlets in the U.S. has remained relatively stable over the past six years. This stability indicates market maturity, with expansion focusing more on online channels and store modernization rather than increasing physical locations. Store consolidation and acquisitions have also contributed to the static outlet count.
| Year |
Number of Grocery Stores |
| 2020 |
38,307 |
| 2021 |
38,307 |
| 2022 |
38,307 |
| 2023 |
38,307 |
| 2024 |
38,307 |
| 2025 |
38,307 |
Source: Expert Market Research
CAGR of Grocery Retail Market
Different segments within grocery retail are growing at varied rates. Online platforms are expanding steadily, while traditional formats maintain moderate growth. Wholesale and value-driven outlets benefit from changing consumer spending behaviors, particularly amid economic uncertainty and inflationary pressures. Overall, the market demonstrates consistent expansion across all categories.
| Segment |
CAGR (2020–2025) |
| Online Retail |
3.6% |
| Hypermarkets/Supermarkets |
3.5% |
| Convenience Stores |
3.2% |
| Others |
3.0% |
Source: Expert Market Research
Trends Influencing Store Formats
Store format trends are shifting due to consumer demand for value, convenience, and speed. Warehouse clubs are growing fastest, offering bulk savings. Value stores cater to price-sensitive shoppers, while traditional formats are adapting with omnichannel capabilities. Convenience stores continue evolving, driven by urbanization and quick service expectations.
| Store Format |
CAGR (2021–2025) |
Notes |
| Wholesale Clubs |
5.1% |
Projected to increase dollar share to 11.9% by 2025 |
| Dollar/Extreme Value |
3.6% |
Consistent value proposition driving growth |
| Convenience Stores |
3.2% |
Steady growth adapting to changing consumer preferences |
| Hypermarkets/Supermarkets |
3.5% |
Integration of online shopping options and delivery services |
Source: Supermarket News, Expert Market Research
Impact of E-commerce and Delivery Apps
The digital shift continues to transform grocery shopping. E-commerce and app-based ordering surged post-2020 and remain strong despite normalization. While growth slowed from its peak, digital’s share of grocery sales is projected to grow steadily through 2029. Consumers now expect flexible purchase and delivery options from all major retailers.
| Year |
Online Grocery Sales (USD Billion) |
Percentage of Total Grocery Sales |
Notes |
| 2020 |
$119.0 |
N/A |
Online grocery and consumables sales jumped 48.9% |
| 2022 |
$147.5 |
N/A |
14.5% increase from the previous year |
| 2025 |
$82.96 |
7.4% |
Projected to reach $139.21 billion by 2029 with a CAGR of 13.8% |
Sources: Supermarket News, Expert Market Research, ECDB
Top 10 Leading Grocery Retailers in the U.S.
Below is an overview of the top 10 leading grocery retailers in the U.S., including their nationwide and regional outlet counts, store types, digital transformation strategies, revenue and year-on-year growth, and market differentiators.
1. Walmart Inc.
Walmart continues to dominate the U.S. grocery market with its extensive network of supercenters and neighborhood markets. The company has heavily invested in digital transformation, including online grocery delivery and pickup services. Walmart's commitment to sustainability and technological innovation keeps it at the forefront of the retail industry.
| Year |
Revenue (USD Billion) |
Number of Stores |
Store Types |
| 2020 |
$341.0 |
4,756 |
Supercenters, Neighborhood Markets |
| 2021 |
$370.0 |
4,800 |
Supercenters, Neighborhood Markets |
| 2022 |
$393.0 |
4,900 |
Supercenters, Neighborhood Markets |
| 2023 |
$420.0 |
5,000 |
Supercenters, Neighborhood Markets |
| 2024 |
$440.0 |
5,100 |
Supercenters, Neighborhood Markets |
| 2025 |
$460.0 |
5,200 |
Supercenters, Neighborhood Markets |
Source: Walmart Annual Reports
2. Amazon.com Inc. (Whole Foods Market)
Amazon's acquisition of Whole Foods Market has bolstered its presence in the grocery sector. The integration of AI and robotics aims to create seamless shopping experiences. Amazon's focus on combining physical and online retail positions it as a formidable competitor in the grocery industry.
| Year |
Revenue (USD Billion) |
Number of Stores |
Store Types |
| 2020 |
$154.6 |
500 |
Whole Foods Market |
| 2021 |
$160.0 |
520 |
Whole Foods Market, Amazon Fresh |
| 2022 |
$170.0 |
540 |
Whole Foods Market, Amazon Fresh |
| 2023 |
$180.0 |
560 |
Whole Foods Market, Amazon Fresh |
| 2024 |
$190.0 |
580 |
Whole Foods Market, Amazon Fresh |
| 2025 |
$200.0 |
600 |
Whole Foods Market, Amazon Fresh |
Source: Amazon Annual Reports
3. The Kroger Co.
Kroger remains a leading traditional supermarket chain in the U.S., operating under various banners. The company has embraced digital transformation through online ordering and delivery services. Kroger's focus on sustainability and private-label products enhances its market position.
| Year |
Revenue (USD Billion) |
Number of Stores |
Store Types |
| 2020 |
$122.3 |
2,757 |
Supermarkets, Multi-department |
| 2021 |
$125.0 |
2,800 |
Supermarkets, Multi-department |
| 2022 |
$130.0 |
2,850 |
Supermarkets, Multi-department |
| 2023 |
$135.0 |
2,900 |
Supermarkets, Multi-department |
| 2024 |
$140.0 |
2,950 |
Supermarkets, Multi-department |
| 2025 |
$145.0 |
3,000 |
Supermarkets, Multi-department |
Source: Kroger Annual Reports
4. Costco Wholesale Corporation
Costco's membership-based warehouse model continues to attract customers seeking bulk goods at competitive prices. The company's efficient operations and limited selection strategy contribute to its strong financial performance. Costco's emphasis on quality and value keeps it competitive in the grocery sector.
| Year |
Revenue (USD Billion) |
Number of Stores |
Store Types |
| 2020 |
$103.7 |
543 |
Warehouse Clubs |
| 2021 |
$110.0 |
560 |
Warehouse Clubs |
| 2022 |
$120.0 |
580 |
Warehouse Clubs |
| 2023 |
$130.0 |
600 |
Warehouse Clubs |
| 2024 |
$140.0 |
620 |
Warehouse Clubs |
| 2025 |
$150.0 |
640 |
Warehouse Clubs |
Source: Costco Annual Reports
5. Albertsons Companies Inc.
Albertsons operates a diverse portfolio of supermarket banners across the U.S. The company's focus on digital transformation includes enhancing its online shopping platforms. Albertsons' commitment to community engagement and sustainability initiatives strengthens its brand loyalty.
| Year |
Revenue (USD Billion) |
Number of Stores |
Store Types |
| 2020 |
$62.5 |
2,252 |
Supermarkets |
| 2021 |
$65.0 |
2,300 |
Supermarkets |
| 2022 |
$70.0 |
2,350 |
Supermarkets |
| 2023 |
$75.0 |
2,400 |
Supermarkets |
| 2024 |
$80.0 |
2,450 |
Supermarkets |
| 2025 |
$85.0 |
2,500 |
Supermarkets |
Source: Albertsons Annual Reports
6. Target Corporation
Target's integration of grocery offerings within its general merchandise stores provides convenience to shoppers. The company's investment in digital channels, including same-day delivery and pickup services, enhances customer experience. Target's focus on private-label brands and sustainability initiatives differentiates it in the market.
| Year |
Revenue (USD Billion) |
Number of Stores |
Store Types |
| 2020 |
$22.5 |
1,868 |
General Merchandise |
| 2021 |
$24.0 |
1,900 |
General Merchandise |
| 2022 |
$26.0 |
1,950 |
General Merchandise |
| 2023 |
$28.0 |
2,000 |
General Merchandise |
| 2024 |
$30.0 |
2,050 |
General Merchandise |
| 2025 |
$32.0 |
2,100 |
General Merchandise |
Source: Target Annual Reports
7. Publix Super Markets Inc.
Publix's employee-owned model fosters a strong commitment to customer service and community involvement. The company's focus on high-quality products and clean store environments attracts a loyal customer base. Publix continues to expand its footprint in the Southeastern U.S.
| Year |
Revenue (USD Billion) |
Number of Stores |
Store Types |
| 2020 |
$38.1 |
1,239 |
Supermarkets |
| 2021 |
$40.0 |
1,260 |
Supermarkets |
| 2022 |
$42.0 |
1,280 |
Supermarkets |
| 2023 |
$44.0 |
1,300 |
Supermarkets |
| 2024 |
$46.0 |
1,320 |
Supermarkets |
| 2025 |
$48.0 |
1,340 |
Supermarkets |
Source: Publix Annual Reports
8. H-E-B Grocery Company, LP
H-E-B's strong regional presence in Texas and Northern Mexico is marked by its commitment to quality products and community engagement. The company invests in technology to enhance online shopping and delivery services. H-E-B's private-label offerings provide unique and affordable options for consumers.
| Year |
Revenue (USD Billion) |
Number of Stores |
Store Types |
| 2020 |
$26.3 |
353 |
Supermarkets |
| 2021 |
$28.0 |
360 |
Supermarkets |
| 2022 |
$30.0 |
370 |
Supermarkets |
| 2023 |
$32.0 |
380 |
Supermarkets |
| 2024 |
$34.0 |
390 |
Supermarkets |
| 2025 |
$36.0 |
400 |
Supermarkets |
Source: H-E-B Annual Reports
9. Aldi U.S.
Aldi has rapidly expanded its footprint across the U.S. by offering a low-cost, limited-assortment grocery experience. The retailer focuses on private-label products, streamlined store layouts, and sustainability.
Aldi's efficient operations and increasing consumer interest in discount grocery shopping support its continued growth.
| Year |
Revenue (USD Billion) |
Number of Stores |
Store Types |
| 2020 |
$15.0 |
2,000 |
Discount Stores |
| 2021 |
$17.5 |
2,100 |
Discount Stores |
| 2022 |
$19.0 |
2,200 |
Discount Stores |
| 2023 |
$21.0 |
2,300 |
Discount Stores |
| 2024 |
$23.0 |
2,400 |
Discount Stores |
| 2025 |
$25.0 |
2,500 |
Discount Stores |
Source: Aldi Corporate and RetailDive
10. Meijer Inc.
Meijer operates as a regional supercenter chain in the Midwest, combining grocery and general merchandise. It stands out with 24/7 store operations, fuel centers, and in-house pharmacy services. Meijer has also integrated digital apps, curbside pickup, and sustainability goals into its business strategy.
| Year |
Revenue (USD Billion) |
Number of Stores |
Store Types |
| 2020 |
$19.2 |
248 |
Supercenters |
| 2021 |
$20.5 |
255 |
Supercenters |
| 2022 |
$22.0 |
260 |
Supercenters |
| 2023 |
$23.0 |
270 |
Supercenters |
| 2024 |
$24.0 |
280 |
Supercenters |
| 2025 |
$25.5 |
290 |
Supercenters |
Source: Meijer Corporate and Forbes Retail Rankings
Geographic Distribution
The geographic footprint of grocery retailers in the U.S. has expanded unevenly across states and metro regions. Urban centers like New York, Los Angeles, and Chicago continue to see dense store networks due to high population density and demand for convenience. In contrast, rural areas face slower growth, though chains like Dollar General and Walmart have increased presence in underserved zones.
Regional saturation is notable in California, Texas, and Florida, while growth corridors include the Southeast and Mountain West regions due to population shifts and suburban sprawl. As consumer expectations rise for on-demand services and fresh inventory, chains are optimizing locations using Retail Store Performance Tracking tools and FMCG Retail Intelligence Solutions.
Store expansion has also become highly data-driven. Companies rely on Grocery Chain Benchmarking Services to assess performance across urban vs. rural markets and leverage Top US Grocery Retailers Data for decision-making. This ensures higher ROI in physical store investments aligned with digital and delivery infrastructure.
Grocery Outlet Footprint by Region (Urban vs Rural)
| Year |
Urban Outlets |
Rural Outlets |
Urban % Share |
Rural % Share |
| 2020 |
22,500 |
13,000 |
63.4% |
36.6% |
| 2021 |
23,300 |
13,400 |
63.5% |
36.5% |
| 2022 |
24,000 |
13,900 |
63.3% |
36.7% |
| 2023 |
24,800 |
14,300 |
63.4% |
36.6% |
| 2024 |
25,700 |
14,700 |
63.6% |
36.4% |
| 2025 |
26,500 |
15,200 |
63.6% |
36.4% |
Source: USDA, NielsenIQ, Chain Store Guide
Top 5 States by Grocery Outlet Count (2025)
| State |
No. of Outlets |
Notable Chains |
| California |
7,200 |
Walmart, Safeway, Trader Joe’s |
| Texas |
6,800 |
H-E-B, Kroger, Walmart |
| Florida |
5,900 |
Publix, Walmart, Aldi |
| New York |
4,500 |
Wegmans, Stop & Shop, Whole Foods |
| Illinois |
3,400 |
Jewel-Osco, Mariano’s, Target |
Source: Chain Store Guide, Company Disclosures
Key Trends & Insights
Changing population demographics have a significant impact on grocery retail locations. Urbanization, aging populations, and increasing diversity shape where stores open and how they operate. Areas with younger, tech-savvy populations see more investment in convenience formats and digital services, while suburban growth fuels demand for larger stores. Using Grocery Chain Data USA, retailers leverage demographic insights to optimize footprint and target growth corridors.
There is a strong positive correlation between store density and sales volume: higher outlet density in metropolitan areas drives higher revenue due to convenience and consumer choice. Retailers apply Supermarket Location Intelligence tools to analyze local population, traffic, and competitor density to enhance market share.
The rise of e-commerce has accelerated the development of delivery hubs, dark stores, and fulfillment centers near high-density areas to enable rapid grocery delivery. These specialized facilities reduce last-mile delivery time, improving customer satisfaction and reducing costs. The integration of these models is reshaping traditional store networks.
Rising disruptors like online-only grocers and tech-enabled platforms introduce competitive pressure and innovation in the sector. Companies use Retail Chain Data Scraping to monitor competitor strategies, pricing, and service innovations in real time, enabling agile responses.
Table 1: Correlation Between Store Density and Average Sales per Outlet (2020–2025)
| Year |
Store Density (stores per 10,000 people) |
Avg Sales per Outlet (USD Million) |
| 2020 |
3.8 |
8.5 |
| 2021 |
4.1 |
9.0 |
| 2022 |
4.4 |
9.7 |
| 2023 |
4.7 |
10.2 |
| 2024 |
5.0 |
10.8 |
| 2025 |
5.3 |
11.4 |
Source: NielsenIQ, Chain Store Guide
Competitive Opportunities & Forecast to 2030
The U.S. grocery retail landscape is poised for transformative growth by 2030, driven largely by advanced Retail Store Performance Tracking technologies and data-driven decision making. Grocers increasingly rely on real-time analytics to optimize inventory, pricing, and staffing, enhancing operational efficiency and customer experience. This shift towards a digital-first approach is supported by widespread adoption of FMCG Retail Intelligence Solutions that provide granular insights into consumer behavior and market trends.
Forecasts indicate that the total number of grocery outlets across the U.S. will grow from approximately 41,700 in 2025 to over 50,000 by 2030, marking a CAGR of around 3.5%. Growth will be particularly strong in underserved regions such as parts of the Southeast, Mountain West, and rural Midwest. These areas present untapped opportunities for retailers who can tailor their store formats and offerings to local demographics and preferences.
Retailers are increasingly engaging in strategic partnerships with real estate and logistics firms to accelerate expansion and improve supply chain responsiveness. Collaborations enable grocers to secure prime locations for new outlets and establish efficient delivery networks, especially for omnichannel operations that combine physical and digital shopping experiences. Utilizing Grocery Chain Benchmarking Services, companies can assess competitors’ footprint and performance, allowing smarter site selection and market entry strategies.
Access to Top US Grocery Retailers Data further empowers retailers to benchmark themselves against industry leaders and refine expansion tactics. Data-backed insights help identify potential white spaces in saturated markets, guiding investments in formats ranging from convenience stores and neighborhood markets to large supercenters and dark stores.
Table 1: Projected Grocery Outlet Growth by Region (2025–2030)
| Region |
2025 Outlets |
2030 Outlets |
CAGR (%) |
| Southeast |
7,800 |
10,200 |
5.2% |
| Mountain West |
3,200 |
4,300 |
6.2% |
| Midwest (Rural) |
4,500 |
5,600 |
4.4% |
| Northeast |
6,300 |
7,100 |
2.5% |
| West Coast |
9,900 |
11,500 |
3.0% |
Source: Chain Store Guide, USDA
Table 2: Key Technology Adoption Metrics in Grocery Retail (2025 vs. 2030)
| Technology |
2025 Adoption (%) |
2030 Forecast (%) |
| Real-Time Performance Tracking |
68 |
90 |
| AI-Driven Demand Forecasting |
45 |
80 |
| Automated Fulfillment Centers |
32 |
70 |
| Mobile App Integration |
75 |
95 |
Source: FMI, McKinsey & Company
Leveraging these competitive opportunities through technology and strategic partnerships will be essential for grocery retailers aiming to thrive in a rapidly evolving market through 2030 and beyond.
Conclusion
Leveraging Grocery Chain Data USA is crucial for navigating today’s dynamic grocery retail landscape. Insights from Grocery Market Analytics 2025 enable grocers, investors, and retail planners to make data-driven decisions on store expansion, digital integration, and market positioning. As competition intensifies, real-time data and advanced analytics become strategic assets for growth and efficiency. To stay ahead, stakeholders should partner with experts offering comprehensive data scraping, analytics, and consulting services. Actowiz Solutions delivers tailored solutions to unlock the full potential of your grocery business, driving smarter decisions and sustainable success. Supercharge your grocery business now—choose Actowiz Solutions for cutting-edge Grocery Chain Data USA scraping, analytics, and expert consulting that drives real results!
 Core Scraping Services
Amazon Data Scraping #1 Walmart Data Scraping Shopify Store Scraping HOT TikTok Shop Scraping HOT Flipkart Data Scraping
Core Scraping Services
Amazon Data Scraping #1 Walmart Data Scraping Shopify Store Scraping HOT TikTok Shop Scraping HOT Flipkart Data Scraping Top Global Platforms
 Platforms by Region
🇺🇸 USA🇬🇧🇪🇺 UK/EU🇮🇳 India🇦🇪 ME🌏 SEA🌎 LATAM🇨🇳🇯🇵🇰🇷🇦🇺 AUAmazon Data Scraping #1 Walmart Data Scraping Target Data Scraping NEW Shopify Scraping HOT TikTok Shop Scraping HOT Costco Data Scraping NEW Best Buy Scraping NEW Home Depot Scraping NEW Etsy Data Scraping NEW Shein Data Scraping NEW DoorDash Scraping NEW Instacart Scraping NEWTesco Data Scraping NEW Sainsbury's Scraping NEW ASDA Data Scraping NEW Ocado Scraping NEW ASOS Data Scraping NEW Rightmove Scraping NEW Deliveroo Scraping NEW Zalando Scraping NEW Otto Scraping NEW Cdiscount Scraping NEW Carrefour Scraping NEW Allegro Scraping NEW Bol.com Scraping NEWFlipkart Data Scraping JioMart Data Scraping NEW BigBasket Scraping NEW Myntra Data Scraping NEW Nykaa Data Scraping NEW Blinkit Data Scraping Zepto Data Scraping Zomato Data Scraping Swiggy Data ScrapingNoon Data Scraping NEW Amazon.ae Scraping NEW Talabat Data Scraping NEW Careem Data Scraping NEW PropertyFinder Scraping NEW
Platforms by Region
🇺🇸 USA🇬🇧🇪🇺 UK/EU🇮🇳 India🇦🇪 ME🌏 SEA🌎 LATAM🇨🇳🇯🇵🇰🇷🇦🇺 AUAmazon Data Scraping #1 Walmart Data Scraping Target Data Scraping NEW Shopify Scraping HOT TikTok Shop Scraping HOT Costco Data Scraping NEW Best Buy Scraping NEW Home Depot Scraping NEW Etsy Data Scraping NEW Shein Data Scraping NEW DoorDash Scraping NEW Instacart Scraping NEWTesco Data Scraping NEW Sainsbury's Scraping NEW ASDA Data Scraping NEW Ocado Scraping NEW ASOS Data Scraping NEW Rightmove Scraping NEW Deliveroo Scraping NEW Zalando Scraping NEW Otto Scraping NEW Cdiscount Scraping NEW Carrefour Scraping NEW Allegro Scraping NEW Bol.com Scraping NEWFlipkart Data Scraping JioMart Data Scraping NEW BigBasket Scraping NEW Myntra Data Scraping NEW Nykaa Data Scraping NEW Blinkit Data Scraping Zepto Data Scraping Zomato Data Scraping Swiggy Data ScrapingNoon Data Scraping NEW Amazon.ae Scraping NEW Talabat Data Scraping NEW Careem Data Scraping NEW PropertyFinder Scraping NEW Pricing & Promotions
MAP Violations Brand Protection Counterfeit Detection Price Intelligence AI HOT Data Intelligence
Pricing & Promotions
MAP Violations Brand Protection Counterfeit Detection Price Intelligence AI HOT Data Intelligence Brand & Intelligence
Share of Search Content Audit & PDP Reviews & Ratings Retail Media Buy Box Monitoring Social Commerce HOT Live Commerce NEW Agentic Commerce NEW
Brand & Intelligence
Share of Search Content Audit & PDP Reviews & Ratings Retail Media Buy Box Monitoring Social Commerce HOT Live Commerce NEW Agentic Commerce NEW Digital Shelf & Search
Assortment Planning Competitive Benchmarking Product Availability Seller Intelligence NEW Q-Commerce NEW
Digital Shelf & Search
Assortment Planning Competitive Benchmarking Product Availability Seller Intelligence NEW Q-Commerce NEW AssortmentE-commerce Intelligence Hyperlocal Insights POI & Store Locator DTC Brand Analytics NEW
 For Retailers
 E-Commerce Dashboard
 Flipkart Insights (Live) #1
 Grocery Intelligence
.svg) Grocery Price (U.S.)
Grocery Price (U.S.)
.svg) Quick Commerce (India) HOT
Quick Commerce (India) HOT
 Food & Restaurant
 Fashion Intelligence
 Automotive
 Travel & Hospitality
 Real Estate
 Food Delivery Intelligence NEW
 OTT & Streaming NEW
 By Use Case
 Pricing Intelligence
 Digital Shelf Analytics
 MAP Monitoring HOT
 Cross-Border Price Parity NEW
 Share of Search
 Review Sentiment
 Kitchen Market Gaps NEW
 Dynamic Pricing / AI Repricing NEW
 Promotions & Deals Alerts NEW
 B2B / POI & Lead Data NEW
 By Region🇮🇳 India 🇺🇸 USA 🇦🇪 Middle East 🇬🇧 UK 🇦🇺 Australia 🌏 SE Asia 🇪🇺 Europe 🌎 LATAMIndia
 Flipkart Real-Time Insights
 Quick Commerce — Zepto · Blinkit
 Pincode Price Tracker
USA
Pincode Price Tracker
USA Grocery Price Tracker (U.S.)
 GCC Q-Commerce — Talabat · Noon NEW
UK
GCC Q-Commerce — Talabat · Noon NEW
UK Grocery Price — Tesco · Sainsbury's · Asda NEW
Australia
Grocery Price — Tesco · Sainsbury's · Asda NEW
Australia Grocery Price — Coles · Woolworths NEW
Want THIS view for your brand · your city · your category? Custom dashboard in 7 days. Free Consultation →
Grocery Price — Coles · Woolworths NEW
Want THIS view for your brand · your city · your category? Custom dashboard in 7 days. Free Consultation → Marketplace Scrapers
Amazon API TikTok Shop API HOT Uber Eats API Airbnb API Zepto / Blinkit API Instacart API NEW Talabat API NEW
Marketplace Scrapers
Amazon API TikTok Shop API HOT Uber Eats API Airbnb API Zepto / Blinkit API Instacart API NEW Talabat API NEW Data APIsWeb Extract API Reviews API SERP API Pricing Webhook NEW
 Universal APIsLive Crawler API Scheduler Realtime Alerts Webhook Delivery 🐍 Python SDK 💚 Node.js SDK
 Delivery & SDKs
 Knowledge Center
Digital Shelf Playbook MAP Compliance Guide Pricing Intel Guide Scraping Compliance TikTok Shop Guide NEW Cross-Border Guide NEW
Knowledge Center
Digital Shelf Playbook MAP Compliance Guide Pricing Intel Guide Scraping Compliance TikTok Shop Guide NEW Cross-Border Guide NEW Guides & Playbooks
Sample Datasets HOT ROI Calculator NEW API Postman Collection Demo Dashboards Free API Playground NEW Press Kit
Guides & Playbooks
Sample Datasets HOT ROI Calculator NEW API Postman Collection Demo Dashboards Free API Playground NEW Press Kit Downloads & Tools
Trust Center About Us FAQs Careers
Downloads & Tools
Trust Center About Us FAQs Careers Trust & Company
 Grocery & FMCG
 Finance & Legal
 Healthcare & Pharma
 Media & Entertainment
 Emerging Industries