Actowiz Metrics Real-time  analytics dashboard for brands! Try Free Demo
Scalable web, app & AI-powered extraction. 99.9% accuracy.
All Services → Core Scraping Services
 Top Global Platforms
 Platforms by Region
🇦🇪 Expanding across UAE, Saudi, Qatar, Kuwait & more
Request Custom Platform →🌏 Singapore, Indonesia, Thailand, Philippines, Vietnam & Malaysia
Request Custom Platform →🌎 Brazil, Mexico, Argentina, Colombia & Chile
Request Custom Platform → Pricing & Promotions
 Brand & Intelligence
 Digital Shelf & Search
 Assortment
 For Retailers
Which solution fits?
Talk to Expert Marketplace Scrapers
 Data APIs
 Universal APIs
 Delivery & SDKs
Ready to integrate?
Start Free Trial Knowledge Center
 Guides & Playbooks
 Downloads & Tools
 Trust & Company
Scalable web, app & AI-powered extraction. 99.9% accuracy.
All Services → Core Scraping Services
Top Global Platforms
Pricing & Promotions
Brand & Intelligence
Digital Shelf & Search
Assortment For RetailersWhich solution fits?
Talk to Expert Marketplace Scrapers
Data APIs Universal APIs Delivery & SDKsReady to integrate?
Start Free Trial Knowledge Center
Guides & Playbooks
Downloads & Tools
Trust & Company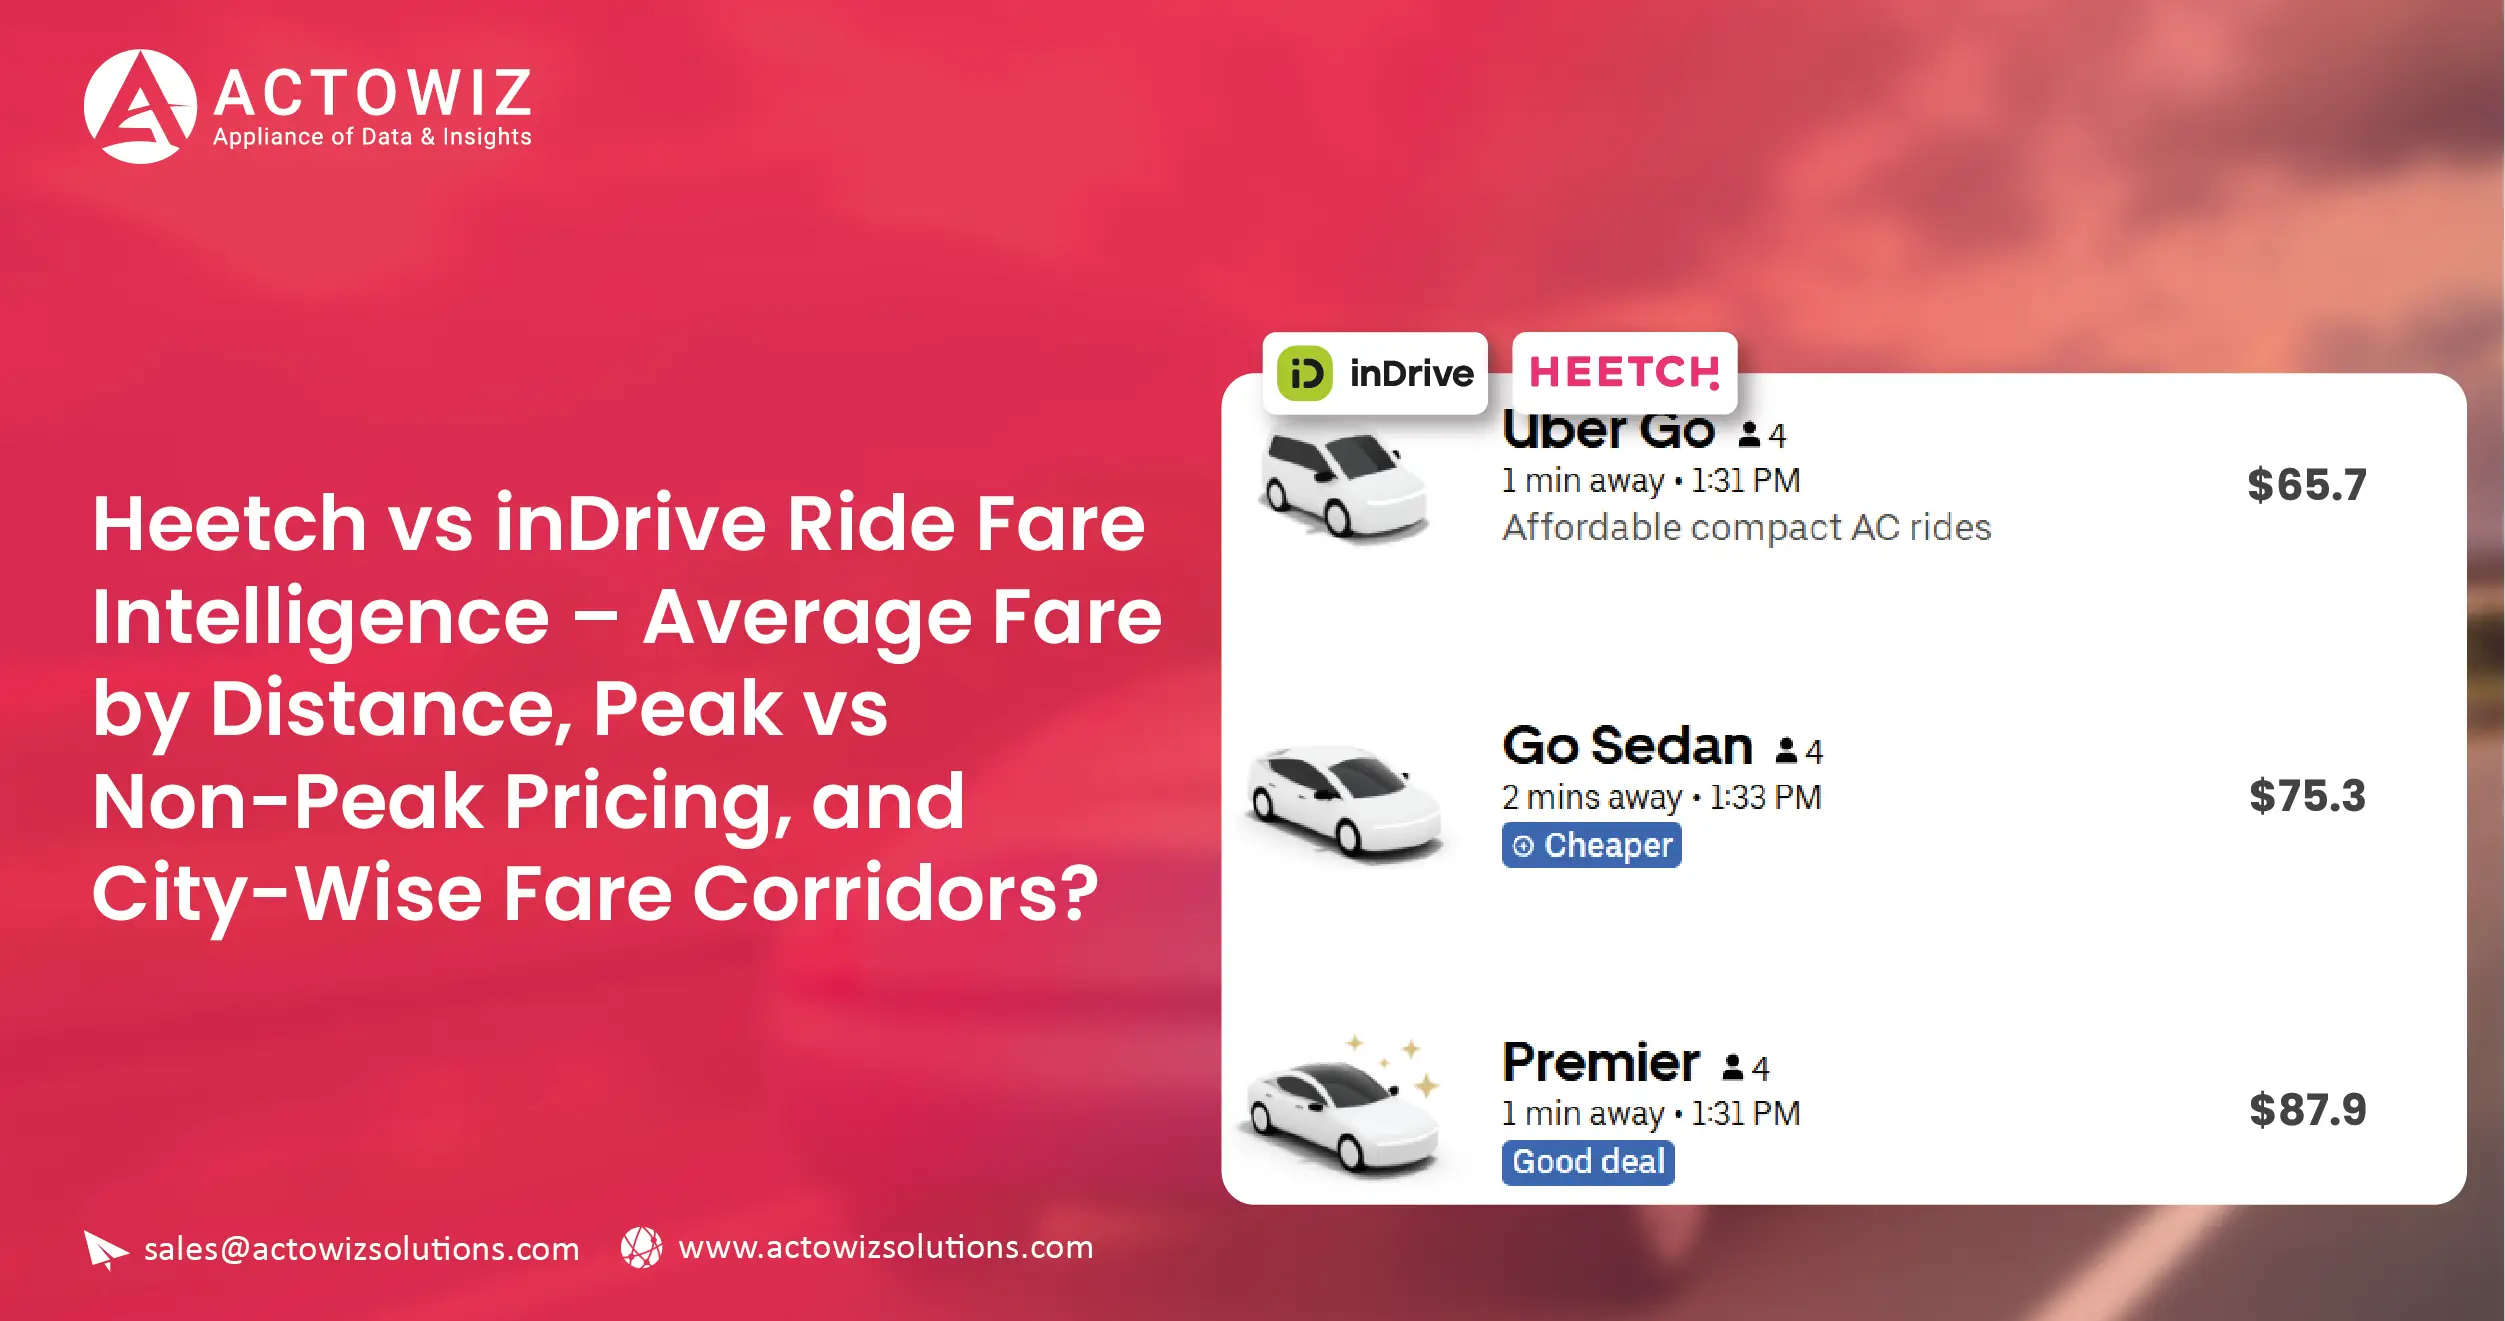
Urban mobility pricing has become increasingly complex as ride-hailing platforms adopt dynamic pricing models influenced by distance, demand, time, and city regulations. Understanding these pricing mechanics is critical for mobility analysts, fleet operators, and platform strategists. Heetch vs inDrive Ride fare Intelligence provides structured insights into how fares differ across routes, peak hours, and urban corridors.
By leveraging automated data extraction and analytics, stakeholders can uncover average fare behavior by distance, compare peak versus non-peak pricing, and analyze city-specific fare corridors. These insights support pricing optimization, driver earnings analysis, and competitive positioning across global ride-hailing markets.
Pricing structures vary significantly between cities due to regulation, traffic density, and rider demand. Comparing Heetch vs inDrive Pricing Across Cities enables stakeholders to identify how fares fluctuate across metropolitan regions and suburban routes.
From 2020 to 2026, ride fares have steadily increased due to fuel costs, inflation, and driver incentives. However, pricing differences between Heetch and inDrive remain city-specific, with some markets favoring flat pricing and others showing aggressive dynamic adjustments.
| City | 2020 | 2022 | 2024 | 2026* |
|---|---|---|---|---|
| Paris | €1.20 | €1.35 | €1.55 | €1.75 |
| Berlin | €1.10 | €1.25 | €1.45 | €1.65 |
| Warsaw | €0.90 | €1.05 | €1.25 | €1.45 |
| Istanbul | €0.85 | €1.00 | €1.20 | €1.40 |
City-level pricing intelligence allows platforms and operators to adapt strategies based on localized fare behavior.
Dynamic pricing requires continuous monitoring. Heetch vs inDrive fare scraping automates the collection of live fare quotes across distances, time slots, and service categories. This eliminates manual tracking and ensures data accuracy at scale.
Between 2020 and 2026, real-time fare monitoring reduced pricing blind spots and improved responsiveness to demand spikes. Automated scraping captures base fares, per-kilometer charges, minimum fares, and surge multipliers.
| Method | Update Speed |
|---|---|
| Manual Checks | Daily |
| Semi-Automated Tools | Hourly |
| Automated Scraping | Real-Time |
With structured datasets, analysts can detect fare shifts instantly and respond faster to competitive changes.
Understanding relative pricing is essential for market positioning. Heetch and inDrive ride fare benchmarking compares fare structures across identical routes, distances, and time windows to identify competitive gaps.
From 2020 onward, benchmarking revealed that short-distance fares often show minimal variation, while longer routes and peak hours amplify pricing differences. This data supports driver earnings optimization and platform pricing alignment.
| Distance | Heetch | inDrive |
|---|---|---|
| 2–5 km | €6.2 | €5.9 |
| 5–10 km | €10.4 | €9.8 |
| 10–20 km | €18.9 | €17.5 |
Benchmarking insights help platforms maintain competitive yet sustainable fare structures.
Time-of-day pricing has a major impact on ride economics. Scrape Peak vs non-peak ride pricing comparison reveals how fares surge during rush hours, weekends, and special events.
Between 2020 and 2026, peak-hour premiums increased as demand outpaced driver availability. However, the extent of surge pricing varies by city and platform strategy.
| Year | Non-Peak | Peak |
|---|---|---|
| 2020 | 1.0 | 1.25 |
| 2022 | 1.0 | 1.35 |
| 2024 | 1.0 | 1.45 |
| 2026* | 1.0 | 1.55 |
Peak pricing intelligence supports better driver allocation, surge control, and rider transparency.
Urban geography strongly influences fare behavior. City-wise ride fare intelligence maps high-traffic corridors, business districts, and residential zones to understand cost variations between routes.
From 2020 to 2026, fare corridors became more pronounced as cities expanded and congestion increased. Corridor-based insights help optimize route planning and pricing fairness.
| Corridor Type | Avg Fare |
|---|---|
| Airport Routes | €22.5 |
| Business District | €14.8 |
| Residential Areas | €9.6 |
| Suburban Routes | €18.2 |
Fare corridor analysis enables smarter operational and pricing decisions at a city level.
Raw fare data has limited value without analytics. Price Intelligence, Heetch vs inDrive Ride fare Intelligence transforms scraped data into structured insights for forecasting, strategy, and performance evaluation.
From 2020 onward, platforms leveraging fare intelligence improved pricing accuracy, reduced revenue leakage, and enhanced user satisfaction through transparent pricing models.
| Metric | Before | After |
|---|---|---|
| Pricing Accuracy | 78% | 95% |
| Reaction Time | 3–5 days | <24 hours |
| Market Visibility | Low | High |
Intelligence-driven pricing strengthens long-term competitiveness in urban mobility markets.
Actowiz Solutions delivers scalable ride-hailing intelligence through advanced automation. With Car Rental Data Scraping capabilities and Heetch vs inDrive Ride fare Intelligence, Actowiz enables businesses to extract, analyze, and act on real-time fare data across platforms and cities.
Actowiz supports route-level pricing analysis, peak-hour tracking, and city-wise benchmarking through enterprise-grade data pipelines designed for mobility analytics.
In a fast-changing mobility ecosystem, pricing agility defines competitive advantage. Leveraging Web Scraping, Mobile App Scraping, and a Real-time dataset allows organizations to understand distance-based fares, peak pricing behavior, and city-wise fare corridors with precision.
Partner with Actowiz Solutions today to unlock ride fare intelligence and make smarter, data-driven mobility decisions!
You can also reach us for all your mobile app scraping, data collection, web scraping , and instant data scraper service requirements!By leveraging Actowiz Solutions, your business stays ahead of the competition, armed with actionable insights from every marketplace.
Our web scraping expertise is relied on by 4,000+ global enterprises including Zomato, Tata Consumer, Subway, and Expedia — helping them turn web data into growth.
Watch how businesses like yours are using Actowiz data to drive growth.
From Zomato to Expedia — see why global leaders trust us with their data.
Backed by automation, data volume, and enterprise-grade scale — we help businesses from startups to Fortune 500s extract competitive insights across the USA, UK, UAE, and beyond.


We partner with agencies, system integrators, and technology platforms to deliver end-to-end solutions across the retail and digital shelf ecosystem.


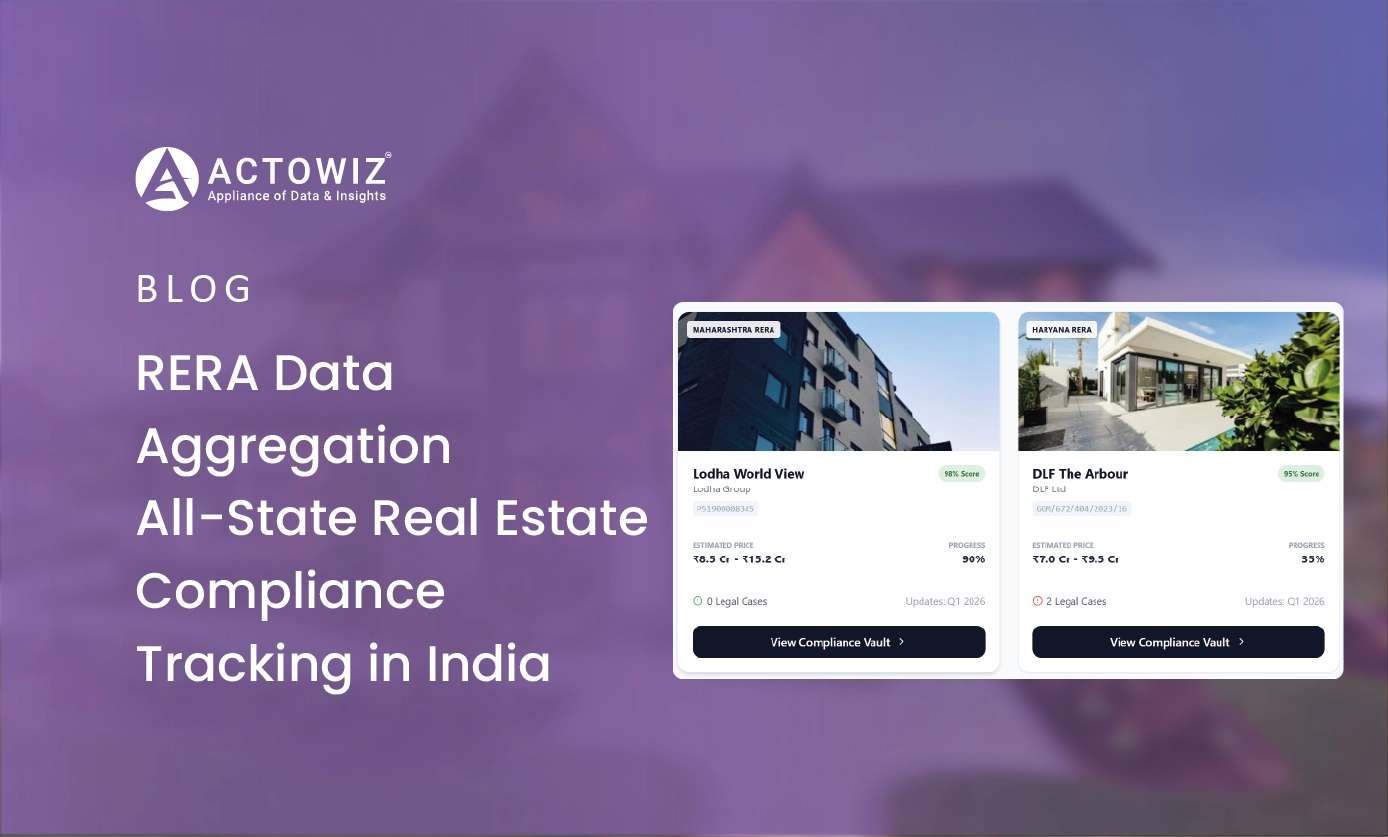
Aggregate RERA data across all 28 Indian states + UTs. Real-time project, builder, and compliance intelligence for India ?40+ trillion real estate market.
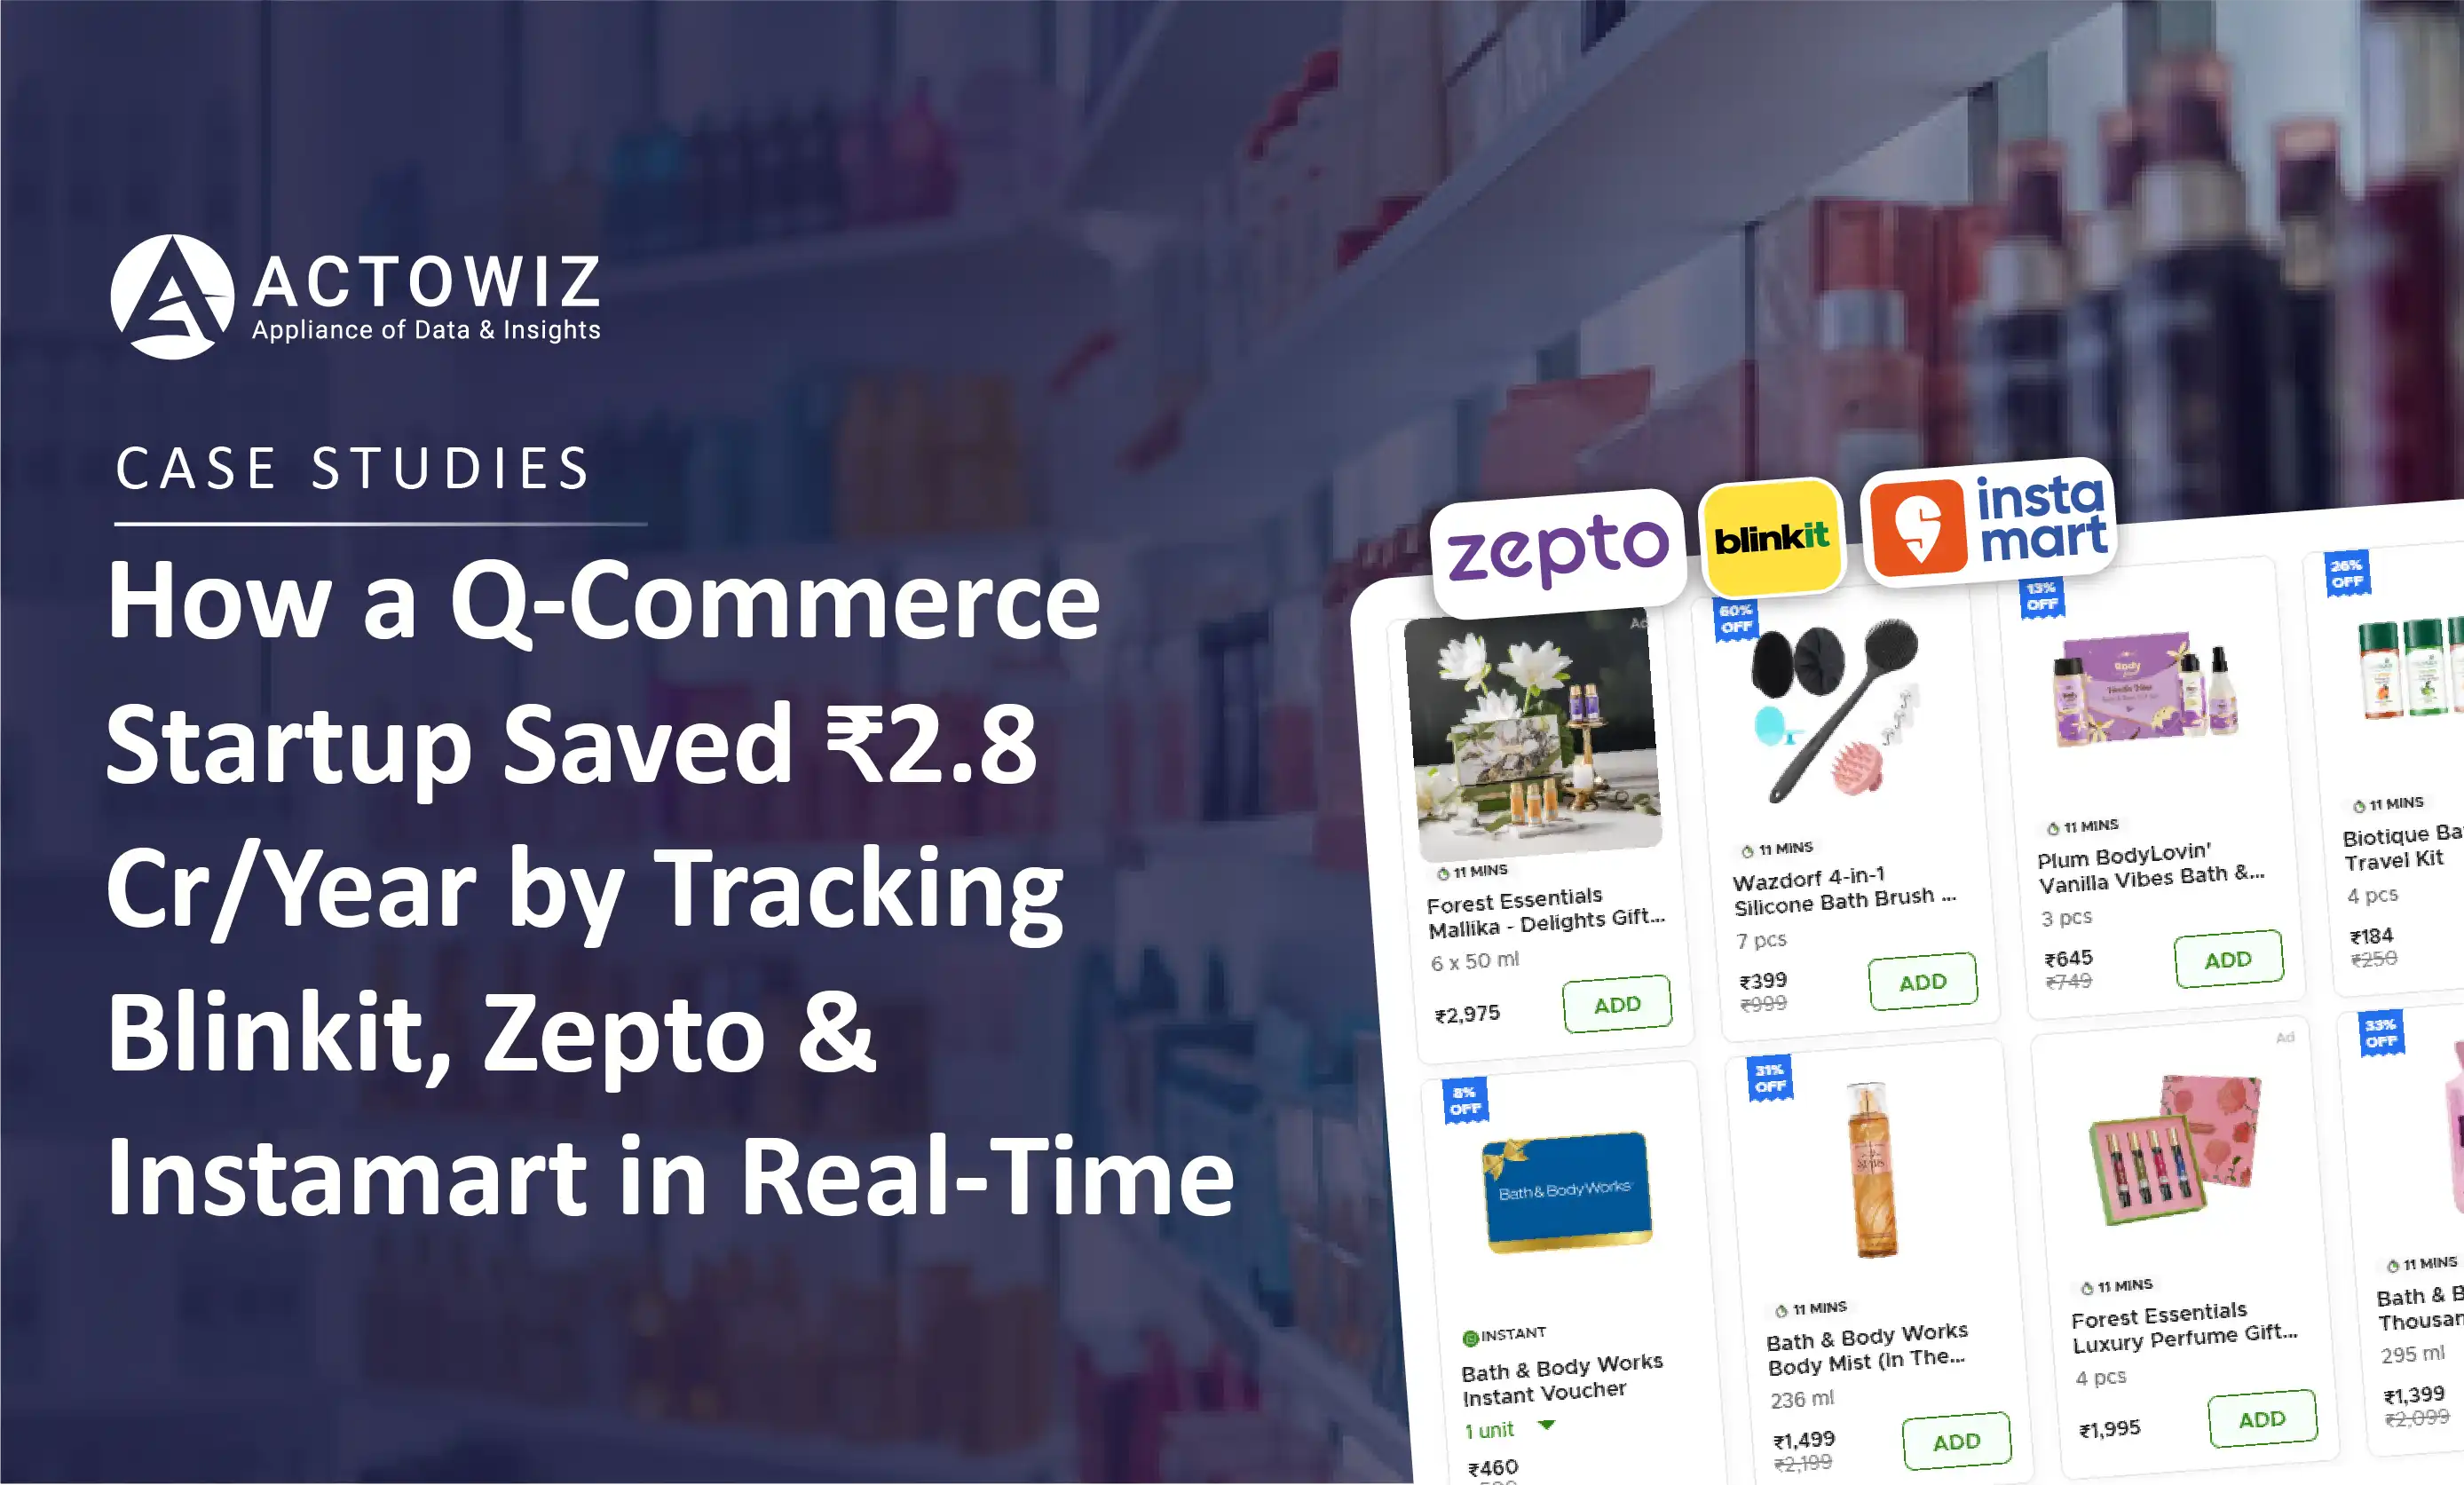
Discover how a Q-commerce startup saved ₹2.8 Cr annually by tracking Blinkit, Zepto, and Instamart in real time. Learn how data-driven pricing and inventory insights boost efficiency and profitability.
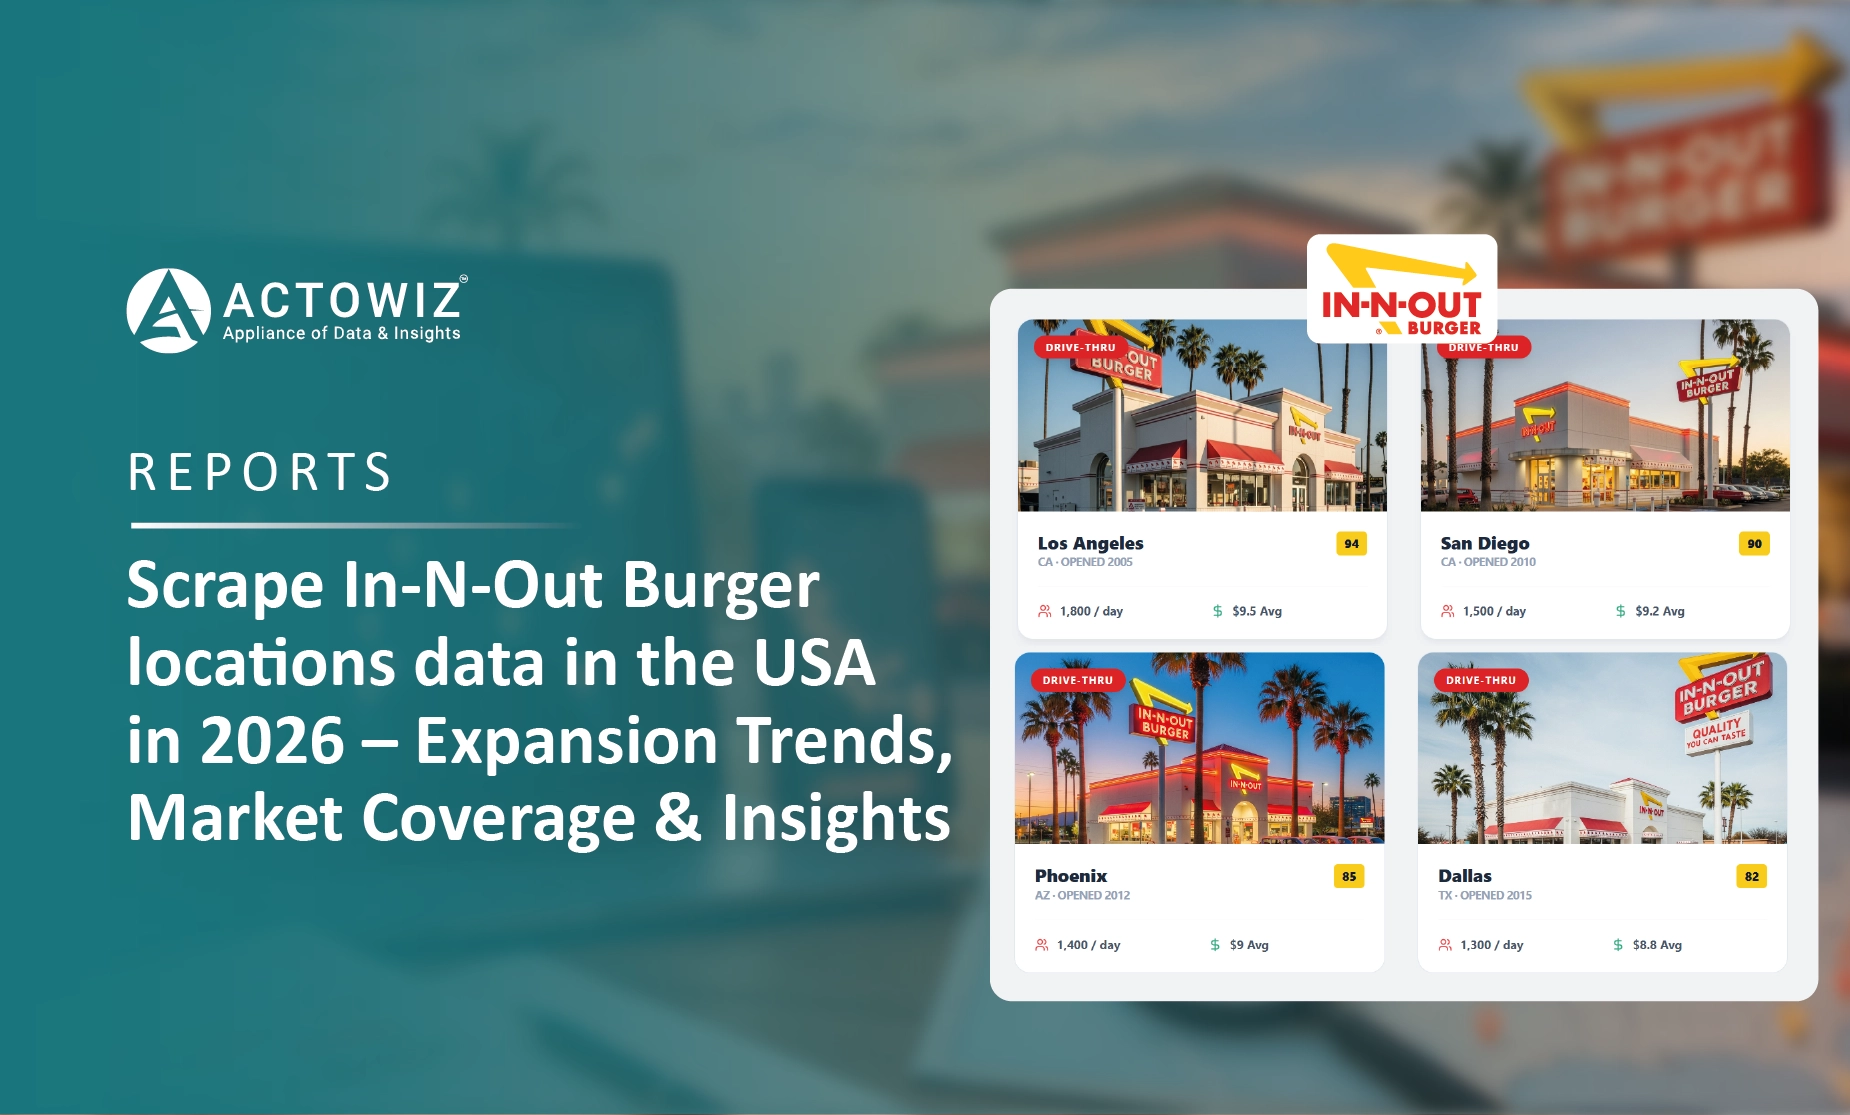
Scrape In-N-Out Burger locations data in the USA in 2026 to analyze store expansion, regional coverage, and market trends.
Whether you're a startup or a Fortune 500 — we have the right plan for your data needs.


 E-commerce & Retail
 Grocery & FMCG
 Travel & Hospitality
 Food & Restaurants
 Finance & Legal
 Healthcare & Pharma
 Real Estate & Local
 Automotive & Mobility
 Media & Entertainment
 Emerging Industries


