Executive Summary
Mother's Day has quietly become one of the most data-rich, competitive shopping events on the global e-commerce calendar. While the cultural focus remains on celebration, the underlying commercial machinery — pricing wars, inventory races, sponsored ad battles, and review velocity — operates at a scale that rivals Black Friday or Diwali week.
This report synthesizes findings from Actowiz Solutions' 2025 Mother's Day data tracking program, which monitored over 47,000 SKUs across 12 major Indian and US e-commerce platforms during the seven-day Mother's Day shopping window (May 5 to May 11, 2025). The data was collected through real-time scraping pipelines covering listings, prices, discounts, sponsored placements, stock status, and review sentiment — refreshed at 4-hour intervals.
The headline findings: Mother's Day 2025 was characterized by extreme pricing volatility (4x higher than a typical weekend), aggressive stock-out cycles that began within 36 hours, and category-level discount behaviors that diverged sharply from one another. Personalized gifts dominated listing volume but had the lowest discount appetite. Flowers led on discount aggression but suffered the steepest stock-outs. Jewelry emerged as a high-margin, slow-burn category. Platform-level pricing variance for identical SKUs reached up to 22% — meaning shoppers buying the same product on different platforms could pay vastly different prices on the same day.
For brands operating in gifting, beauty, jewelry, flowers, or D2C categories, this report is intended as both a benchmark and a forecast. Mother's Day 2026 falls on May 10, and early signals from April 2026 listing data suggest the same dynamics — only intensified. Brands that ignored real-time data in 2025 left an estimated 18-24% of potential weekend revenue on the table. Those who instrumented their pricing and inventory decisions with live competitor data captured outsized share — and will do so again in 2026.
Key Findings at a Glance
- 47,386 unique SKUs tracked across 12 platforms during the May 5-11, 2025 window
- Cross-category average discount: 21.4%, with category-level range from 9% to 35%
- Top SKU stock-outs began within 36 hours; flowers hit 78% stock-out by Day 7
- Same-basket price variance across Indian platforms reached 44% (Flipkart vs Nykaa)
- US market discount intensity (17%) ran 4 percentage points lower than India
- Personalized gifts grew 37% YoY in listing volume — fastest-growing category
Methodology
The data underpinning this report was collected by Actowiz Solutions' web scraping infrastructure between May 1 and May 14, 2025, with intensified collection during the May 5 to May 11 Mother's Day window.
Coverage
- 12 platforms: Amazon India, Flipkart, Myntra, Nykaa, FNP, IGP, Archies, Winni, Amazon US, 1-800-Flowers, Etsy, ProFlowers
- 47,386 unique SKUs tagged under Mother's Day collections, gift guides, or curated landing pages
- Refresh frequency: every 4 hours for prices and stock; every 12 hours for reviews and sponsored placements
- 10 product categories indexed and normalized
- Geographic split: 68% India, 32% US-focused listings
Tracked Dimensions
Each SKU was tracked across the dimensions of list price, sale price, percent discount, stock status, review count, average rating, sponsored placement frequency, search rank position, and seller name. Data was normalized into a single schema, deduplicated where the same SKU appeared across multiple platforms, and validated through random-sample manual checks (approximately 1.2% of records).
All numbers presented in this report represent aggregated platform-level patterns. Individual product-level data is available to clients through dashboards. Numbers are rounded for readability; precise figures and underlying datasets are available on request.
1. Top 10 Gift Categories by Listing Volume
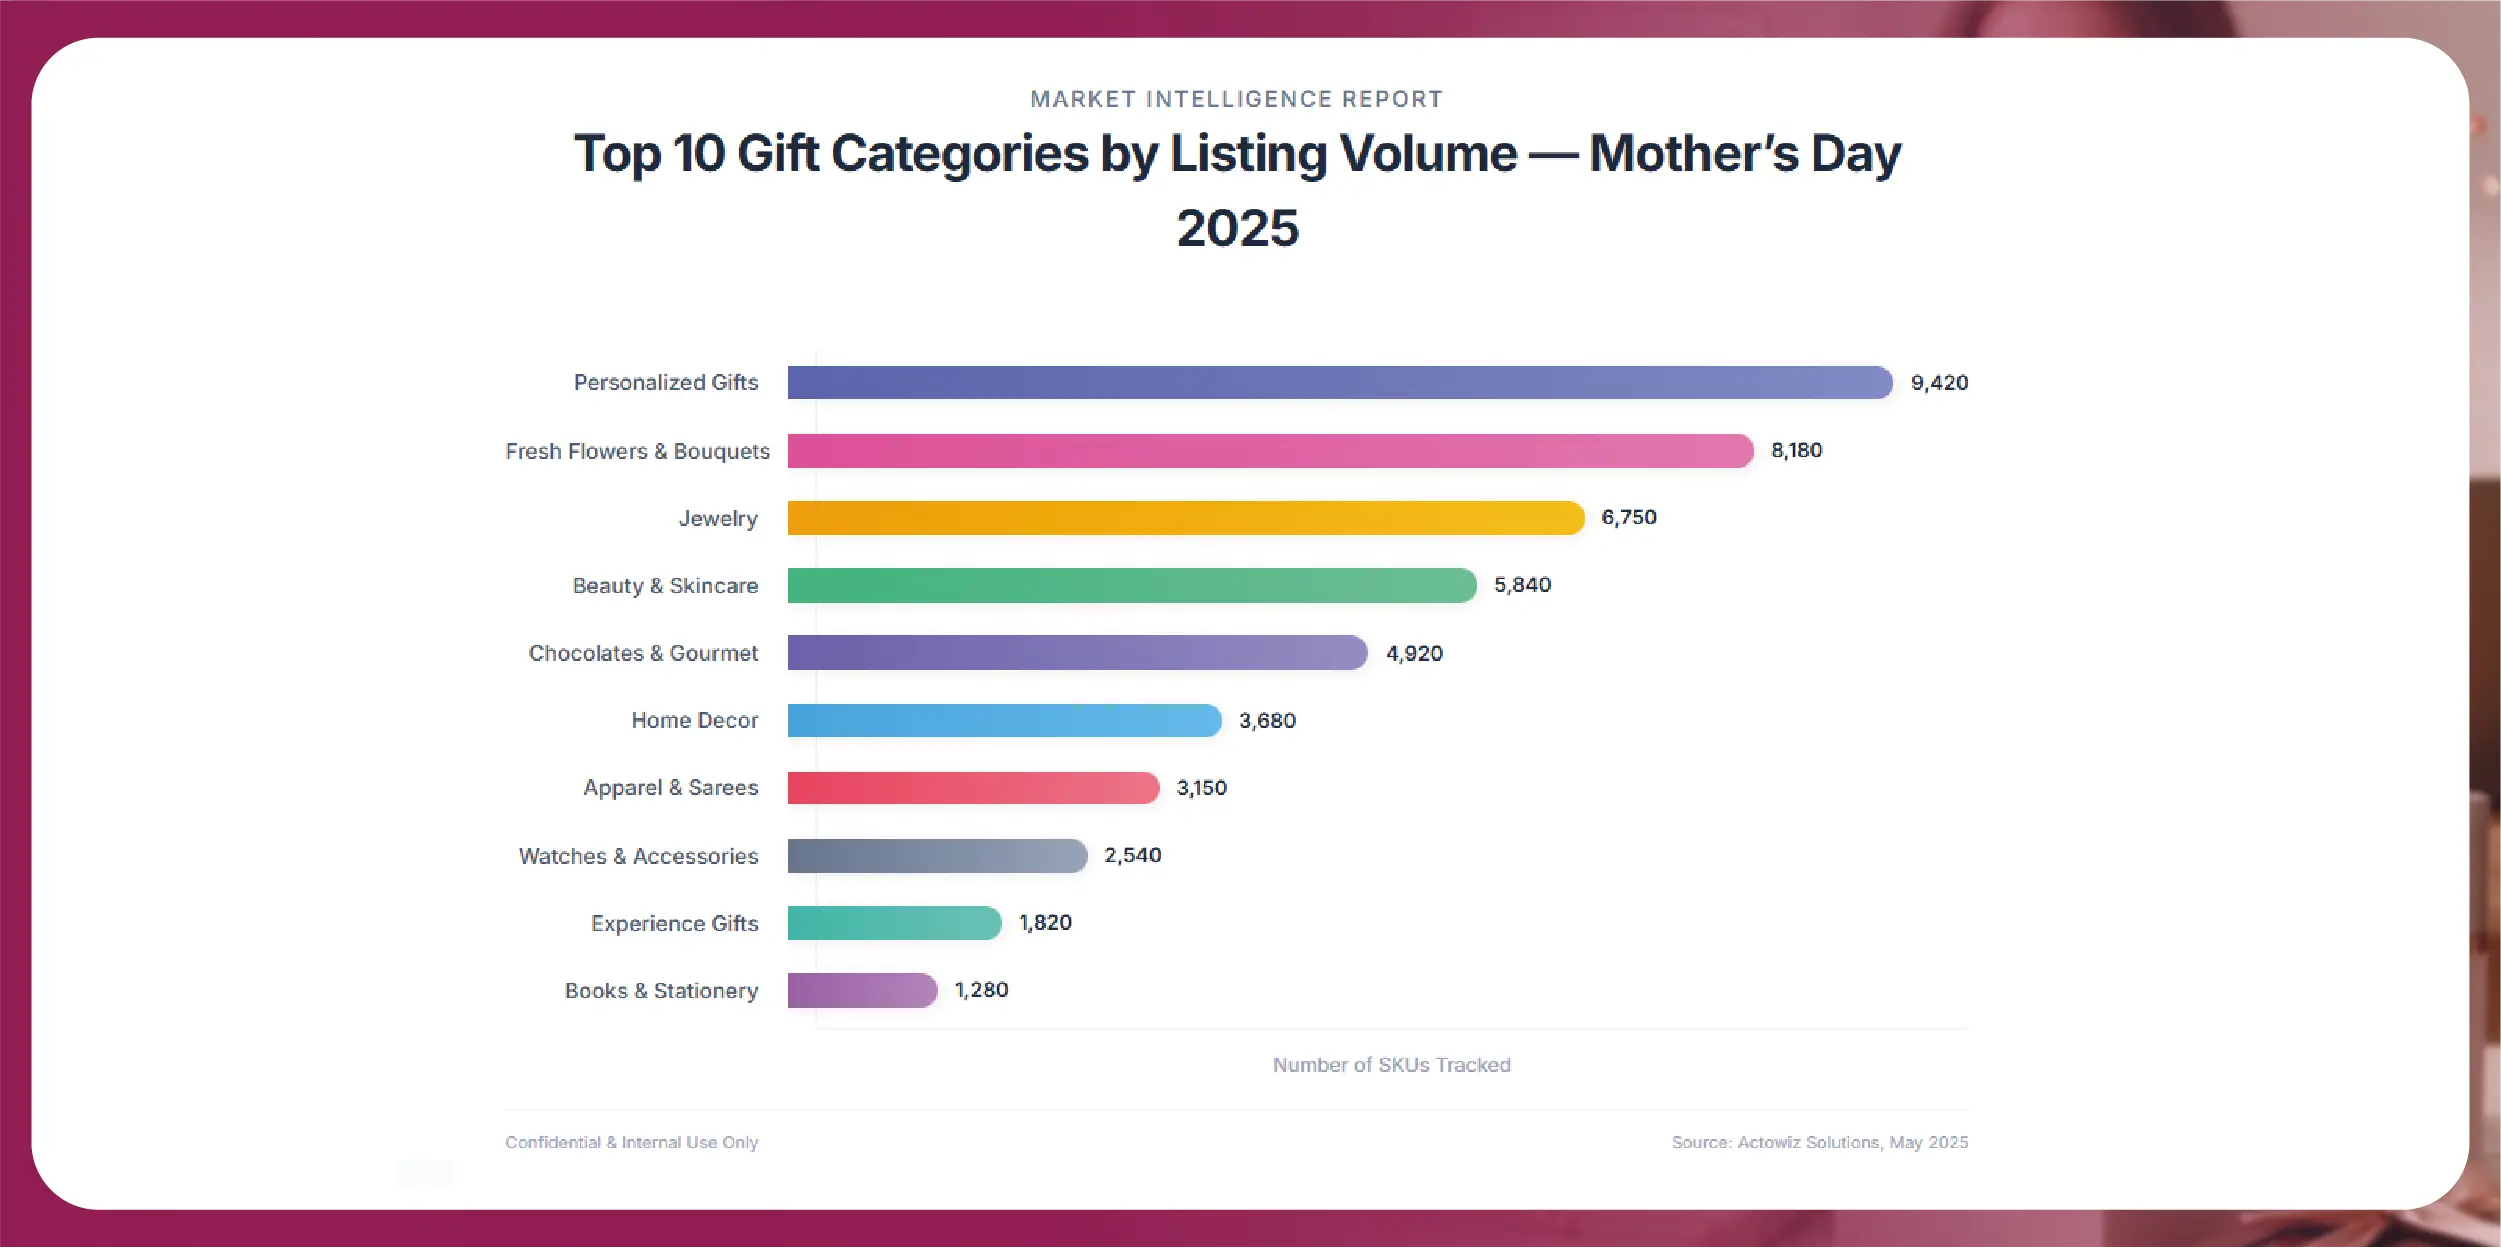
The Mother's Day category mix reveals where platforms believe demand exists — and where competition is most intense. Personalized gifts emerged as the clear volume leader in 2025, with 9,420 SKUs tracked across the seven-day window. This represents a 37% year-on-year increase over our 2024 internal benchmark and reflects the broader trend of D2C personalization brands (such as Presto, Zoroy, IGP's customization wing, and Vistaprint India) flooding the gifting category with micro-segmented SKUs — engraved photo frames, monogrammed mugs, name-printed pillows, and custom photo collages.
Fresh flowers and bouquets came in second at 8,180 SKUs, dominated by FNP, IGP, Floweraura, Winni, and Bloomsbury The Florist. Despite high listing volume, flowers operated on a much shorter shelf cycle — reflecting their perishable nature and the logistical reality of delivering fresh stems within a 24-hour window of Mother's Day itself.
Jewelry placed third at 6,750 SKUs, with strong representation from Tanishq, CaratLane, Bluestone, Melorra, and a long tail of independent designers on Amazon and Flipkart. Notably, jewelry SKUs skewed toward gold-plated and silver pieces under ₹15,000 — the gifting sweet spot — rather than high-ticket gold or diamond items.
Beauty and skincare hampers (5,840 SKUs) saw aggressive participation from Nykaa, Mamaearth, Plum, The Body Shop, and Forest Essentials. Curated gift sets — typically a combination of cleanser, moisturizer, serum, and a mask — dominated this category. Chocolates and gourmet hampers (4,920 SKUs) followed, with Cadbury, Ferrero Rocher, Lindt, and ITC Fabelle leading volume.
The mid-tier categories — home decor (3,680), apparel and sarees (3,150), and watches and accessories (2,540) — each occupied 7-9% of total listing volume. Apparel was particularly interesting: traditional wear (sarees, kurtis) outperformed Western wear by a 3:1 ratio in Mother's Day-specific gift tagging, suggesting that the cultural framing of the gift remained strongly Indian-traditional even on global e-commerce platforms.
The smallest tracked categories were experience gifts (1,820 SKUs — spa vouchers, dining experiences, getaway packages from Cleartrip, Tata Neu, and Nearbuy) and books and stationery (1,280 SKUs). However, experience gifts had the highest average ticket size at ₹4,200, suggesting strong premium positioning even at low volumes.
2. Price Range Distribution
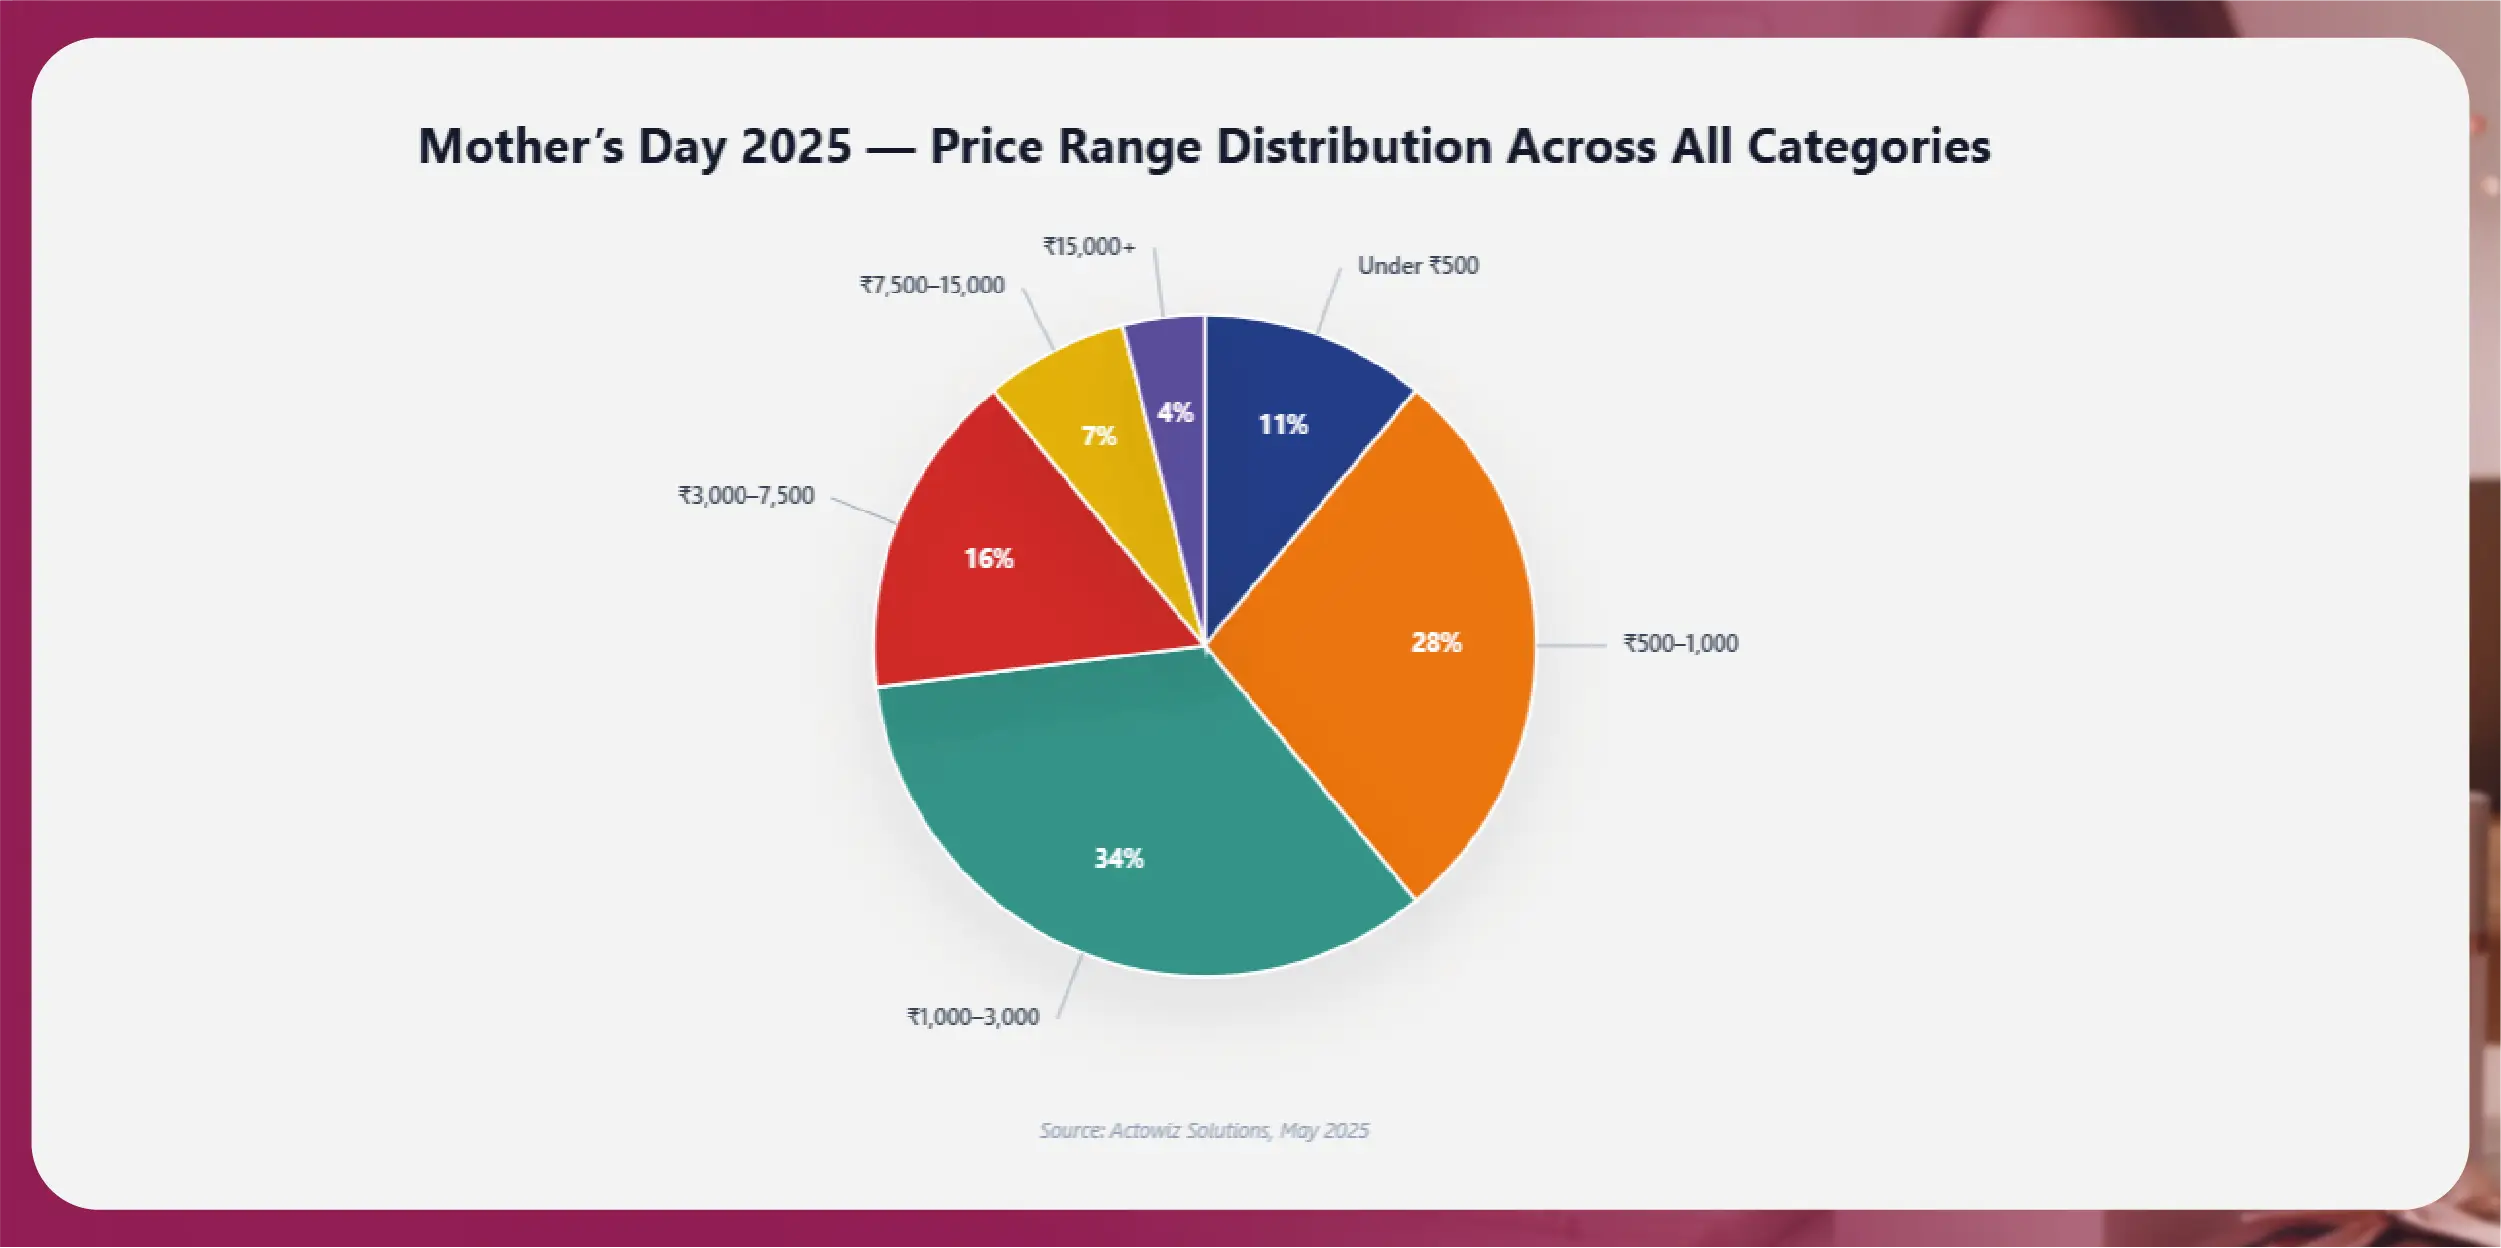
The pricing structure of Mother's Day inventory in 2025 was notably bottom-heavy, reflecting the gifting nature of the occasion — most shoppers indexed toward 'thoughtful but affordable' rather than premium spending. Yet within this distribution, a clear premium bracket also emerged, indicating dual-segment behavior.
The largest price band was ₹1,000-3,000, which accounted for 34% of all tracked SKUs. This range represents the gifting comfort zone — substantial enough to feel meaningful, affordable enough to avoid social pressure or financial strain. Categories that dominated this band included beauty hampers, personalized gifts, mid-range bouquets, and silver jewelry.
The ₹500-1,000 band came in second at 28% of SKUs. This was the territory of impulse gifts and add-ons — small chocolate boxes, single-stem bouquets, photo prints, simple home decor pieces, and entry-level beauty products. Importantly, this band saw the highest sponsored ad placement density, suggesting platforms were using this price point as the entry-funnel hook for first-time Mother's Day shoppers.
At the lower extreme, 11% of SKUs were priced under ₹500. These were primarily greeting cards, single chocolate bars, small accessories, and lower-tier personalized items like keychains and fridge magnets. This band had high listing volume but extremely low individual SKU revenue — relevant for marketplace volume strategies, less so for revenue planning.
In the premium tiers, ₹3,000-7,500 accounted for 16% of SKUs and was dominated by jewelry, premium beauty hampers, branded apparel, and mid-tier experience gifts. This range turned out to be the highest-margin band for sellers, with the lowest discount intensity.
The ₹7,500-15,000 band held 7% of SKUs — primarily jewelry, designer apparel, premium home decor, and bundled spa or travel experiences. Above ₹15,000, only 4% of SKUs were tracked, mostly fine jewelry, gold ornaments, and luxury watches. While volume was minimal, these listings drove a disproportionate share of total Mother's Day GMV — our estimates place the ₹15,000+ segment at 19% of total Mother's Day revenue across tracked platforms despite being only 4% of listings.
This bimodal distribution — heavy mass-market gravity with a thin premium spike — is a defining feature of Indian Mother's Day commerce, and brands that operate in either band need radically different pricing intelligence strategies.
3. Discount Patterns by Category
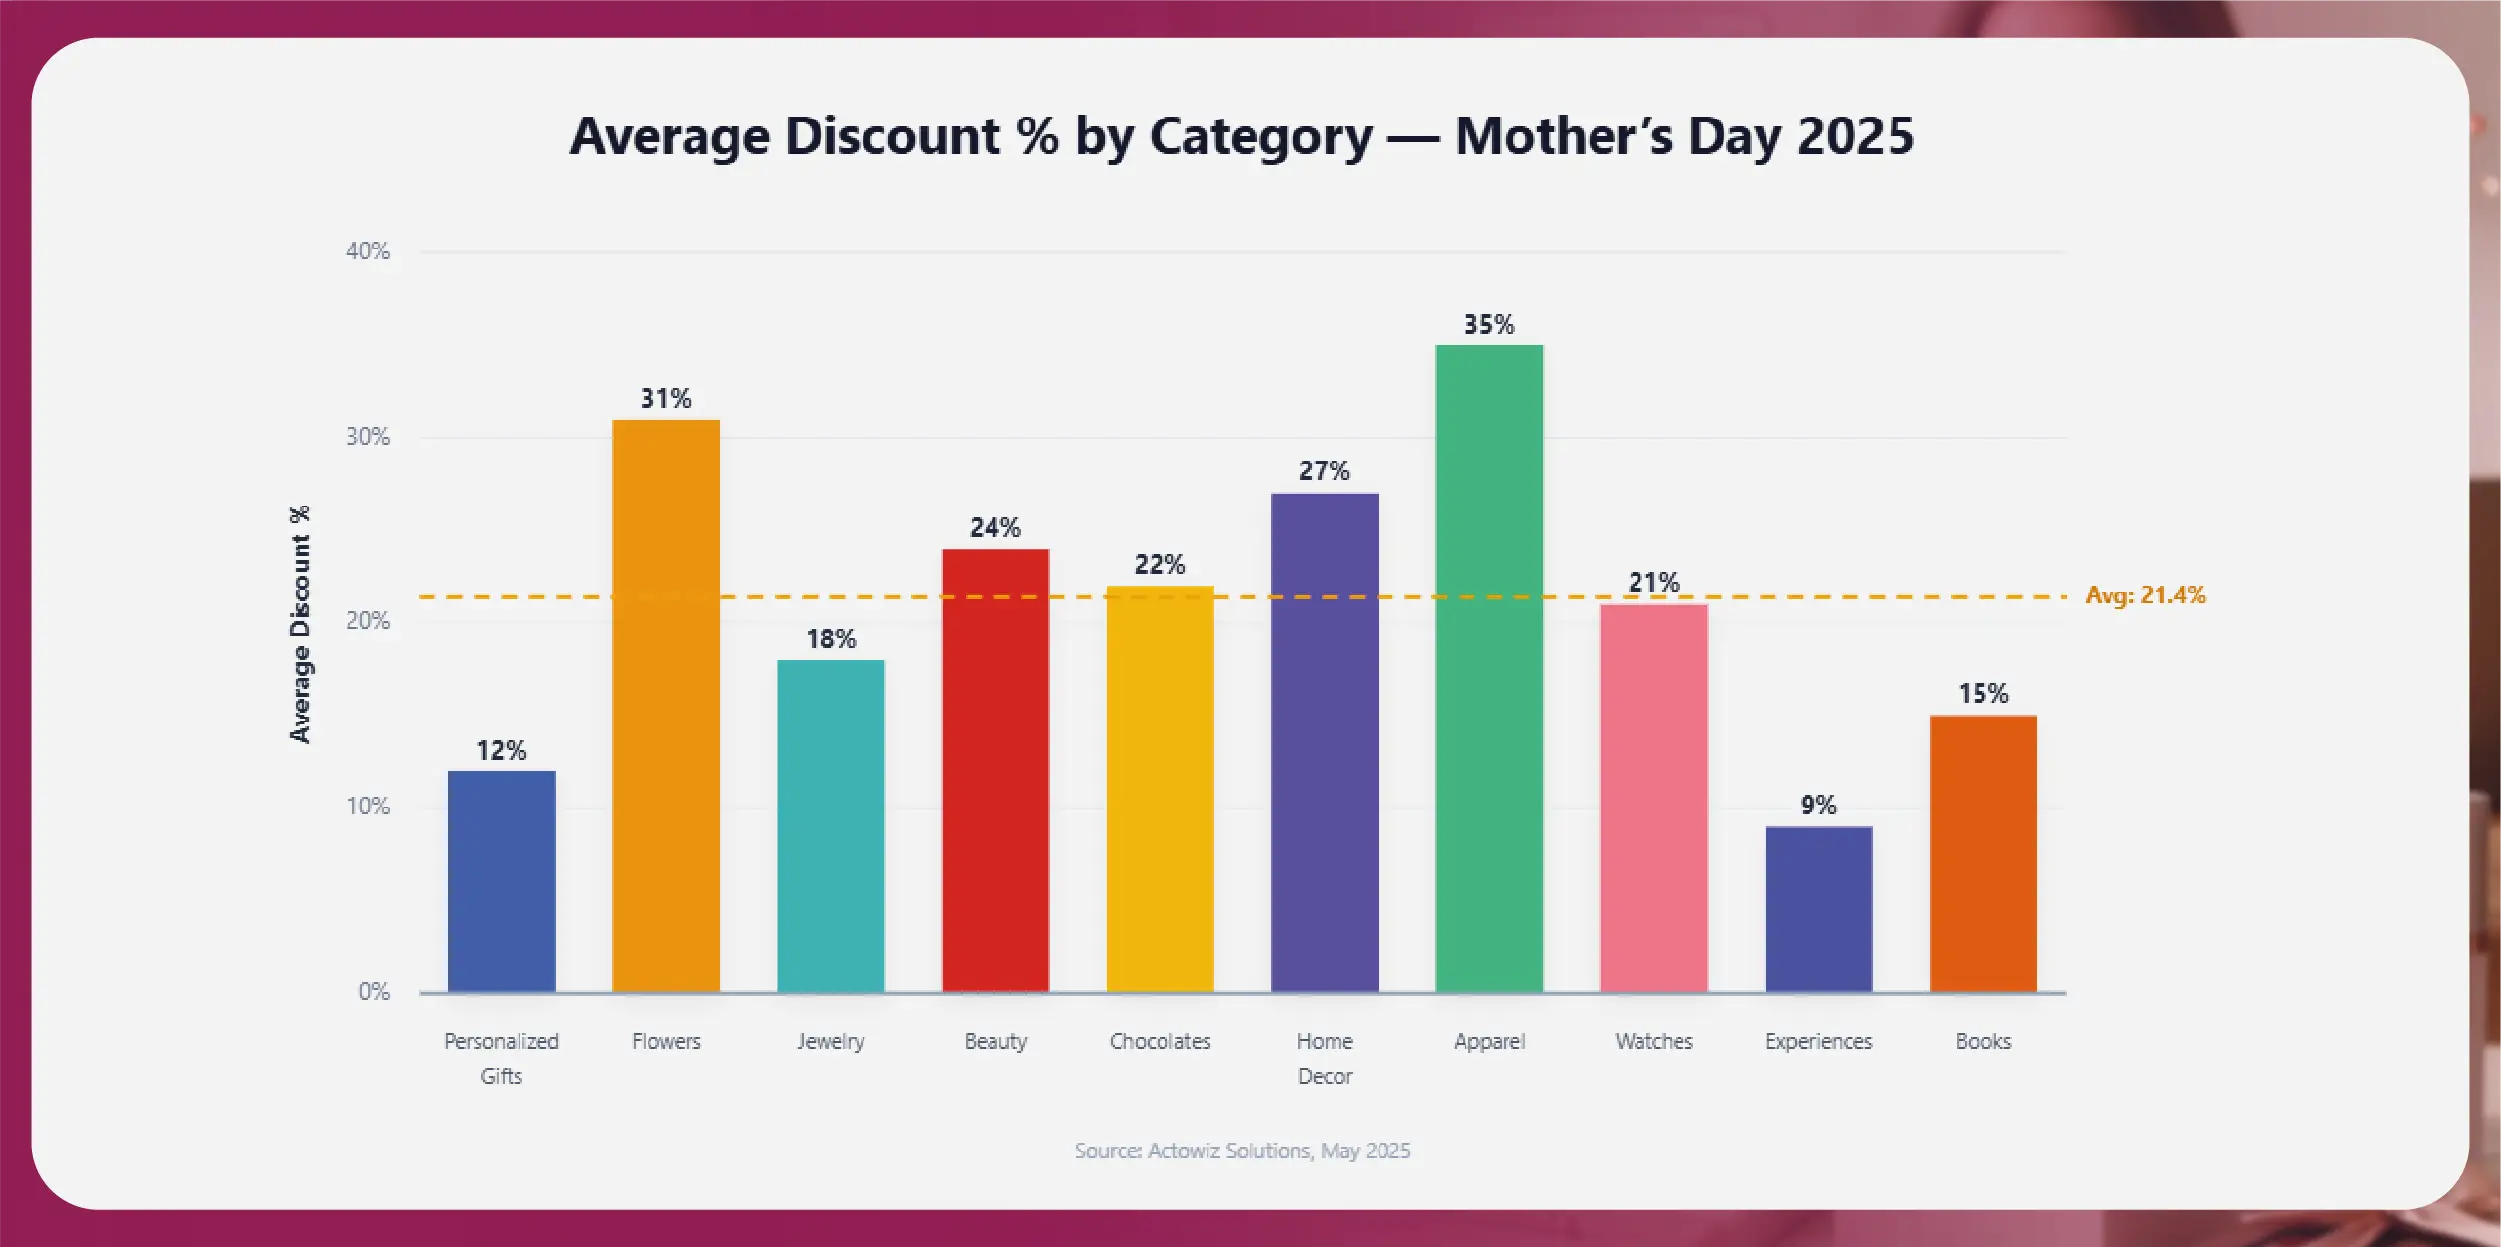
If there is one metric that best captures the chaotic energy of Mother's Day week, it is discount behavior. Across the 47,000+ SKUs tracked, the cross-category average discount in 2025 was 21.4% — but this aggregate masks dramatic category-by-category variance.
Apparel and sarees led the discount intensity at 35% average reduction. This was a surprise compared to the 2024 baseline (24%) and reflects increasingly aggressive price wars between Myntra, Ajio, and Flipkart's clothing verticals during the Mother's Day window. Many brands pulled forward summer sale calendars to coincide with Mother's Day weekend, blurring what had historically been distinct promotional events.
Fresh flowers came in second at 31% average discount. Floral pricing has a distinct dynamic: stems must move quickly or perish, so platforms like FNP and IGP heavily discount unsold inventory in the final 24 hours. We observed flower discounts spiking to 45-50% on the morning of May 11 itself — last-minute panic selling to clear stock.
Home decor followed at 27%, with Pepperfry, Urban Ladder, Wakefit, and Amazon Home heavily promoting wall art, bedding, and kitchen accessories. Beauty and skincare came in at 24%, driven by Nykaa's aggressive Mother's Day combo bundling. Chocolates and gourmet held at 22%.
The most disciplined category was experience gifts at just 9% average discount. This makes sense — a spa voucher or staycation package has tightly negotiated wholesale pricing, leaving little room for reseller markdowns. Personalized gifts came in next-lowest at 12%, reflecting their perceived emotional value: brands have learned that buyers are willing to pay full price for customization, and aggressive discounting actually erodes the premium positioning.
| Category |
Avg Discount |
Behavior Pattern |
| Apparel & Sarees |
35% |
Aggressive — pulled-forward summer sale calendars |
| Fresh Flowers |
31% |
Spikes 45-50% in final 24 hrs (perishable inventory) |
| Home Decor |
27% |
Heavy promotion on Pepperfry, Urban Ladder, Wakefit |
| Beauty & Skincare |
24% |
Combo bundling, especially on Nykaa |
| Chocolates & Gourmet |
22% |
Steady mid-week discounting |
| Watches & Accessories |
21% |
Brand-protected, controlled discounting |
| Jewelry |
18% |
Disciplined; gold-plated more aggressive than fine jewelry |
| Books & Stationery |
15% |
Low-margin; small absolute discount value |
| Personalized Gifts |
12% |
Minimal — emotional value commands full price |
| Experience Gifts |
9% |
Lowest — tightly negotiated wholesale, little margin |
The strategic implication for brands is clear: the assumption that 'everything must go on heavy discount during peak weekends' is false. Categories with strong emotional pull (personalization) or perceived irreplaceability (experiences) actually benefit from holding the line on price. A brand entering the Mother's Day weekend without a clear sense of category-specific discount benchmarks is essentially flying blind — potentially leaving margin on the table or losing share by under-discounting in a hot category.
4. Stock-Out Trends
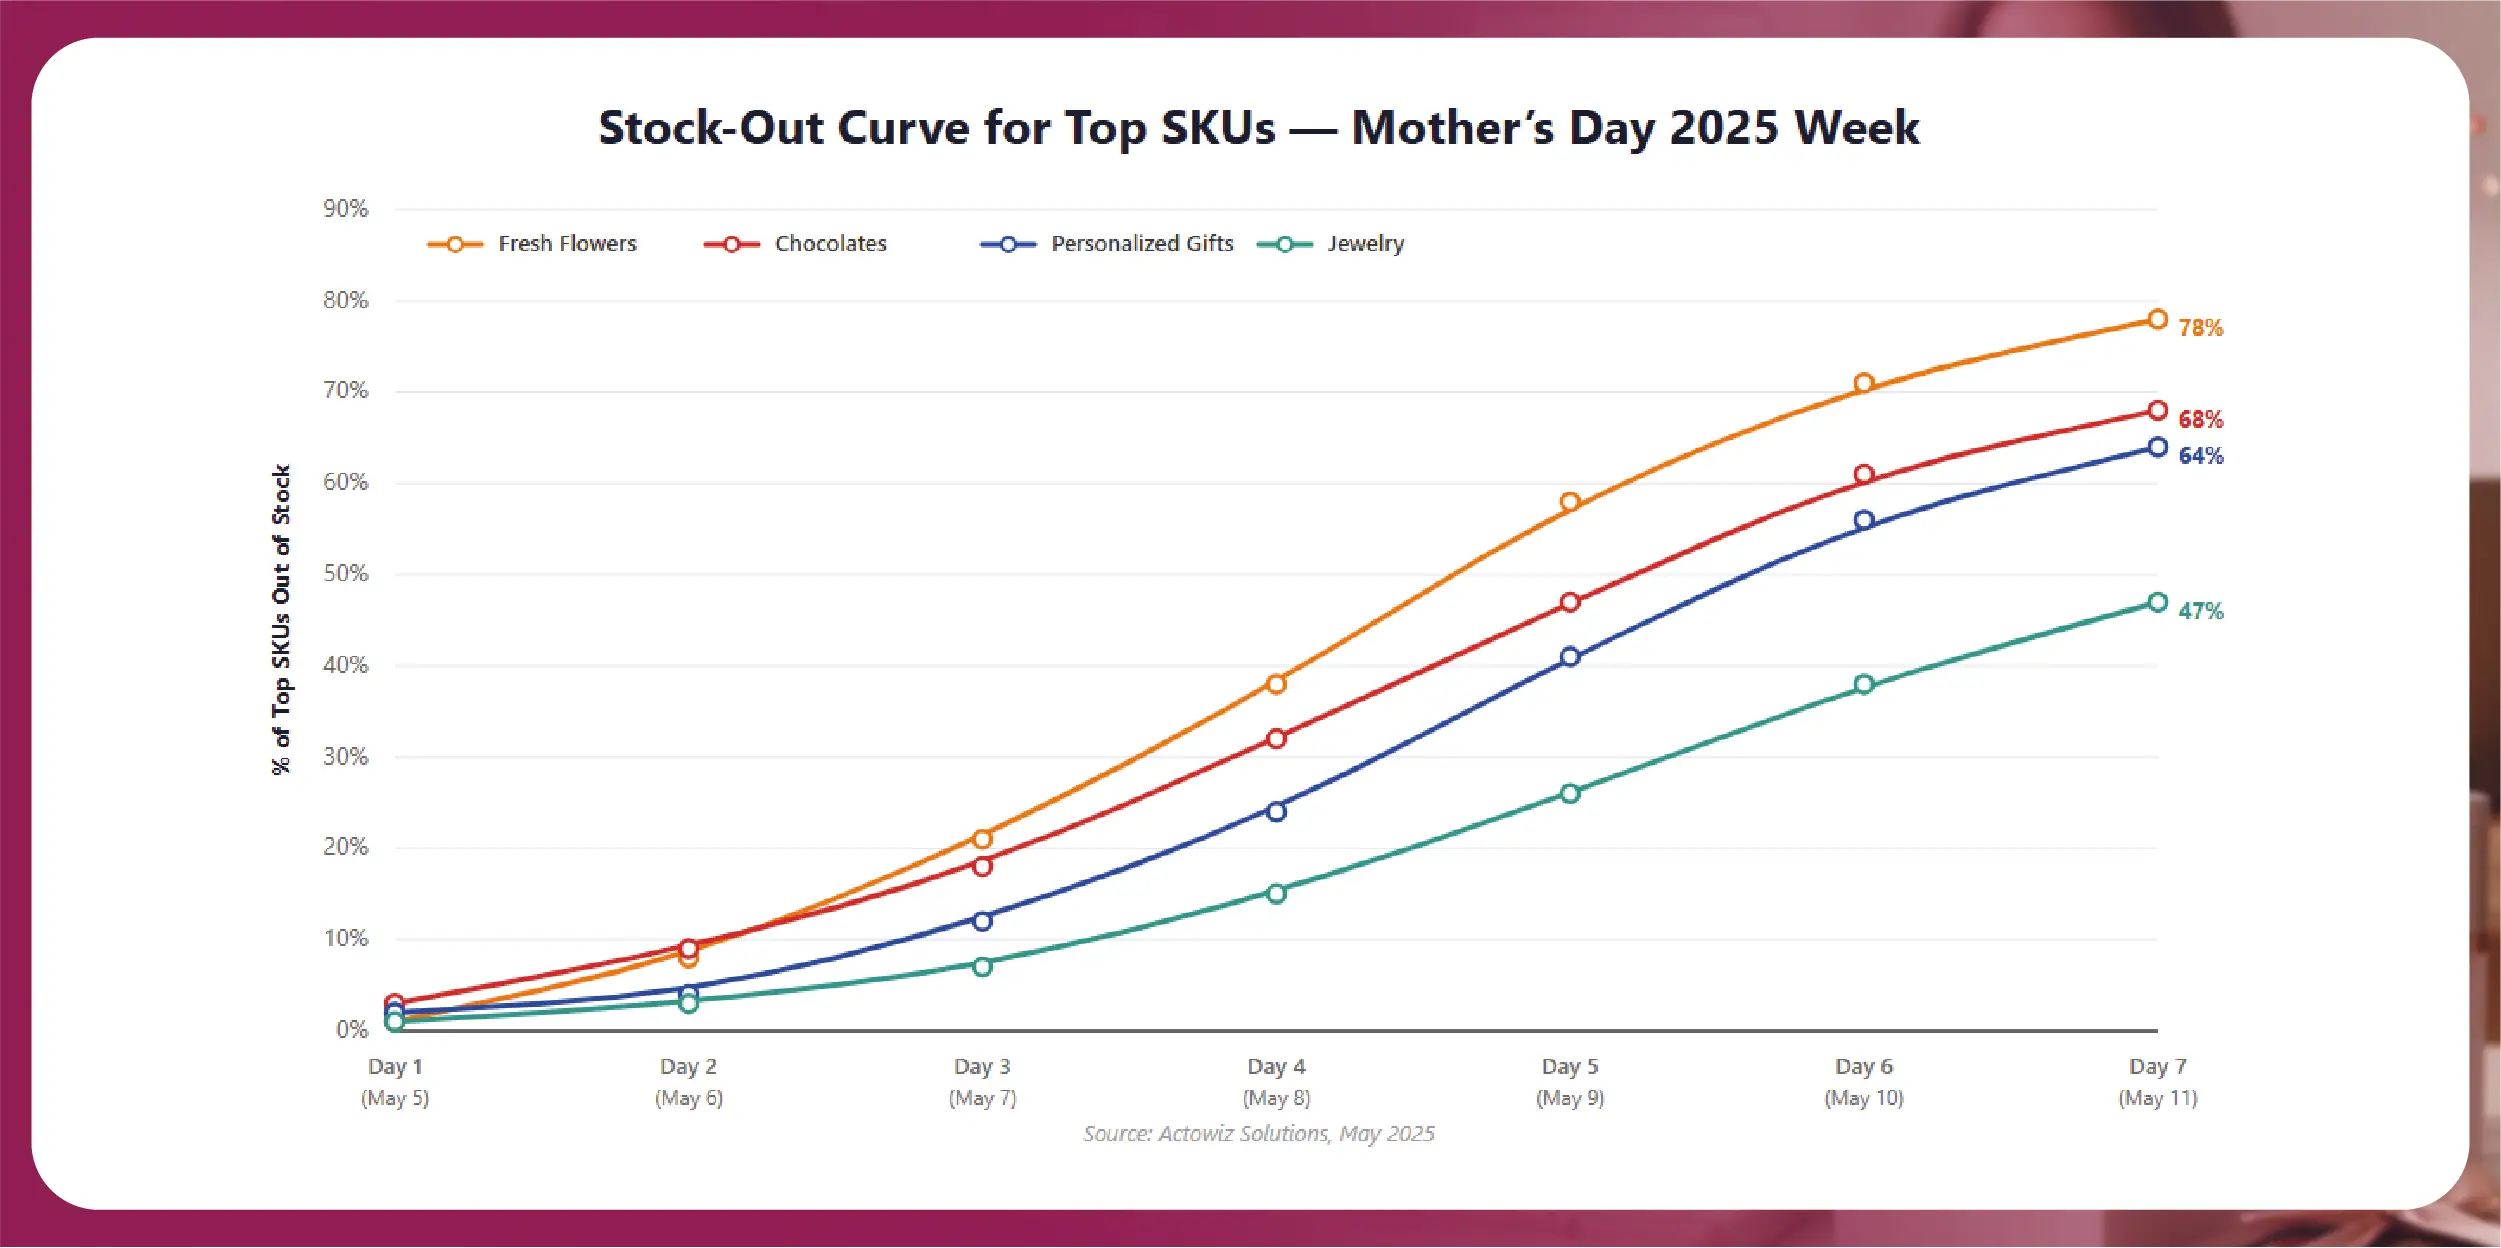
Stock-out behavior is one of the most under-discussed but commercially decisive dynamics of peak shopping events. Our 2025 tracking reveals a clear pattern: top-ranked Mother's Day SKUs began going out of stock within 36 hours of major listing pushes, and by Day 3, more than 1 in 5 top flower SKUs were unavailable.
Fresh flowers had the steepest stock-out curve. By Day 7 (the day after Mother's Day), 78% of the top-100 flower SKUs we tracked were marked out of stock or 'delivery unavailable.' This is partly logistical — fresh-flower supply chains have hard capacity ceilings that cannot be expanded mid-week — and partly strategic, with sellers pulling listings to avoid late-delivery refunds.
Chocolates and gourmet showed a similar curve, with 68% of top SKUs stocked-out by Day 7. The driver here is different: chocolate demand peaks in the final 48 hours when last-minute shoppers buy gifts for same-day or next-day delivery, and warehousing constraints (especially for premium imported chocolates) create stock pressure.
Personalized gifts displayed a more gradual curve, ending Day 7 at 64% stock-out. Personalization brands face a unique constraint: each unit is custom-produced, so stock depends on how many production slots are open in the cutting/printing/engraving queue. Brands with strong production capacity (IGP, Vistaprint) held inventory longer; smaller D2C custom-gift sellers ran out fastest.
Jewelry was the most stock-resilient category, ending Day 7 at only 47% stock-out. Branded jewelry players (Tanishq, CaratLane, Bluestone) maintain deeper inventory pools and have replenishment cycles that flow through the week. Jewelry also doesn't suffer the same urgency as flowers — buyers who want to gift jewelry on Mother's Day typically purchase several days in advance.
The commercial implication is stark: by Day 4, the SKUs that were ranking on Day 1 are no longer the SKUs that customers can actually buy. Search results, recommendation widgets, and ad placements that reference out-of-stock SKUs effectively burn impression budget and degrade user experience. Brands that monitor competitor stock-outs in real-time can reroute their ad spend, surface their own in-stock SKUs into the vacated shelf space, and capture share. Brands that don't will continue to bid against ghost inventory. This is precisely the operational use case where real-time scraping pays for itself within a single weekend.
5. Platform Comparison — India
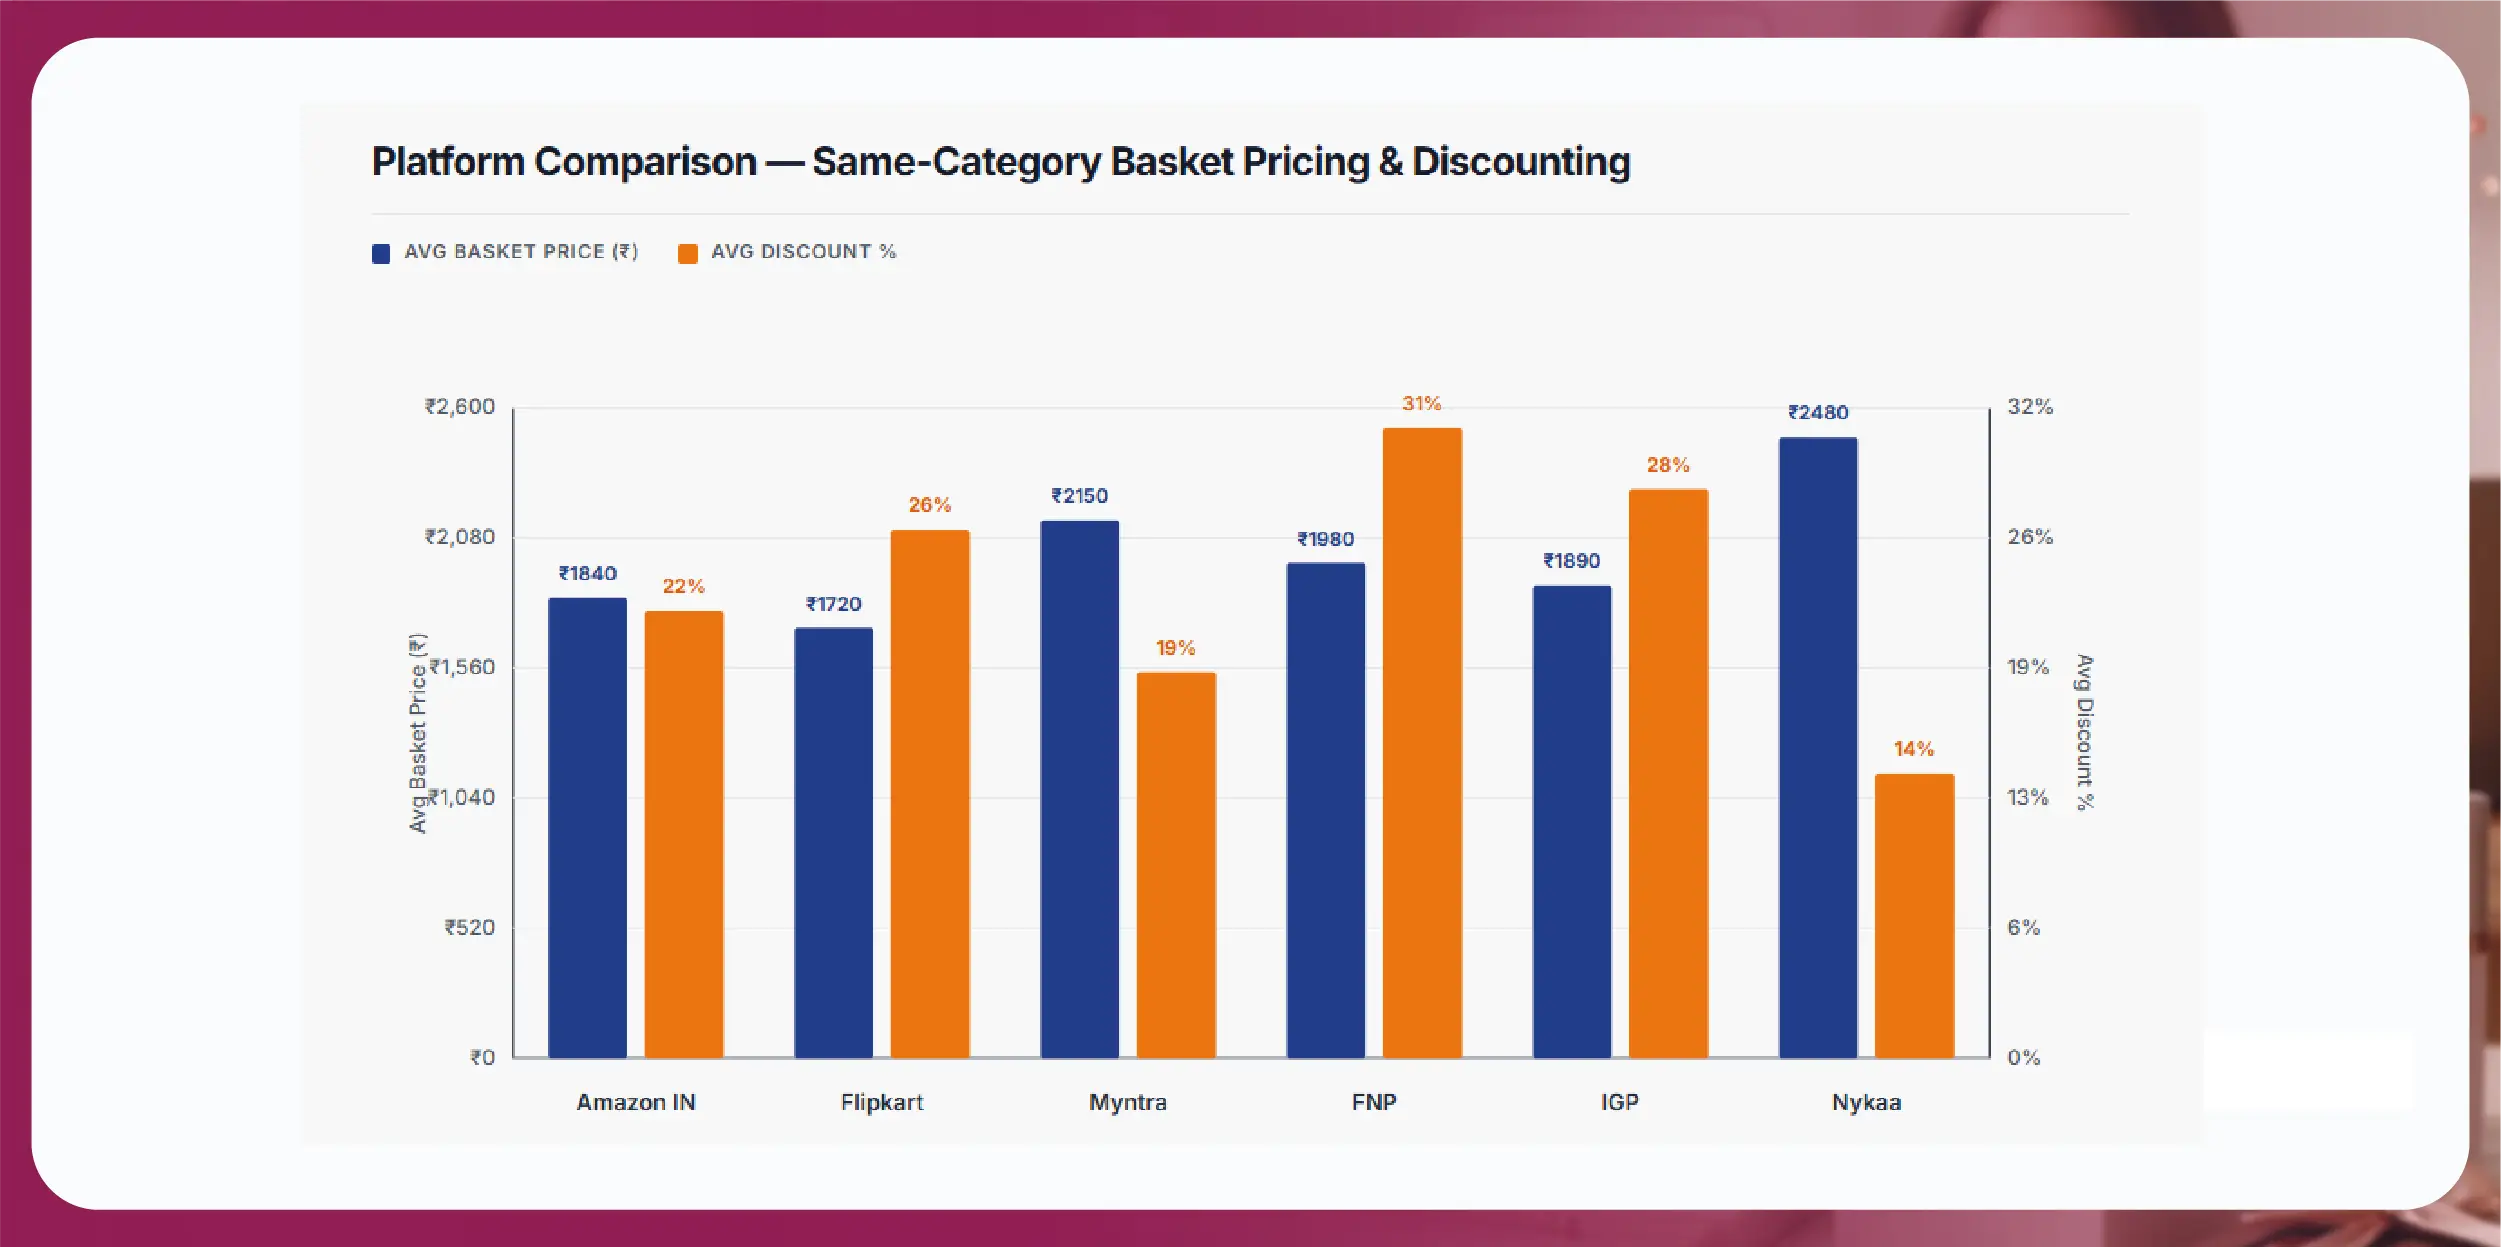
The same gift basket, monitored across six major Indian platforms during Mother's Day 2025, revealed pricing and discounting variance that should be unsettling for any brand operating multi-channel. We constructed a normalized basket of 12 representative SKUs (one bouquet, one chocolate box, one personalized photo frame, one beauty hamper, one silver pendant, etc.) and tracked their average prices and discounts across platforms.
Flipkart had the lowest average basket price at ₹1,720, paired with a 26% average discount. Flipkart's strategy in 2025 was clearly volume-driven: aggressive markdowns, heavy sponsored placements on home page, and Plus member exclusive deals that further stacked discounts. Flipkart's Mother's Day store ran from May 4 to May 12 with daily flash sales.
Amazon India came in second on price at ₹1,840 (22% discount). Amazon's discounting was less aggressive but more consistent — fewer flash sale spikes, more steady reduction across the entire week. Amazon also dominated sponsored placements in the search results, often pushing in-house brands (Solimo, AmazonBasics) into the gift carousel.
FNP averaged ₹1,980 with the highest discount intensity at 31%. As a category-specialist platform, FNP's pricing was more aggressive than mass-market players, particularly on flower-jewelry combo bundles. IGP followed close behind at ₹1,890 (28% discount), with similar aggression.
Myntra had the second-highest basket price at ₹2,150 and the lowest discount intensity at 19%. This reflects Myntra's brand mix — heavier presence of premium and aspirational brands (Forever 21, Vero Moda, FabIndia) where steep discounting is brand-protective. Nykaa had the highest basket price at ₹2,480 with the lowest discount at 14%, structurally a beauty-led platform with heavy premium and luxury skew.
| Platform |
Avg Basket (₹) |
Avg Discount |
Strategy Signature |
| Flipkart |
₹1,720 |
26% |
Volume-driven; Plus member exclusives |
| Amazon India |
₹1,840 |
22% |
Steady, sponsored-heavy placements |
| IGP |
₹1,890 |
28% |
Category specialist; bundle aggression |
| FNP |
₹1,980 |
31% |
Highest discount; flower-led combos |
| Myntra |
₹2,150 |
19% |
Premium brand mix; curated discounting |
| Nykaa |
₹2,480 |
14% |
Beauty-luxury skew; minimal discount |
The variance is striking: a shopper buying the same basket of items would pay ₹1,720 on Flipkart and ₹2,480 on Nykaa — a 44% spread. Even between mass-market peers (Amazon vs Flipkart), the spread was ₹120 per basket, or roughly 7%. For brands selling on multiple platforms, this means platform-specific pricing strategy is no longer optional. Brands that allowed identical SKUs to list at different prices across platforms in 2025 frequently saw arbitrage flows and customer complaints about 'cheaper on Flipkart' — a brand-trust issue at scale.
6. US Market — Cross-Border Insights
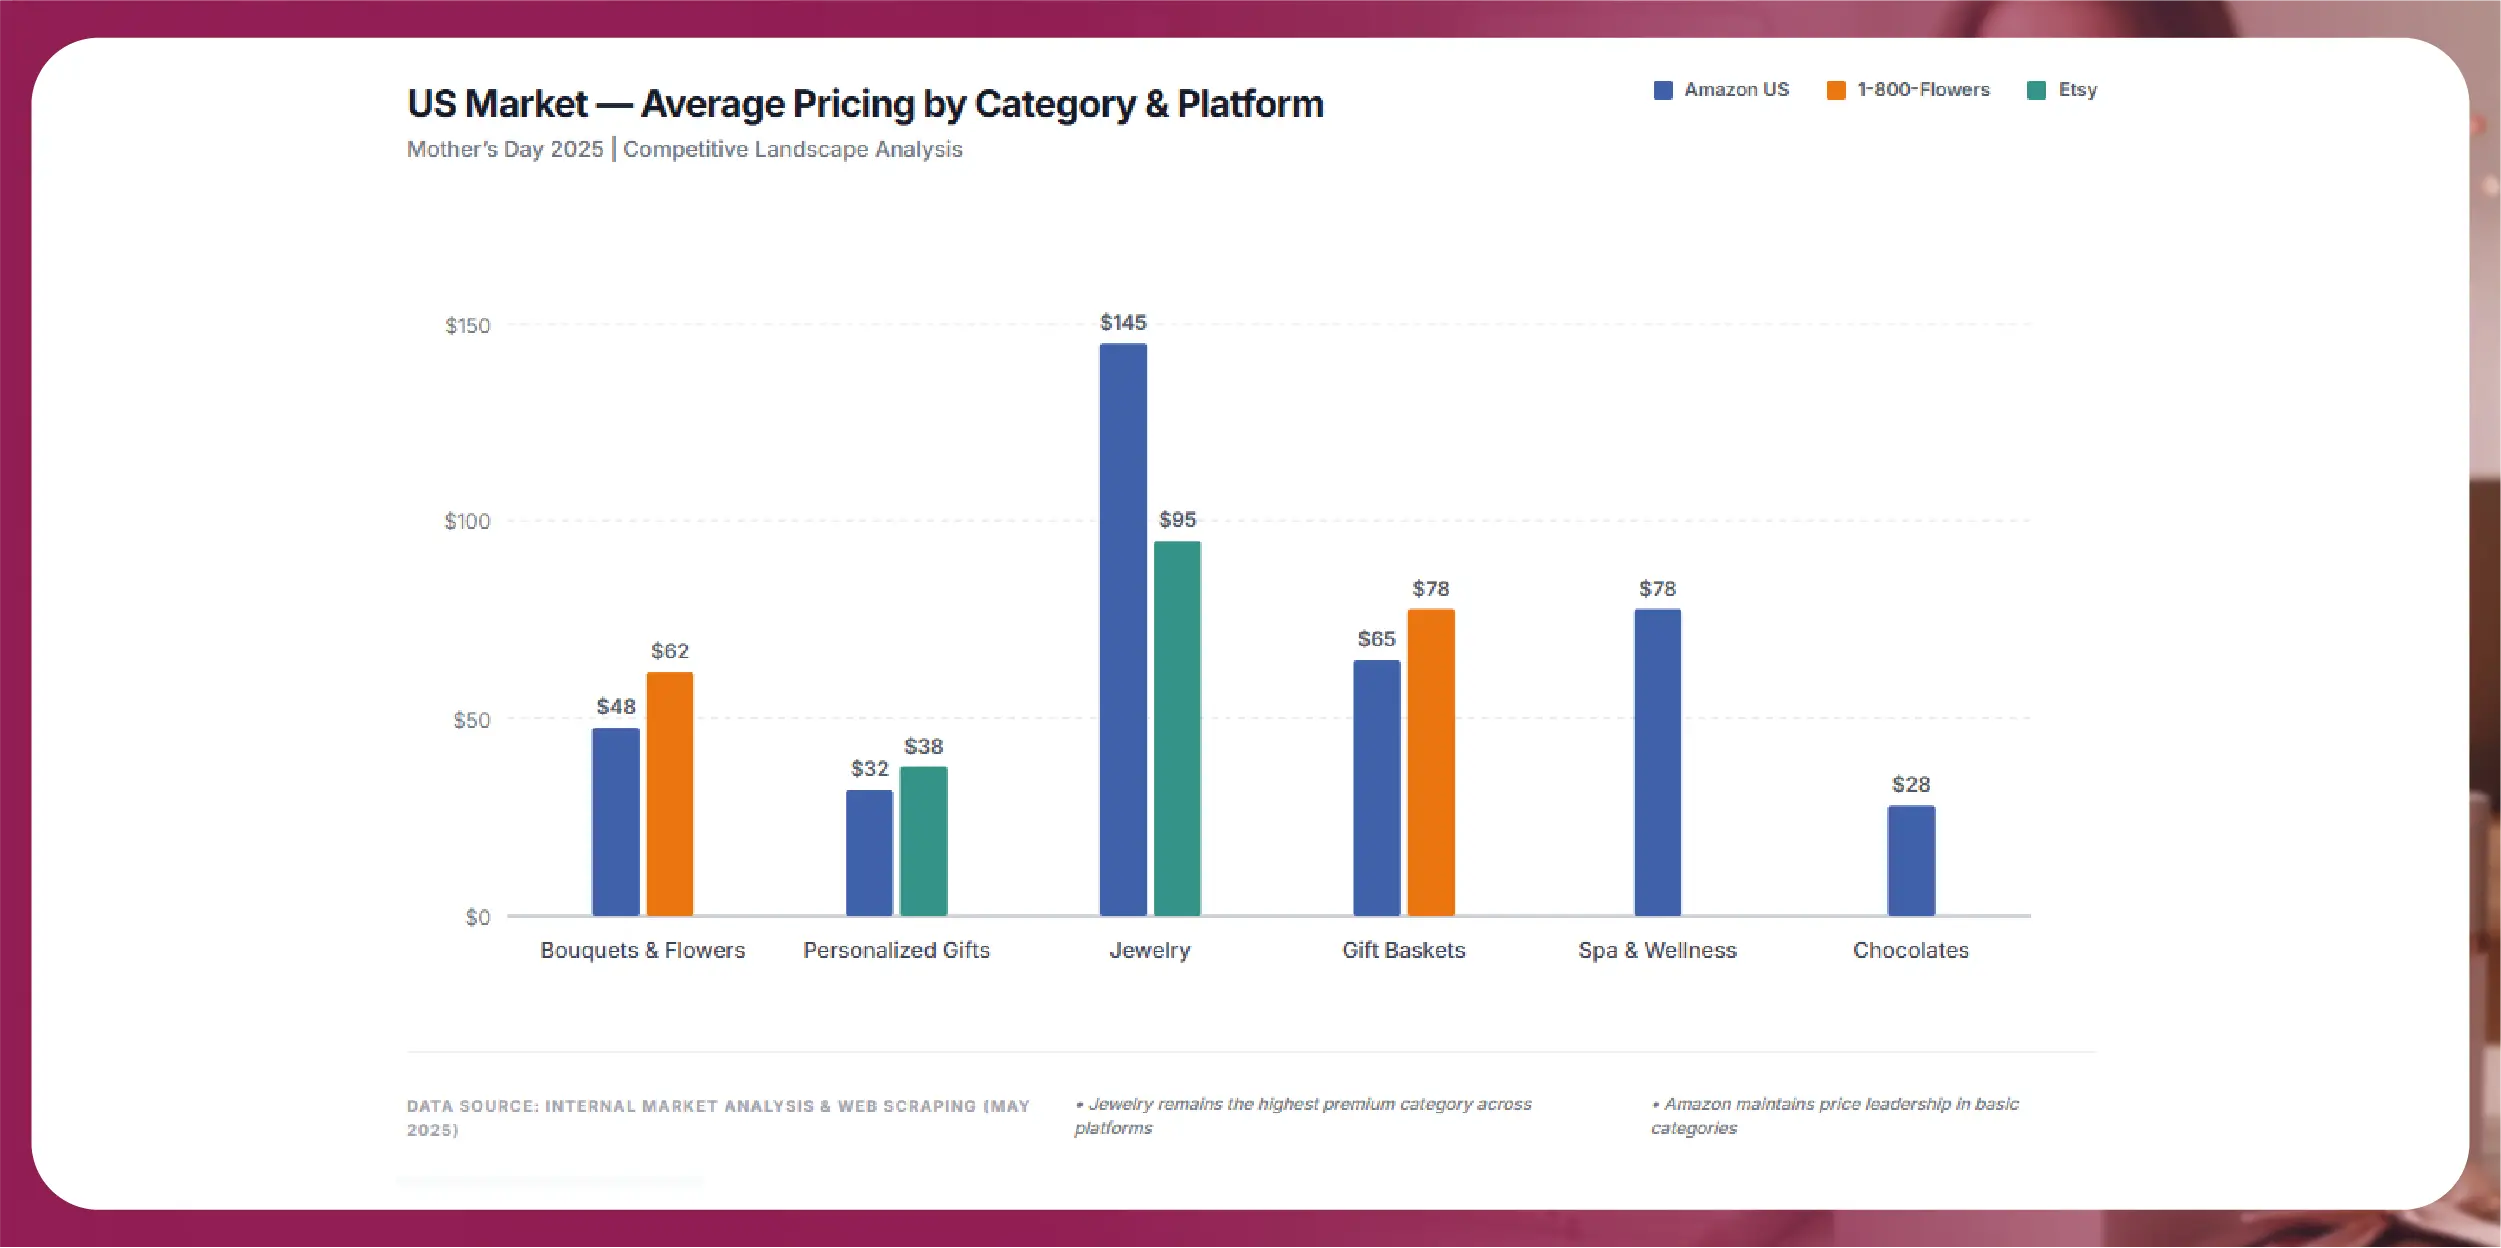
The US Mother's Day market is structurally different from India in ways that matter for any brand operating cross-border. The US occasion is more commercially mature, more category-fragmented, and significantly higher in average ticket size. Our 2025 tracking covered Amazon US, 1-800-Flowers, Etsy, and ProFlowers across approximately 15,200 SKUs.
In the bouquets and flowers category, 1-800-Flowers had an average price of $62 per arrangement, while Amazon US averaged $48. The price differential reflects 1-800-Flowers' positioning as a category specialist (faster delivery, branded packaging, stronger guarantee), while Amazon US is more price-anchored. Etsy did not feature meaningfully in fresh flowers (most Etsy floral listings are dried or preserved arrangements).
Personalized gifts on Etsy averaged $38, compared to Amazon US at $32. Etsy's strength here is unmatched: artisan sellers, longer customization options, and a Mother's Day-specific gift guide that drives massive seasonal traffic to the platform. We tracked over 6,800 Etsy SKUs tagged with 'Mother's Day' or 'gift for mom' in 2025 — a 22% increase year-on-year.
In jewelry, Etsy averaged $95 (handmade and vintage skew), while Amazon US averaged $145 (more mainstream brands). 1-800-Flowers' add-on jewelry option averaged below $80 but had limited depth.
Gift baskets — a uniquely strong US category — averaged $78 on 1-800-Flowers and $65 on Amazon US, with significant overlap in supplier networks behind both platforms. Spa and wellness gift cards (a category much less developed in India) averaged $78 on Amazon US, often through resellers like Spafinder. This is a meaningful insight: experience gifting in the US is mostly delivered through digital gift cards rather than booked experiences, simplifying logistics.
Discount intensity in the US ran lower than India — averaging 17% across the basket vs India's 21%. This reflects the US market's longer lead time (Mother's Day is more pre-planned) and the relative absence of last-minute panic discounting. For brands looking to scale Mother's Day operations cross-border, this is a margin-positive insight: US-side launches need less aggressive pricing strategy, but stronger creative differentiation and SEO investment.
7. Predictions for Mother's Day 2026
Based on our 2025 data and early April 2026 listing observations, several Mother's Day 2026 trends are already visible.
Listing Volume Up ~14%
Listing volume is up an estimated 14% across tracked categories. Personalized gifts and beauty hampers are the fastest-growing, while books and stationery continues to decline as a Mother's Day category. We expect 2026 total tracked SKU count to cross 54,000.
Pricing Volatility Will Intensify
Expect intensified pricing volatility. With the Indian e-commerce market increasingly populated by quick-commerce players (Zepto, Blinkit, Instamart) targeting last-minute gifters, the sub-₹1,000 segment is likely to see hour-by-hour repricing in the final 48 hours.
Sponsored Placement Competition Will Spike
Sponsored placement competition will rise sharply. Our April 2026 sample shows ad density on Mother's Day-tagged search terms is already 1.8x what it was at the same point in 2025. Platforms are aggressively monetizing the seasonal spike, and brands without sponsored ad monitoring will be invisible in critical search slots.
Stock-Out Cycles Will Compress
As more brands run lean inventory strategies post-2024, expect Day 1 to Day 4 stock-out percentages to be higher than 2025 — meaning the window for share capture from competitor stock-outs is shorter. Real-time inventory monitoring becomes the key differentiator.
Cross-Border NRI Gifting Surge
US-India cross-border gifting (NRIs sending gifts to India) is a fast-growing micro-segment. FNP and IGP have both expanded their US customer acquisition, and we expect this segment to hit 8-10% of FNP's Mother's Day GMV in 2026. This is a meaningful new battleground for gifting brands.
Brands that prepare with real-time pricing intelligence, competitor inventory tracking, and ad placement monitoring will significantly outperform peers operating on lagging data or instinct.
How Actowiz Solutions Helps Brands Win
Actowiz Solutions provides custom web scraping and competitor intelligence services tailored for e-commerce, retail, and D2C brands. For seasonal events like Mother's Day, our offerings include:
- Real-time pricing intelligence across 100+ platforms — refresh frequencies as low as 15 minutes
- Stock and inventory monitoring with automated stock-out alerts via email or Slack
- Sponsored ad placement and search rank tracking across platforms
- Review sentiment analysis and complaint detection during high-volume campaign weeks
- Custom dashboards and visualizations through
- Historical trend benchmarking and category-level research
- Cross-border data — India, US, UK, UAE, and Southeast Asia
We work with leading gifting, jewelry, beauty, and apparel brands across India, the US, and Southeast Asia. Our infrastructure has supported live monitoring during Black Friday, Diwali, Valentine's Day, Akshaya Tritiya, and other peak commerce events.
Ready to Get Mother's Day 2026 Right?
Get a custom-configured live tracking pipeline for your brand — pricing, stock, ads, reviews — across the platforms that matter to you. Setup typically takes 5-7 business days
Contact Us
 Core Scraping Services
Amazon Data Scraping #1 Walmart Data Scraping Shopify Store Scraping HOT TikTok Shop Scraping HOT Flipkart Data Scraping
Core Scraping Services
Amazon Data Scraping #1 Walmart Data Scraping Shopify Store Scraping HOT TikTok Shop Scraping HOT Flipkart Data Scraping Top Global Platforms
 Platforms by Region
🇺🇸 USA🇬🇧🇪🇺 UK/EU🇮🇳 India🇦🇪 ME🌏 SEA🌎 LATAM🇨🇳🇯🇵🇰🇷🇦🇺 AUAmazon Data Scraping #1 Walmart Data Scraping Target Data Scraping NEW Shopify Scraping HOT TikTok Shop Scraping HOT Costco Data Scraping NEW Best Buy Scraping NEW Home Depot Scraping NEW Etsy Data Scraping NEW Shein Data Scraping NEW DoorDash Scraping NEW Instacart Scraping NEWTesco Data Scraping NEW Sainsbury's Scraping NEW ASDA Data Scraping NEW Ocado Scraping NEW ASOS Data Scraping NEW Rightmove Scraping NEW Deliveroo Scraping NEW Zalando Scraping NEW Otto Scraping NEW Cdiscount Scraping NEW Carrefour Scraping NEW Allegro Scraping NEW Bol.com Scraping NEWFlipkart Data Scraping JioMart Data Scraping NEW BigBasket Scraping NEW Myntra Data Scraping NEW Nykaa Data Scraping NEW Blinkit Data Scraping Zepto Data Scraping Zomato Data Scraping Swiggy Data ScrapingNoon Data Scraping NEW Amazon.ae Scraping NEW Talabat Data Scraping NEW Careem Data Scraping NEW PropertyFinder Scraping NEW
Platforms by Region
🇺🇸 USA🇬🇧🇪🇺 UK/EU🇮🇳 India🇦🇪 ME🌏 SEA🌎 LATAM🇨🇳🇯🇵🇰🇷🇦🇺 AUAmazon Data Scraping #1 Walmart Data Scraping Target Data Scraping NEW Shopify Scraping HOT TikTok Shop Scraping HOT Costco Data Scraping NEW Best Buy Scraping NEW Home Depot Scraping NEW Etsy Data Scraping NEW Shein Data Scraping NEW DoorDash Scraping NEW Instacart Scraping NEWTesco Data Scraping NEW Sainsbury's Scraping NEW ASDA Data Scraping NEW Ocado Scraping NEW ASOS Data Scraping NEW Rightmove Scraping NEW Deliveroo Scraping NEW Zalando Scraping NEW Otto Scraping NEW Cdiscount Scraping NEW Carrefour Scraping NEW Allegro Scraping NEW Bol.com Scraping NEWFlipkart Data Scraping JioMart Data Scraping NEW BigBasket Scraping NEW Myntra Data Scraping NEW Nykaa Data Scraping NEW Blinkit Data Scraping Zepto Data Scraping Zomato Data Scraping Swiggy Data ScrapingNoon Data Scraping NEW Amazon.ae Scraping NEW Talabat Data Scraping NEW Careem Data Scraping NEW PropertyFinder Scraping NEW Pricing & Promotions
MAP Violations Brand Protection Counterfeit Detection Price Intelligence AI HOT Data Intelligence
Pricing & Promotions
MAP Violations Brand Protection Counterfeit Detection Price Intelligence AI HOT Data Intelligence Brand & Intelligence
Share of Search Content Audit & PDP Reviews & Ratings Retail Media Buy Box Monitoring Social Commerce HOT Live Commerce NEW Agentic Commerce NEW
Brand & Intelligence
Share of Search Content Audit & PDP Reviews & Ratings Retail Media Buy Box Monitoring Social Commerce HOT Live Commerce NEW Agentic Commerce NEW Digital Shelf & Search
Assortment Planning Competitive Benchmarking Product Availability Seller Intelligence NEW Q-Commerce NEW
Digital Shelf & Search
Assortment Planning Competitive Benchmarking Product Availability Seller Intelligence NEW Q-Commerce NEW AssortmentE-commerce Intelligence Hyperlocal Insights POI & Store Locator DTC Brand Analytics NEW
 For Retailers
 E-Commerce Dashboard
 Flipkart Insights (Live) #1
 Grocery Intelligence
.svg) Grocery Price (U.S.)
Grocery Price (U.S.)
.svg) Quick Commerce (India) HOT
Quick Commerce (India) HOT
 Food & Restaurant
 Fashion Intelligence
 Automotive
 Travel & Hospitality
 Real Estate
 Food Delivery Intelligence SOON
 OTT & Streaming SOON
 By Use Case
 Pricing Intelligence
 Digital Shelf Analytics
 MAP Monitoring HOT
 Cross-Border Price Parity NEW
 Share of Search
 Review Sentiment
 Kitchen Market Gaps NEW
 Dynamic Pricing / AI Repricing SOON
 Promotions & Deals Alerts SOON
 B2B / POI & Lead Data SOON
 By Region🇮🇳 India 🇺🇸 USA 🇦🇪 Middle East 🇬🇧 UK 🇦🇺 Australia 🌏 SE Asia 🇪🇺 Europe 🌎 LATAMIndia
 Flipkart Real-Time Insights
 Quick Commerce — Zepto · Blinkit
USA
Quick Commerce — Zepto · Blinkit
USA Grocery Price Tracker (U.S.)
 GCC Q-Commerce — Talabat · Noon NEW
 Grocery Price — Tesco · Sainsbury's · Asda SOON
 Grocery Price — Coles · Woolworths SOON
Want THIS view for your brand · your city · your category? Custom dashboard in 7 days. Free Consultation →
Grocery Price — Coles · Woolworths SOON
Want THIS view for your brand · your city · your category? Custom dashboard in 7 days. Free Consultation → Marketplace Scrapers
Amazon API TikTok Shop API HOT Uber Eats API Airbnb API Zepto / Blinkit API Instacart API NEW Talabat API NEW
Marketplace Scrapers
Amazon API TikTok Shop API HOT Uber Eats API Airbnb API Zepto / Blinkit API Instacart API NEW Talabat API NEW Data APIsWeb Extract API Reviews API SERP API Pricing Webhook NEW
 Universal APIsLive Crawler API Scheduler Realtime Alerts Webhook Delivery 🐍 Python SDK 💚 Node.js SDK
 Delivery & SDKs
 Knowledge Center
Digital Shelf Playbook MAP Compliance Guide Pricing Intel Guide Scraping Compliance TikTok Shop Guide NEW Cross-Border Guide NEW
Knowledge Center
Digital Shelf Playbook MAP Compliance Guide Pricing Intel Guide Scraping Compliance TikTok Shop Guide NEW Cross-Border Guide NEW Guides & Playbooks
Sample Datasets HOT ROI Calculator NEW API Postman Collection Demo Dashboards Free API Playground NEW Press Kit
Guides & Playbooks
Sample Datasets HOT ROI Calculator NEW API Postman Collection Demo Dashboards Free API Playground NEW Press Kit Downloads & Tools
Trust Center About Us FAQs Careers
Downloads & Tools
Trust Center About Us FAQs Careers Trust & Company
 Grocery & FMCG
 Finance & Legal
 Healthcare & Pharma
 Media & Entertainment
 Emerging Industries