Market prices
Physical prices at named markets, with grade and variety preserved.
- Min, max and modal price per market
- Commodity, variety and grade detail
- Native unit and currency retained
- Normalised per-kg USD conversion

Scalable web, app and AI-powered collection across 40+ countries.
All services →Repricing driven by competitor moves rather than a weekly review.
Explore → Pricing & Promotions
 Brand & Intelligence
 Digital Shelf & Search
 Assortment
 For Retailers
Which solution fits?
Talk to ExpertTalabat, Careem Quik and Noon Minutes across 18 GCC cities.
Launch Demo →Tesco, Sainsbury's, Asda, Morrisons and Aldi, daily.
Get Early Access → E-Commerce Dashboard
 Flipkart Insights (Live) #1
 Grocery Intelligence
.svg) Grocery Price (U.S.)
Grocery Price (U.S.)
.svg) Quick Commerce (India) HOT
Quick Commerce (India) HOT
 Food & Restaurant
 Fashion Intelligence
 Automotive
 Travel & Hospitality
 Real Estate
 Food Delivery Intelligence NEW
 OTT & Streaming NEW
 By Use Case
 Pricing Intelligence
 Digital Shelf Analytics
 MAP Monitoring HOT
 Cross-Border Price Parity NEW
 Share of Search
 Review Sentiment
 Kitchen Market Gaps NEW
 Dynamic Pricing / AI Repricing NEW
 Promotions & Deals Alerts NEW
 B2B / POI & Lead Data NEW
 By Region
 Flipkart Real-Time Insights
 Quick Commerce — Zepto · Blinkit
 Pincode Price Tracker
 GCC Q-Commerce — Talabat · Noon NEW
 UK Grocery — Tesco, Sainsbury's, Asda
 AU Grocery — Coles & Woolworths NEW
Sources we already run pipelines against. Download a real sample from any of them.
Browse coverage → Marketplace Scrapers
 Developer APIs
 Universal APIs
 Delivery & SDKs
Fixed monthly retainer, named engineer, no per-request metering.
Managed Data API → Knowledge Center
 Guides & Playbooks
 Downloads & Tools
 Trust & Company
Scalable web, app and AI-powered collection across 40+ countries.
All 58 services →Repricing driven by competitor moves rather than a weekly review.
Explore → Pricing & Promotions
Brand & Intelligence
Digital Shelf & Search
Assortment For RetailersWhich solution fits?
Talk to ExpertSources we already run pipelines against. Download a real sample from any of them.
Browse coverage →Talabat, Careem Quik and Noon Minutes across 18 GCC cities.
Launch Demo →Tesco, Sainsbury's, Asda, Morrisons and Aldi, daily.
Get Early Access → E-Commerce Dashboard
Flipkart Insights (Live) #1
Grocery Intelligence
Grocery Price (U.S.)
Quick Commerce (India) HOT
Food & Restaurant
Fashion Intelligence
Automotive
Travel & Hospitality
Real Estate
Food Delivery Intelligence NEW
OTT & Streaming NEW
By Use Case
Pricing Intelligence
Digital Shelf Analytics
MAP Monitoring HOT
Cross-Border Price Parity NEW
Share of Search
Review Sentiment
Kitchen Market Gaps NEW
Dynamic Pricing / AI Repricing NEW
Promotions & Deals Alerts NEW
B2B / POI & Lead Data NEW
By Region Flipkart Real-Time Insights
Quick Commerce — Zepto · Blinkit
Pincode Price Tracker
GCC Q-Commerce — Talabat · Noon NEW
UK Grocery — Tesco, Sainsbury's, Asda
AU Grocery — Coles & Woolworths NEW
Marketplace Scrapers
Developer APIs Universal APIs Delivery & SDKsFixed monthly retainer, named engineer, no per-request metering.
Managed Data API → Knowledge Center
Guides & Playbooks
Downloads & Tools
Trust & CompanyFrom the markets that actually set the price.
Converting a mandi quintal price into a per-kilo figure looks helpful and quietly destroys the number's meaning. This service keeps native units.
Free pilot on your own sources, returned in 24 hours. No card, no trial clock — and you keep the sample data either way.
Last verified 5 August 2026 by the Actowiz Solutions Data Engineering team.
Agriculture and commodity data in the physical sense covers what changes hands at actual markets: the price a specific grade of a specific commodity fetched at a named market on a named date, the volume that arrived there, and the cost of the inputs that produced it. This is distinct from exchange-traded futures, and the distinction is not academic.
Futures prices reflect a standardised contract, a delivery location and a forward month, aggregating global sentiment and financial positioning. Physical market prices reflect what a buyer paid a farmer for a particular grade, at a particular place, today — shaped by local arrivals, weather, transport availability, storage capacity and regional demand. The two can diverge substantially and for extended periods.
It is published by thousands of separate authorities: state marketing boards, APMC committees, municipal wholesale markets, national agriculture ministries and commodity boards. Formats range from structured government APIs to daily HTML tables to scanned PDF bulletins. Units differ — quintals, maunds, bags, tonnes, boxes — and grade nomenclature is inconsistent even within a single country. Actowiz normalises all of it while retaining every native value, because in commodity work the local unit and grade often matter as much as the converted figure.
Price series are the core, but arrivals and input costs are what make price movements interpretable.
Physical prices at named markets, with grade and variety preserved.
Supply reaching market, the primary short-term price driver.
The cost side, tracked at retail where farmers actually buy.
Cross-border flows from public customs and trade portals.
Official estimates that frame the supply outlook.
Animal protein and dairy markets, structurally different from crops.
Market-level collection with native units retained and no-trade days recorded honestly.
Every engagement delivers a documented schema. These are the core fields; the full dictionary is agreed during scoping.
| Field | Type | What it captures | Refresh |
|---|---|---|---|
market / market_id |
string | Market name and our stable identifier, since names are inconsistently spelled at source | Every run |
state / country |
string | Administrative region and ISO country code for geographic aggregation | Every run |
commodity / variety / grade |
string | Commodity, varietal and quality grade as reported at the market | Every run |
price_min / max / modal |
decimal | Price range and modal price in the market's native unit and currency | Daily |
unit_native / currency |
string | The unit and currency exactly as reported, e.g. INR/quintal | Every run |
price_per_kg_usd |
decimal | Normalised price for cross-market comparison, with FX rate and date attached | Daily |
arrivals_native / tonnes |
decimal | Arrival volume in reported units and converted to metric tonnes | Daily |
arrivals_wow_pct / yoy_pct |
decimal | Change against prior week and same period last year | Daily |
input_price / brand |
decimal / string | Agri-input retail price with brand and formulation where applicable | Weekly |
trade_volume / hs_code |
decimal / string | Export-import volume against the harmonised system code | Monthly |
source / trade_date |
string / date | Originating authority or portal, and the trade date the price applies to | Every run |
Where a market reports no trade on a given day, we deliver an explicit no-trade record rather than omitting the row. Silent gaps in a commodity series are indistinguishable from missing data, and that ambiguity breaks time-series models.
Coverage is deepest where public reporting is mandated, particularly India, and extends across major producing and trading regions.
Where a government portal is unreliable or intermittently offline, we maintain fallback collection from state-level sources and flag which source each record came from. Request a source we don't list →
We deliver into 40+ countries. These are the markets where this particular service is requested most, and the reason demand concentrates there.
| Market | Why demand concentrates here |
|---|---|
| India | 8,000+ mandis publishing daily prices; the deepest physical market data available anywhere. |
| United States & Brazil | Major production and export markets driving global commodity reference pricing. |
| Netherlands & Germany | European wholesale and auction markets for horticulture and dairy. |
| Kenya, Nigeria & South Africa | Growing structured market data for regional agricultural trade. |
We run production collection across 40+ countries. Coverage depth varies by market and by source, so we confirm what is actually available for your specific markets during scoping rather than claiming uniform global coverage. Ask about a market we don't list →
Physical traders and agri-lenders are the heaviest users, since both need local prices rather than benchmarks.
Basis risk against futures is the actual commercial exposure, but assembling reliable physical market prices means analysts pulling government portals by hand each morning.
Daily normalised physical price series across your relevant markets, delivered pre-market with arrivals data so basis moves can be attributed to supply.
Basis capture
Sourcing cost is set at regional markets, and a national average hides the variation that determines whether a procurement window is favourable.
Market-level price and arrivals series across your sourcing geography, with grade detail so comparisons reflect the quality you actually buy.
Landed cost per tonne
Collateral valuation against crop value needs a defensible local price, and an internal estimate cannot survive an audit or a dispute.
Auditable daily market price series with named source, trade date and grade, suitable for collateral valuation and loan-to-value monitoring.
Portfolio LTV accuracy
Retail pricing of your products and competitors' varies widely by dealer and region, and you have no systematic visibility into it.
Weekly agri-input retail pricing by brand, formulation and region, with availability and stock-out signals at dealer level.
Price realisation
Physical market divergence from futures is where the signal is, but no clean panel of physical prices exists to measure it.
Long-run normalised physical price panels with arrivals and production estimates, delivered as modelling-ready time series.
Signal quality
Studying farmer price realisation and market efficiency requires harmonised cross-market data that no single portal provides.
Harmonised multi-country market price and arrivals datasets with units, grades and currencies normalised and every source documented.
Research reproducibility
Four patterns, with measured outcomes.
Physical market prices are delivered pre-market daily alongside arrivals volumes, allowing traders to track basis against the relevant futures contract by location and grade. Because arrivals are included, basis moves can be attributed to local supply rather than treated as unexplained noise.
Outcome: Basis decisions made on same-day physical prices rather than on yesterday's manual portal pull.
Lenders underwriting against stored or standing crop receive auditable daily price series for the relevant commodity, grade and market, with the source authority and trade date attached to every record.
Outcome: Collateral valuation defensible under audit, with loan-to-value monitored against observed local prices.
Procurement teams monitor price and arrivals across their sourcing geography at market level, with grade detail matched to their specification. Arrival surges typically precede local price softening, creating identifiable buying windows.
Outcome: Procurement timed to local supply conditions rather than to a fixed calendar or a national average.
Weekly retail extraction across dealer and e-commerce channels captures your products' and competitors' prices by brand, pack and formulation, plus availability signals indicating where distribution is failing.
Outcome: Channel pricing and distribution gaps visible at regional level rather than inferred from sell-in data.
Clients rarely permit naming. These are real engagement shapes with identifying detail removed, so you can judge whether the work resembles your situation.
An internal feed normalised all mandi prices to per-kilogram, which obscured grade and unit differences and made cross-market comparisons unreliable.
Market-level collection retaining native units, grades and currencies, with conversion factors supplied separately so the team controlled normalisation.
Cross-market comparisons became defensible; native quotes matched what traders actually saw.
Procurement tracked prices but not arrival volumes, so short-term price formation was consistently a surprise.
Daily price and arrivals collection across relevant source markets, with explicit no-trade records rather than carried-forward prices.
Arrivals data gave procurement several days of advance signal on price movement.
Examples are anonymised at client request. Named references are available on request under NDA. See published case studies →
Before you commit to anything, we run this service against your own sources and send you the output. If the coverage isn't there, the sample will show you that too — which is the point. We would rather lose the deal at the pilot than at month three.
Same collection pipeline and QA underneath. The difference is who holds the schedule and how the data reaches you.
We own the collection, the QA and the delivery. You receive clean data on a schedule and never touch a scraper.
Best fit: Teams who need the data, not the infrastructure.
The same collection pipeline exposed as an authenticated REST endpoint your systems query directly.
Best fit: Product and engineering teams building on live data.
A defined pull for a specific question — market sizing, diligence, a pitch, a one-off audit.
Best fit: Research, strategy and diligence work with a deadline.
Every engagement is quoted individually, because the honest answer depends on your scope: how many sources, how many records, how often, and how the data reaches you. We scope it with you, run a free pilot on your own sources, and then quote a fixed monthly figure — no per-request metering and no overage billing when volumes move. Request a quote and you will have a number after one call.
Thousands of market sources with inconsistent naming and units is a maintenance problem, not a build problem.
| Consideration | In-house scraping team | Generic proxy / DIY tool | Actowiz managed feed |
|---|---|---|---|
| Time to first usable data | 6–12 weeks of engineering before anything is trustworthy | Days, but output needs manual cleanup before use | Free pilot in 24 hours, production in 5–10 business days |
| Who fixes it when a source changes | Your engineers, at the cost of their roadmap | You do — tools report failures, they don't resolve them | We do, same business day, inside the retainer |
| Data quality assurance | Whatever your team has time to build | None beyond HTTP success | Schema validation plus sampled human QA on every run |
| Compliance documentation | Rarely produced, then requested urgently by legal | Not provided; terms risk sits with you | Sources, method and lawful basis documented for review |
| Accountability | Distributed across a team with other priorities | A support ticket queue | A named engineer and an account owner |
| True annual cost | Engineer salaries, proxies, hosting, ongoing maintenance | Low licence fee plus significant hidden analyst time | One fixed monthly retainer, quoted after scoping |
Most commodity data buyers start by asking for prices and later discover that prices alone are not interpretable. A 12% move in onion prices at a Maharashtra mandi could reflect a demand shift, a transport disruption, a quality change, or simply that far less product arrived that morning. Without arrivals, you cannot distinguish between them — and the appropriate commercial response differs in each case.
Not every market reports arrivals, and reporting quality varies. We deliver arrivals wherever they are published, in both native and metric units, with week-over-week and year-over-year change computed. Where a market reports price but not volume, we mark arrivals as unreported rather than leaving an ambiguous blank — because for a time-series model those are different facts.
Traders often pair this with news data filtered for weather, logistics and export-policy events, which explains a large share of the moves that price and arrivals data reveal.
Agricultural units are gloriously inconsistent. Indian mandis report in quintals. Parts of South Asia use maunds, whose weight varies regionally. African markets report in bags whose weight varies by commodity and by market. European trade uses tonnes. Fruit markets often report per box or per crate with no standard weight.
Comparing across these requires normalisation. But replacing the native value with a normalised one destroys information, and that is a mistake we see repeatedly in commodity datasets.
Every record carries the native price, native unit, native currency and reported grade exactly as published, plus normalised fields: price per kilogram in USD, with the FX rate and its date attached, and a mapped grade tier with a confidence indicator. Where grade mapping is genuinely uncertain, the mapped field is null and the native grade string stands alone.
This makes files slightly larger and considerably more trustworthy. When a normalised figure looks wrong, your analyst can see the source value and the conversion applied, and decide for themselves — rather than filing a query and waiting.
Market, commodity and grade scope is agreed first, with honest assessment of source reliability per region.
You send us target sites, regions, SKUs or keywords. We return a field-level schema proposal, coverage estimate and refresh recommendation — usually within two working days.
We extract a real sample from your actual targets so you can inspect field fill rates, edge cases and match quality before any commitment.
Our engineers build extractors, then wire validation rules: type checks, range checks, duplicate detection and golden-record comparison against a manually verified subset.
Feeds run at your chosen cadence and land in the warehouse or bucket you already use. Schema changes are versioned and announced before they ship.
We watch coverage drift, fill rates and source changes daily. A named engineer owns your account, and layout breaks are fixed by us — not queued for you.
JSON, JSONL, CSV, Parquet or XLSX, delivered to Amazon S3, Google Cloud Storage, Azure Blob, SFTP, Snowflake, BigQuery, Databricks or a REST/GraphQL endpoint. Webhooks fire on completion, and every batch ships with a manifest containing row counts, schema version and QA results so your pipeline can fail loudly instead of silently ingesting a bad file. Pre-market delivery timing is set to your trading time zone.
We collect from public government portals, marketing board publications and public market bulletins, respecting rate limits and access terms. Agricultural price data published by public authorities is generally open, and we document the source authority and access basis for every series in your feed.
These are contractual, not marketing copy. They appear in the engagement document.
| Commitment | What we hold ourselves to |
|---|---|
| Pilot turnaround | A real sample from your own sources within 24 hours of scoping, at no cost. |
| Go-live | Production collection running within 5–10 business days of sign-off. |
| Delivery punctuality | 99.5% on-schedule delivery, measured monthly and reported to you. |
| Breakage response | Source layout changes triaged same business day; critical sources inside 4 hours. |
| Data quality | Schema validation on every run plus sampled human QA before any delivery leaves us. |
| Escalation | A named engineer and an account owner, not a shared ticket queue. |
| Change requests | Field additions and source changes handled inside the retainer, not re-quoted. |
| Exit | Your historical data exported in full on request. No lock-in, no export fee. |
Plain definitions of the terms used on this page, so procurement and legal reviewers are working from the same vocabulary as your data team.
What buyers ask during evaluation.
Fundamentally different. Futures reflect a standardised contract at a standardised delivery point for a forward month, aggregating global financial positioning. Our data reflects what physical product of a specific grade actually fetched at a named market on a specific date.
The two diverge, sometimes substantially and for long periods, because physical prices respond to local arrivals, transport, storage and regional demand. If your exposure is physical — buying, processing, or lending against actual crop — the physical series is what you need. If you need both, we deliver physical alongside your existing exchange feed for basis calculation.
Variable, and this is the main operational challenge in this category. Some portals are well maintained with consistent daily publication; others go offline for days, publish late, or restate figures without notice.
We handle it three ways: fallback collection from state-level or alternative sources where the primary portal fails; a source-attribution field on every record so you always know where a figure came from; and restatement detection, which flags when a previously published figure changes. Silent restatements corrupt time-series analysis, and catching them is one of the more valuable things we do here.
India is our deepest coverage, drawing on Agmarknet, e-NAM and state marketing board sources across thousands of APMC mandis. Coverage completeness follows source publication: some mandis report daily and comprehensively, others intermittently, and a few not at all.
During scoping we give you a market-by-market assessment for your commodities of interest, including typical reporting frequency and historical gap rates. That matters more than a headline market count, because a mandi that reports twice a month is not usable for daily basis work.
We deliver an explicit no-trade record with a reason where one is given — holiday, closure, no arrivals. This is deliberate and it matters more than it might appear.
If a row is simply absent, your pipeline cannot distinguish 'the market did not trade' from 'our collection failed' from 'the portal was down'. Those are three different facts with three different implications for a model. Explicit no-trade records remove that ambiguity, and any commodity dataset that omits them should be treated with suspicion.
Yes, with varying depth. Where government portals maintain public archives — India's Agmarknet among them — we can backfill multiple years. Our own collection archive adds depth for markets we already cover. Some markets have no accessible history at all.
We provide exact date ranges and gap profiles per market during scoping. This matters more here than in most categories, because agricultural analysis is inherently seasonal: a series with an unacknowledged gap covering one monsoon produces conclusions that look robust and aren't.
Yes. Fertiliser, seed and crop protection retail pricing is extracted from dealer sites, agri e-commerce platforms and government price monitoring portals, with brand, formulation and pack size captured, plus availability and stock-out signals.
Input pricing refreshes weekly rather than daily, which matches how it moves. It is bought both by input brands monitoring their own price realisation across channels, and by lenders and researchers modelling farm-level margin, where input cost is half the equation.
Yes, where the source publishes in time. Delivery timing is configured to your trading time zone, and for Indian mandi data we typically deliver in the early morning window after overnight portal publication.
The constraint is source publication, not our processing. Where a portal publishes at 11am local, we cannot deliver it at 6am. During scoping we tell you the realistic delivery window per source so your morning process is built around what is actually achievable.
We retain the reported grade and variety strings exactly as published, and additionally supply a mapped grade tier with a confidence indicator where a defensible mapping exists.
Where it doesn't, we leave the mapped field null rather than forcing it. Indian mandi grades like FAQ are not equivalent to European milling specifications, and pretending otherwise creates false comparability — which in commodity work leads to real trading losses, not just bad charts.
We quote every commodity data engagement individually, because a real number depends on scope: source count, record volume, refresh frequency and delivery method. Anyone quoting you a price before understanding those four things is guessing.
Market count and refresh frequency drive cost. Daily coverage across thousands of markets sits well above a focused commodity set.
The process is short: one scoping call, a free pilot on your own sources within 24 hours, then a fixed monthly quote. No per-request metering, no overage billing, and field or source additions are handled inside the retainer rather than re-quoted. Request a quote.
Tell us the commodities and markets you follow. We return market-level pricing with native units and arrivals within 24 hours, at no cost.
Free pilot, no obligation, no card. You'll have a fixed monthly quote after one scoping call.Our web scraping expertise is relied on by 4,000+ global enterprises including Zomato, Tata Consumer, Subway, and Expedia — helping them turn web data into growth.
Watch how businesses like yours are using Actowiz data to drive growth.
 4.8/5 Average Rating
 50+ Video Testimonials
 92% Client Retention
 50+ Countries Served
From Zomato to Expedia — see why global leaders trust us with their data.
Backed by automation, data volume, and enterprise-grade scale — we help businesses from startups to Fortune 500s extract competitive insights across the USA, UK, UAE, and beyond.


 Product Matching
 Attribute Tagging
 Content Optimization
 Sentiment Analysis
 Prompt-Based Reporting
We partner with agencies, system integrators, and technology platforms to deliver end-to-end solutions across the retail and digital shelf ecosystem.


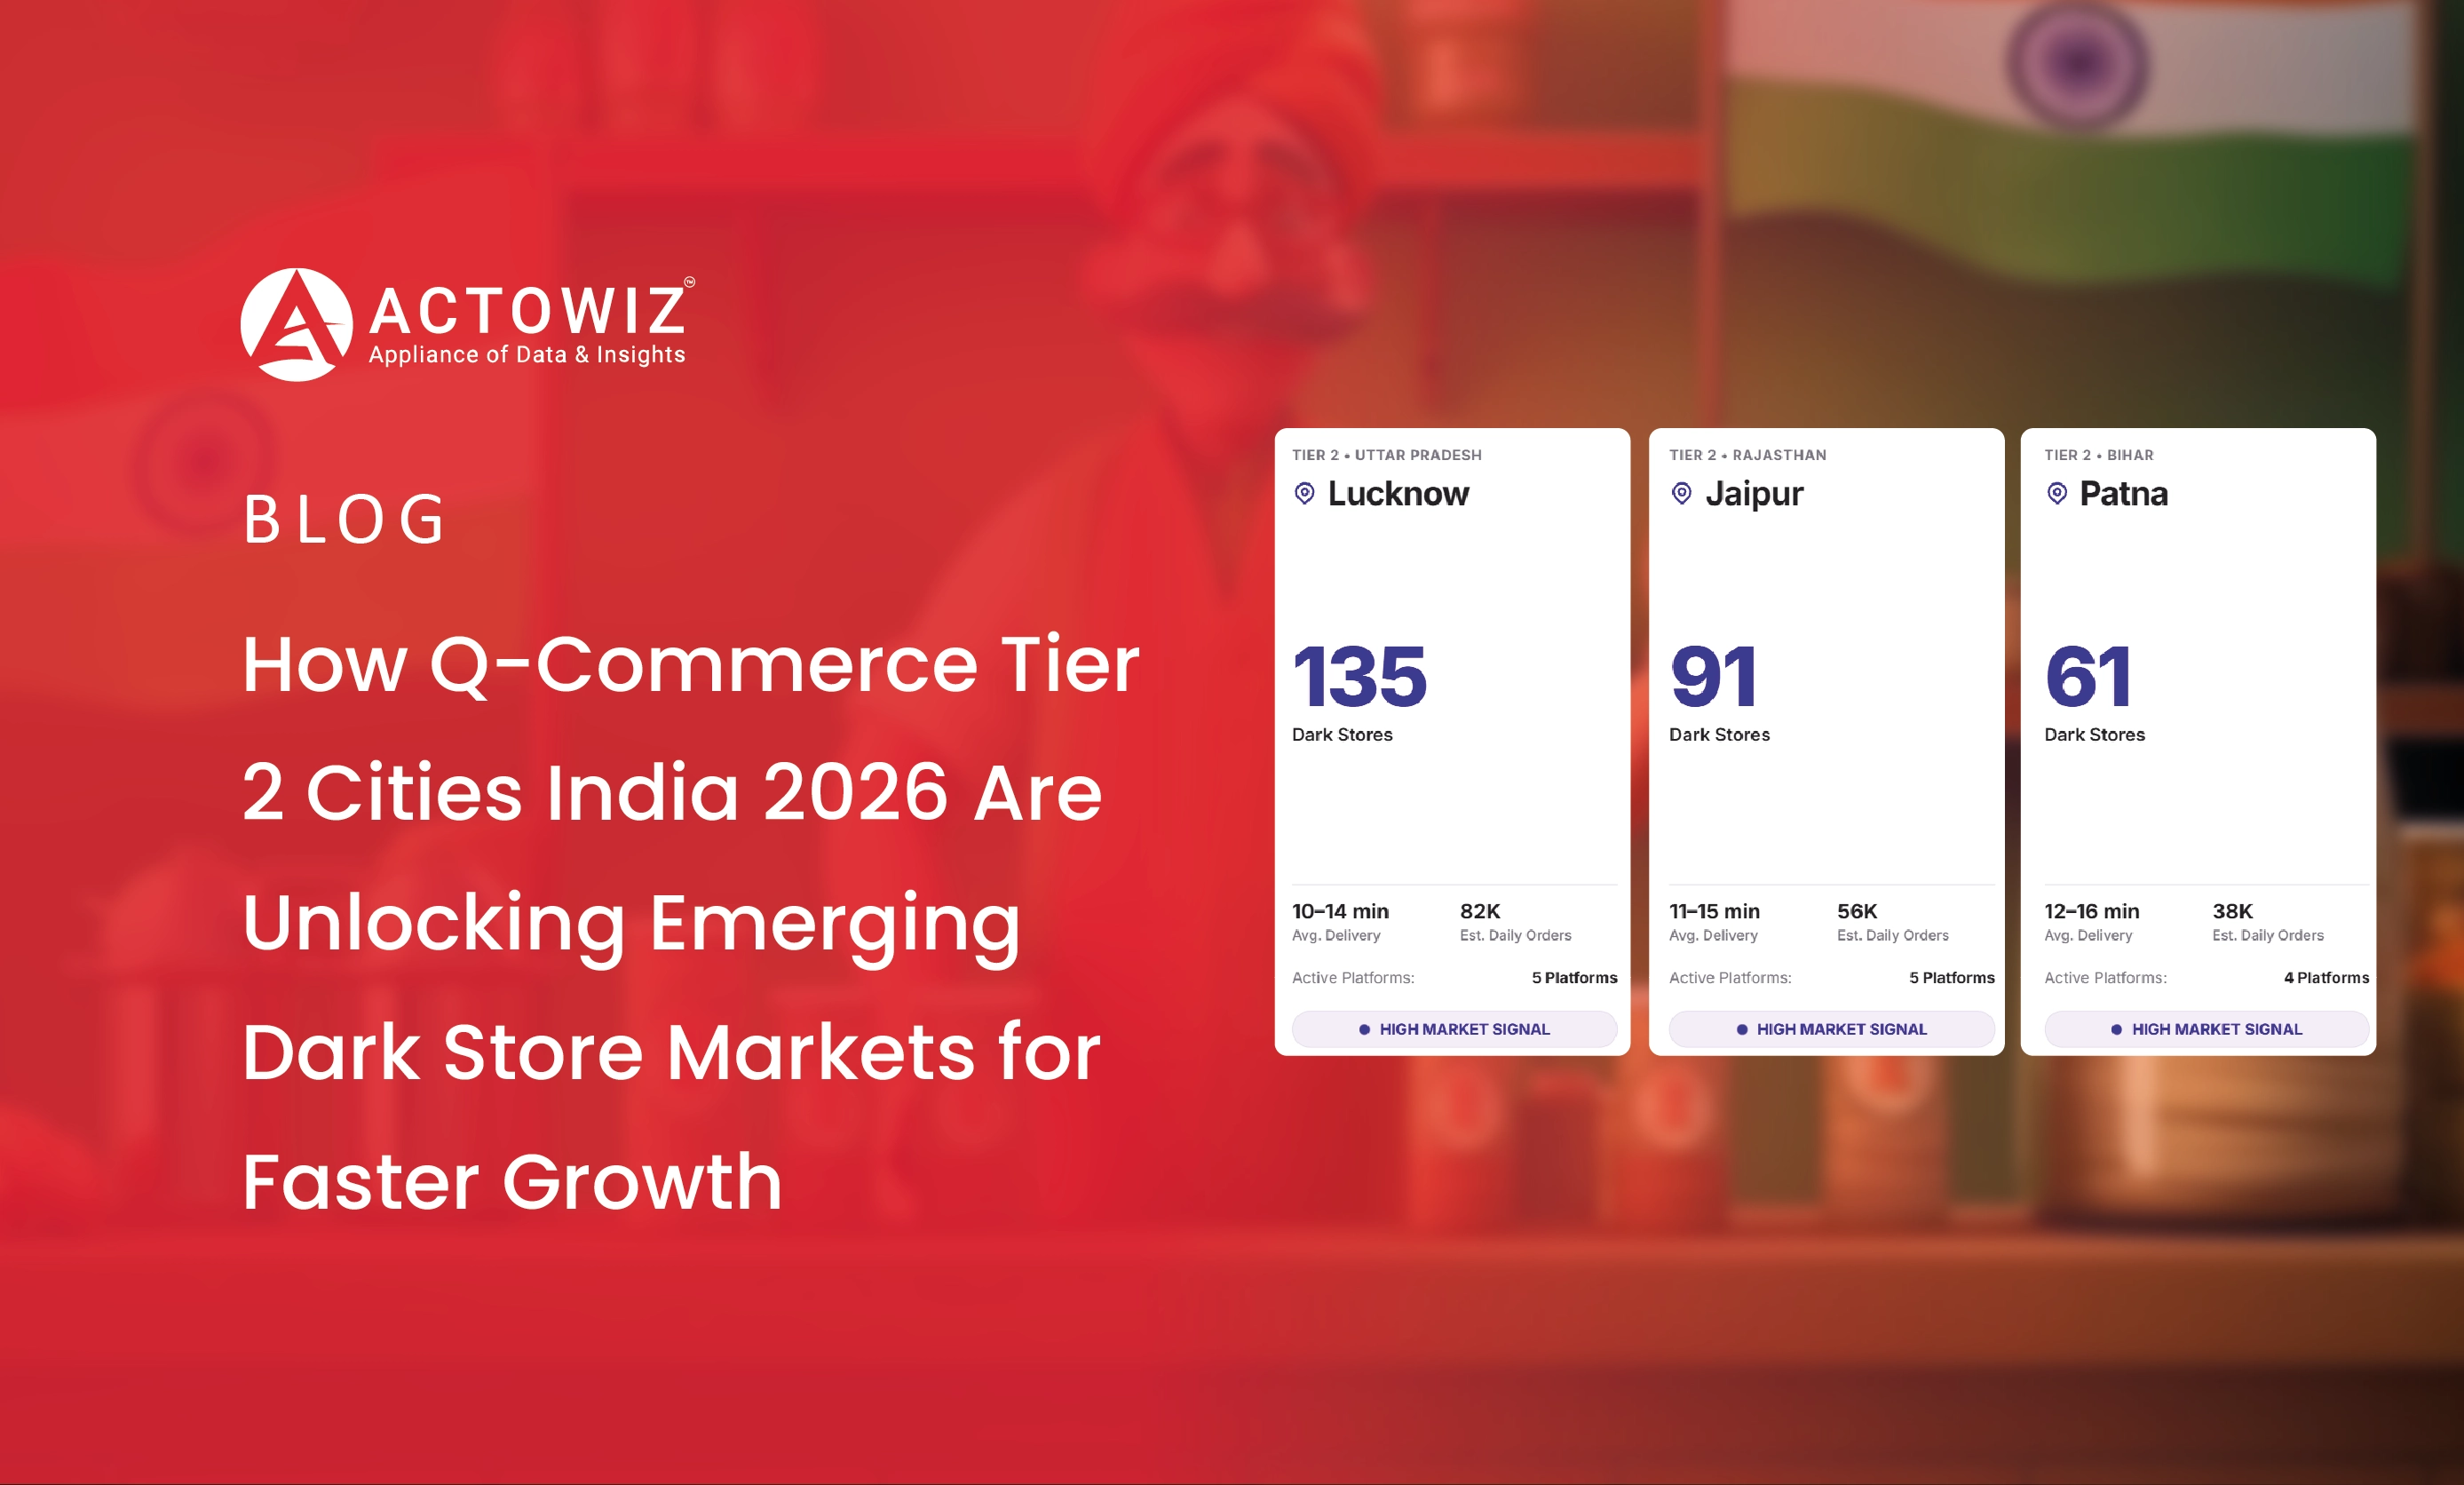
Explore Q-Commerce Tier 2 Cities India 2026, uncovering emerging dark store markets, consumer demand, delivery trends, and expansion opportunities.

Discover Wine Data Collection from Tabelog to analyze wine listings, prices, ratings, restaurant trends, menus, and competitive market insights.

Discover how E-Com & Q-Com Review Intelligence Report 2026 helps brands analyze reviews, sentiment, product issues, and customer trends across major platforms.
Whether you're a startup or a Fortune 500 — we have the right plan for your data needs.











































