Pricing & markdown
Full price, current price and the markdown journey.
- Full price and current price
- Markdown depth and event count with dates
- Promotional versus permanent markdown
- Price by colour within a style
- First markdown timing from launch

Scalable web, app and AI-powered collection across 40+ countries.
All services → By industry
Repricing driven by competitor moves rather than a weekly review.
Explore → Pricing & Promotions
 Brand & Intelligence
 Digital Shelf & Search
 Assortment
 For Retailers
Which solution fits?
Talk to ExpertTalabat, Careem Quik and Noon Minutes across 18 GCC cities.
Launch Demo →Tesco, Sainsbury's, Asda, Morrisons and Aldi, daily.
Get Early Access → By Industry
 E-Commerce Dashboard
 Flipkart Insights (Live) #1
 Grocery Intelligence
.svg) Grocery Price (U.S.)
Grocery Price (U.S.)
.svg) Quick Commerce (India) HOT
Quick Commerce (India) HOT
 Food & Restaurant
 Fashion Intelligence
 Automotive
 Travel & Hospitality
 Real Estate
 Food Delivery Intelligence NEW
 OTT & Streaming NEW
 Fuel & EV Charging Price Tracker NEW
 By Use Case
 Pricing Intelligence
 Digital Shelf Analytics
 MAP Monitoring HOT
 Cross-Border Price Parity NEW
 Share of Search
 Review Sentiment
 Kitchen Market Gaps NEW
 Dynamic Pricing / AI Repricing NEW
 Promotions & Deals Alerts NEW
 B2B / POI & Lead Data NEW
 AI Search Visibility Dashboard NEW
 Baby Products on Quick Commerce NEW
 Hotel & Flight Rate Parity NEW
 By Region
 Flipkart Real-Time Insights
 Quick Commerce — Zepto · Blinkit
 Pincode Price Tracker
 GCC Q-Commerce — Talabat · Noon NEW
 UK Grocery — Tesco, Sainsbury's, Asda
 AU Grocery — Coles & Woolworths NEW
Sources we already run pipelines against. Download a real sample from any of them.
Browse coverage → Marketplace Scrapers
 Developer APIs
 Universal APIs
 Delivery & SDKs
Fixed monthly retainer, named engineer, no per-request metering.
Managed Data API → Knowledge Center
 Guides & Playbooks
 Downloads & Tools
 Trust & Company
Scalable web, app and AI-powered collection across 40+ countries.
All 58 services → By industryRepricing driven by competitor moves rather than a weekly review.
Explore → Pricing & Promotions
Brand & Intelligence
Digital Shelf & Search
Assortment For RetailersWhich solution fits?
Talk to ExpertSources we already run pipelines against. Download a real sample from any of them.
Browse coverage →Talabat, Careem Quik and Noon Minutes across 18 GCC cities.
Launch Demo →Tesco, Sainsbury's, Asda, Morrisons and Aldi, daily.
Get Early Access → By Industry
E-Commerce Dashboard
Flipkart Insights (Live) #1
Grocery Intelligence
Grocery Price (U.S.)
Quick Commerce (India) HOT
Food & Restaurant
Fashion Intelligence
Automotive
Travel & Hospitality
Real Estate
Food Delivery Intelligence NEW
OTT & Streaming NEW
Fuel & EV Charging Price Tracker NEW
By Use Case
Pricing Intelligence
Digital Shelf Analytics
MAP Monitoring HOT
Cross-Border Price Parity NEW
Share of Search
Review Sentiment
Kitchen Market Gaps NEW
Dynamic Pricing / AI Repricing NEW
Promotions & Deals Alerts NEW
B2B / POI & Lead Data NEW
AI Search Visibility Dashboard NEW
Baby Products on Quick Commerce NEW
Hotel & Flight Rate Parity NEW
By Region Flipkart Real-Time Insights
Quick Commerce — Zepto · Blinkit
Pincode Price Tracker
GCC Q-Commerce — Talabat · Noon NEW
UK Grocery — Tesco, Sainsbury's, Asda
AU Grocery — Coles & Woolworths NEW
Marketplace Scrapers
Developer APIs Universal APIs Delivery & SDKsFixed monthly retainer, named engineer, no per-request metering.
Managed Data API → Knowledge Center
Guides & Playbooks
Downloads & Tools
Trust & CompanyAt style-colour-size level, because that is where sell-through actually shows.
A dress at full price with only size 16 left is not selling well. It has sold out of everything that mattered. Style-level data reports it as in stock at full price, which is the opposite of the truth.
Free pilot on your own sources, returned in 48 hours. No card, no trial clock — and you keep the sample data either way.
Last verified 5 August 2026 by the Actowiz Solutions Data Engineering team.
Fashion and apparel data scraping is the automated collection of clothing and footwear retail data: pricing and markdown state, size and colour availability, assortment composition, newness, category placement and style lifecycle.
Fashion differs from general retail in one structural way that determines whether the data is useful: the unit that sells is a size, not a style. Almost every fashion dataset collects at style level and therefore describes a market that does not exist.
Every record is a style-colour combination carrying a full size curve: per-size availability, count available versus total, plus derived flags. size_curve_broken indicates gaps in the middle of the run. core_sizes_oos indicates the high-volume sizes are gone, which is the single strongest public sell-through signal in fashion.
Size systems are normalised across UK, US, EU and alpha sizing, and footwear separately, so cross-retailer comparison works. Where a retailer publishes no size-level availability, we say so rather than reporting style-level stock as if it were size-level.
Units sold, inventory depth per size, and margin. A size disappearing means it stopped being purchasable, which is a strong proxy for sell-through but not a unit count. We report availability transitions, not sales.
Markdown and size availability are the largest use cases. Assortment analysis is what buying teams build on.
Full price, current price and the markdown journey.
The layer that makes fashion data meaningful.
Where buying decisions actually sit.
Range composition over time.
How long things last and how fast they clear.
The detail that drives search and filtering.
A managed engagement, not a tool licence. We own the pipeline and everything that breaks in it.
Every engagement delivers a documented schema. These are the core fields; the full dictionary runs to 140+ and is agreed during scoping.
| Field | Type | What it captures | Refresh |
|---|---|---|---|
style_key / colour |
string | Style identity with colour, since colour is a distinct commercial unit | Every run |
brand / retailer / category_path |
string / array | Brand, retailer and full category breadcrumb as published | Weekly |
full_price / current_price |
decimal | Original price and current selling price in local currency | Daily |
markdown_pct / markdown_events |
decimal / int | Current markdown depth and how many markdown steps have occurred | Daily |
size_curve |
array | Per-size availability, which is the field that makes sell-through visible | Daily |
sizes_available / sizes_total |
int | Count of purchasable sizes against total sizes offered | Daily |
size_curve_broken / core_sizes_oos |
boolean | Derived flags for gaps in the run and high-volume size stockouts | Daily |
first_seen / weeks_on_site |
date / int | Launch observation and elapsed weeks, for lifecycle analysis | Daily |
is_newness |
boolean | Whether the retailer currently classifies the style as new in | Daily |
composition / attributes |
string / object | Fabric composition and fit attributes where published | Weekly |
delisted_at |
date | When a style disappeared, distinguishing sell-out from withdrawal where possible | Daily |
core_sizes_oos is derived per category using the high-volume size band for that market, not a fixed global assumption. Core sizes in UK womenswear differ from US menswear, and applying one definition everywhere produces a misleading flag.
Fashion retail is fragmented and national. Coverage is built to your competitive set rather than from a fixed list.
Some retailers publish size availability only in an add-to-basket flow rather than on the product page. We collect it where it is publicly exposed and state per retailer where size-level data is unavailable rather than substituting style-level stock. Request a source we don't list →
We deliver into 40+ countries. These are the markets where this particular service is requested most, and the reason demand concentrates there.
| Market | Why demand concentrates here |
|---|---|
| United Kingdom | Dense online fashion retail with widespread public size availability, which makes size curve analysis unusually complete. |
| Germany & Netherlands | Large pure-play fashion platforms with deep assortments and heavy markdown activity across seasons. |
| United States | Enormous retailer base with frequent promotional cycles, though size availability exposure varies more by retailer. |
| India & GCC | Fast-growing online fashion with aggressive discounting and rapid assortment turnover. |
We run production collection across 40+ countries. Coverage depth varies by market and by source, so we confirm what is actually available for your specific markets during scoping rather than claiming uniform global coverage. Ask about a market we don't list →
Buying and merchandising teams dominate, with brand wholesale and investors close behind.
Range and markdown decisions need to know what is genuinely selling at competitors, which style-level stock data cannot show.
Style-colour-size availability with size curve analysis, markdown cadence and weeks-on-site across your competitive set.
Full price sell-through %
Markdown timing decisions are made against competitor markdown depth without knowing whether their stock is genuinely slow.
Markdown event history with size curve state at each step, distinguishing genuine slow sellers from tail clearance.
Markdown margin
You cannot see how retail partners are pricing, sizing and marking down your product across accounts.
Per-retailer pricing, markdown state and size availability for your styles, revealing where partners discount early.
Full price realisation
Trend adoption and colour performance across the market is assessed from imagery rather than data.
Assortment composition by category, colour, price band and newness share, tracked over time across retailers.
Newness sell-through
Resale pricing needs primary market pricing and availability context to value inventory properly.
Primary retail pricing, markdown state and availability for the same styles appearing on resale, joined on style identity.
Sell-through on resale
Fashion retail theses need observable markdown intensity and assortment data ahead of reported margin.
Longitudinal markdown intensity, assortment breadth and newness cadence panels by retailer and category.
Signal lead time
Four patterns, with the outcome each is judged on.
Per-size availability is tracked over time, so styles losing core sizes while remaining at full price are identified as strong sellers, and styles retaining a full curve into markdown are identified as genuine slow movers.
Outcome: Competitive read on what is actually selling rather than on what is merely in stock.
Markdown events are counted with dates and joined to size curve state at each step, revealing how quickly competitors discount and whether they discount slow stock or clear tails.
Outcome: Markdown strategy set against observed competitor cadence rather than against depth alone.
Range breadth, price band distribution, colour mix and newness share are tracked by category over time, showing where competitors are expanding or retreating.
Outcome: Range planning informed by observed competitor assortment shifts ahead of season.
Brand styles are tracked across retail partners with markdown state and timing, exposing accounts that discount earlier or deeper than agreed.
Outcome: Channel conversations grounded in per-account markdown evidence.
Clients rarely permit naming. These are real engagement shapes with identifying detail removed, so you can judge whether the work resembles your situation.
Merchandising compared competitor markdown depth at style level, unable to tell whether a discounted style was a genuine slow seller or a tail being cleared.
Style-colour-size collection with full size curves at each markdown step, plus broken curve and core-size stockout flags.
Markdown benchmarking began distinguishing slow sellers from tail clearance, changing timing on several categories.
The brand had no systematic view of how retail partners priced and marked down its styles across accounts and markets.
Per-retailer tracking of brand styles with markdown timing, depth and size curve state, refreshed daily across accounts.
Early-discounting accounts were identified with dated evidence for channel conversations.
Examples are anonymised at client request. Named references are available on request under NDA. See published case studies →
Before you commit to anything, we run this service against your own sources and send you the output. If the coverage isn't there, the sample will show you that too — which is the point. We would rather lose the deal at the pilot than at month three.
Same collection pipeline and QA underneath. The difference is who holds the schedule and how the data reaches you.
We own the collection, the QA and the delivery. You receive clean data on a schedule and never touch a scraper.
Best fit: Teams who need the data, not the infrastructure.
The same collection pipeline exposed as an authenticated REST endpoint your systems query directly.
Best fit: Product and engineering teams building on live data.
A defined pull for a specific question — market sizing, diligence, a pitch, a one-off audit.
Best fit: Research, strategy and diligence work with a deadline.
Every engagement is quoted individually, because the honest answer depends on your scope: how many sources, how many records, how often, and how the data reaches you. We scope it with you, run a free pilot on your own sources, and then quote a fixed monthly figure — no per-request metering and no overage billing when volumes move. Request a quote and you will have a number after one call.
Size curve capture and size system normalisation are the parts in-house builds almost always skip.
| Consideration | In-house scraping team | Generic proxy / DIY tool | Actowiz managed feed |
|---|---|---|---|
| Time to first usable data | 6–12 weeks of engineering before anything is trustworthy | Days, but output needs manual cleanup before use | Free pilot in 48 hours, production in 5–10 business days |
| Who fixes it when a source changes | Your engineers, at the cost of their roadmap | You do — tools report failures, they don't resolve them | We do, same business day, inside the retainer |
| Data quality assurance | Whatever your team has time to build | None beyond HTTP success | Schema validation plus sampled human QA on every run |
| Compliance documentation | Rarely produced, then requested urgently by legal | Not provided; terms risk sits with you | Sources, method and lawful basis documented for review |
| Accountability | Distributed across a team with other priorities | A support ticket queue | A named engineer and an account owner |
| True annual cost | Engineer salaries, proxies, hosting, ongoing maintenance | Low licence fee plus significant hidden analyst time | One fixed monthly retainer, quoted after scoping |
Retail data buyers are trained to look at price and stock. In fashion, the more informative signal is the shape of what remains, and it is almost never collected.
Sizes coming back into stock after disappearing is the closest thing to observing a reorder decision from outside the business. It tells you the retailer's buying team believes in the style enough to commit again, which is a stronger signal than any amount of price data.
We detect it because we hold size-level history rather than snapshots. This is only possible with continuous collection — a monthly sample cannot distinguish replenishment from a size that never went out.
For teams tracking the same styles in resale or across marketplaces, this joins to our ecommerce service on style identity.
Comparing size availability across retailers requires that sizes mean the same thing. In fashion they frequently do not, and naive handling produces comparisons that quietly break.
Sizes are captured exactly as published, then mapped to a normalised scale per category and market with the original retained. Where alpha-to-numeric mapping is ambiguous, we keep both and flag the ambiguity rather than committing to a conversion that may be wrong for that brand.
Extended, petite and tall ranges are treated as separate size runs, so a broken curve in the main run is not masked by availability in an extended run. Our parse rate is 98.2% and the residual clusters in one-size items, adjustable products and retailers with inconsistent size labelling — which we report rather than silently forcing into the scale.
Retailers, categories and whether size-level availability is publicly exposed are confirmed per retailer before build.
You send us target sites, regions, SKUs or keywords. We return a field-level schema proposal, coverage estimate and refresh recommendation — usually within two working days.
We extract a real sample from your actual targets so you can inspect field fill rates, edge cases and match quality before any commitment.
Our engineers build extractors, then wire validation rules: type checks, range checks, duplicate detection and golden-record comparison against a manually verified subset.
Feeds run at your chosen cadence and land in the warehouse or bucket you already use. Schema changes are versioned and announced before they ship.
We watch coverage drift, fill rates and source changes daily. A named engineer owns your account, and layout breaks are fixed by us — not queued for you.
JSON, JSONL, CSV, Parquet or XLSX, delivered to Amazon S3, Google Cloud Storage, Azure Blob, SFTP, Snowflake, BigQuery, Databricks or a REST/GraphQL endpoint. Webhooks fire on completion, and every batch ships with a manifest containing row counts, schema version and QA results so your pipeline can fail loudly instead of silently ingesting a bad file.
We collect publicly accessible product, category and search pages. Size availability is collected only where publicly exposed, without adding items to baskets, creating accounts or initiating orders. Customer and reviewer personal data is not part of the deliverable.
These are contractual, not marketing copy. They appear in the engagement document.
| Commitment | What we hold ourselves to |
|---|---|
| Pilot turnaround | A real sample from your own sources within 48 hours of scoping, at no cost. |
| Go-live | Production collection running within 5–10 business days of sign-off. |
| Delivery punctuality | 99.5% on-schedule delivery, measured monthly and reported to you. |
| Breakage response | Source layout changes triaged same business day; critical sources inside 4 hours. |
| Data quality | Schema validation on every run plus sampled human QA before any delivery leaves us. |
| Escalation | A named engineer and an account owner, not a shared ticket queue. |
| Change requests | Field additions and source changes handled inside the retainer, not re-quoted. |
| Exit | Your historical data exported in full on request. No lock-in, no export fee. |
Plain definitions of the terms used on this page, so procurement and legal reviewers are working from the same vocabulary as your data team.
What buying, merchandising and brand teams ask during evaluation.
Because the unit that sells is a size. A style with only size 16 remaining at full price reads as in stock and not discounted, when in fact it has sold out of every core size — the opposite conclusion.
Style-level data also makes markdown analysis misleading: marking down a style with a full size curve is discounting a genuine slow seller, while marking down one with a broken curve is clearing a tail. Same markdown depth, opposite meaning, and only size-level data distinguishes them.
Not units, but a strong proxy. We track per-size availability over time, so core sizes disappearing while price stays full is a reliable indicator of sell-through, and sizes returning to stock indicates a repeat order — which is the closest you can get to observing a buying decision from outside.
What we cannot see is unit volume, inventory depth or margin. We report availability transitions rather than sales, and we would rather be explicit about that than let a proxy be mistaken for a measurement.
Sizes are captured exactly as published, then mapped to a normalised scale per category and market with the original retained. Footwear is handled on its own scales, and extended, petite and tall ranges are treated as separate size runs.
Where alpha-to-numeric mapping is ambiguous — and it usually is, since a retailer's M is not a fixed numeric size — we keep both and flag the ambiguity rather than committing to a conversion that may be wrong for that brand.
Then we say so per retailer rather than substituting style-level stock. Some retailers expose size availability only inside an add-to-basket flow, and we do not add items to baskets or create accounts to reach it.
During scoping we tell you which retailers in your competitive set expose size-level data publicly and which do not, so you know the coverage before committing rather than discovering gaps in month two.
Yes, provided we were collecting when the style launched. We record first-seen, weeks on site, each markdown event with its date, and the size curve state at each step.
The honest constraint: for styles that launched before our collection began, first-seen is when we first observed it, not the true launch date. We report the archive start so you know what weeks-on-site is actually measuring rather than assuming it covers full lifecycle.
As published, yes — material composition, recycled content claims, certification mentions and any sustainability labelling the retailer displays. We capture the claim as made, with the wording retained.
We do not verify claims, and we are careful not to present captured claims as validated. For teams doing substantiation work, the published claim plus its wording and date is the evidential starting point, not the conclusion.
Yes, and joining them is increasingly requested. Resale listings are collected with condition and pricing, and joined to primary retail styles where identity can be established.
Matching is harder on resale because listings are user-written with inconsistent brand and style naming. We attach match confidence and flag uncertain links rather than asserting that a resale listing is definitely the same style as a primary retail record.
Daily as standard, because size availability changes daily and the signal degrades quickly if missed. Sub-daily is worth it during sale periods and around drop launches, where availability can change within hours.
Weekly collection is largely pointless for size curve work: you will see a style went from full curve to broken without seeing the sequence, which is where the information is.
We quote individually. The drivers are retailer count, category scope, and critically whether size-level collection is required — size curves multiply record volume by the number of sizes per style, which is typically six to twelve times style-level volume.
A defined category across several retailers at daily size-level refresh sits in the middle. Full-catalogue coverage across many retailers with sub-daily sale-period collection sits higher. One scoping call, a free pilot on your own competitive set within 48 hours, then a fixed monthly quote. Request a quote.
Send us retailers and a category. We return style-colour-size records with size curves, markdown history and core-size flags within 48 hours.
Free pilot, no card, no obligation. We'll confirm which retailers expose size availability publicly.Our web scraping expertise is relied on by 4,000+ global enterprises including Zomato, Tata Consumer, Subway, and Expedia — helping them turn web data into growth.
Watch how businesses like yours are using Actowiz data to drive growth.
 4.8/5 Average Rating
 50+ Video Testimonials
 92% Client Retention
 50+ Countries Served
From Zomato to Expedia — see why global leaders trust us with their data.
Backed by automation, data volume, and enterprise-grade scale — we help businesses from startups to Fortune 500s extract competitive insights across the USA, UK, UAE, and beyond.


 Product Matching
 Attribute Tagging
 Content Optimization
 Sentiment Analysis
 Prompt-Based Reporting
We partner with agencies, system integrators, and technology platforms to deliver end-to-end solutions across the retail and digital shelf ecosystem.


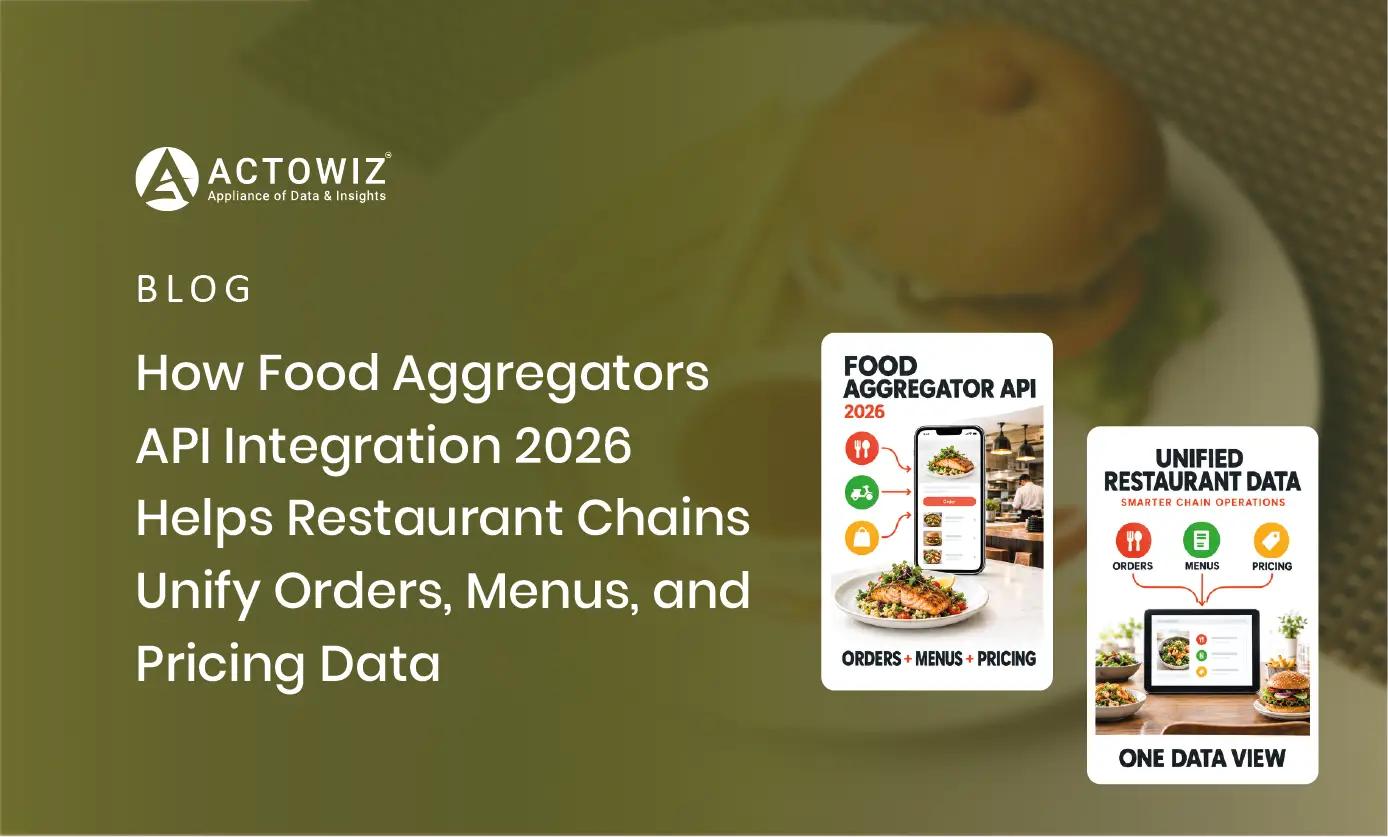
Food Aggregators API Integration 2026 helps restaurant chains unify menus, orders, pricing, availability, and performance data across platforms.
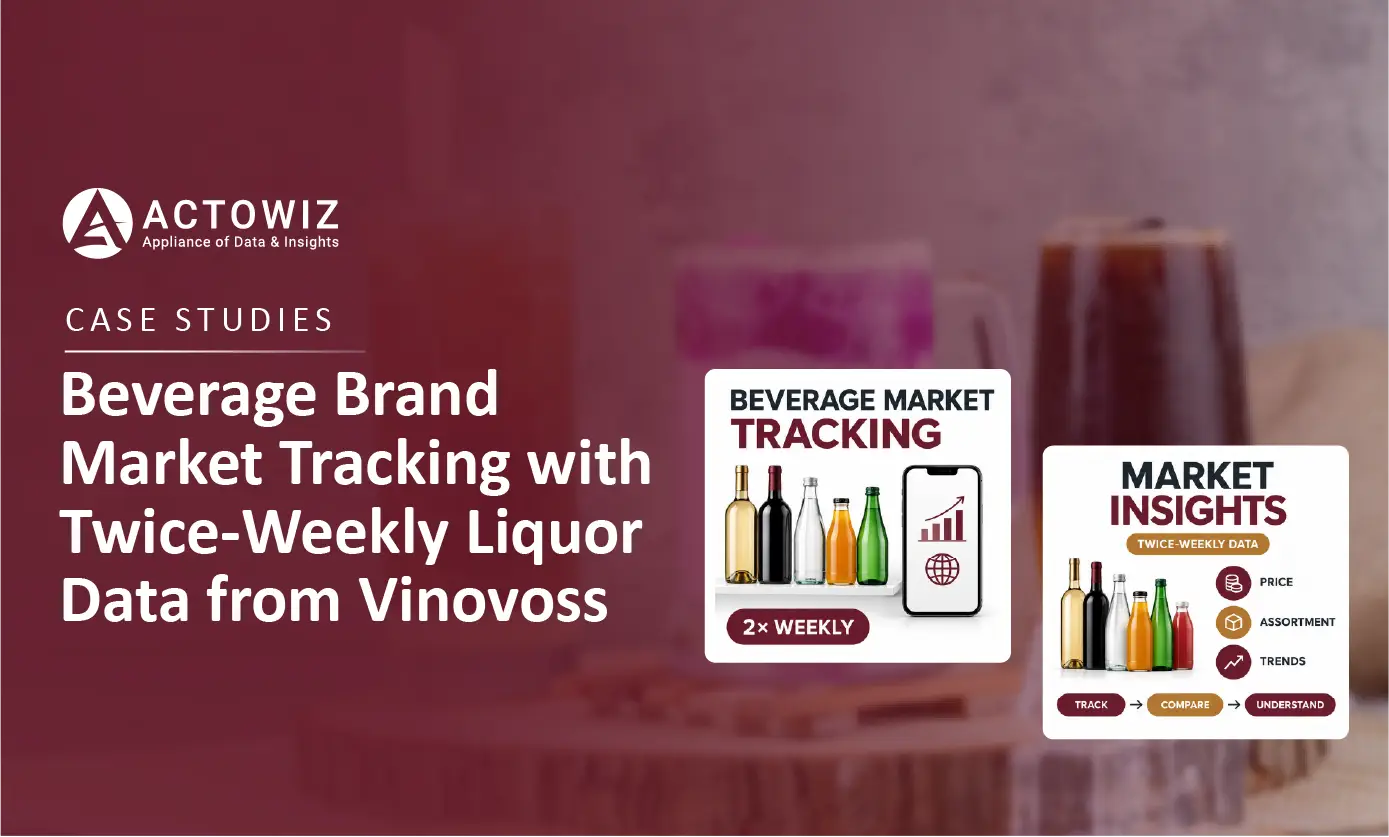
Track liquor prices, products, availability, and market changes with Twice-Weekly Liquor Data Collection from Vinovoss for timely insights.
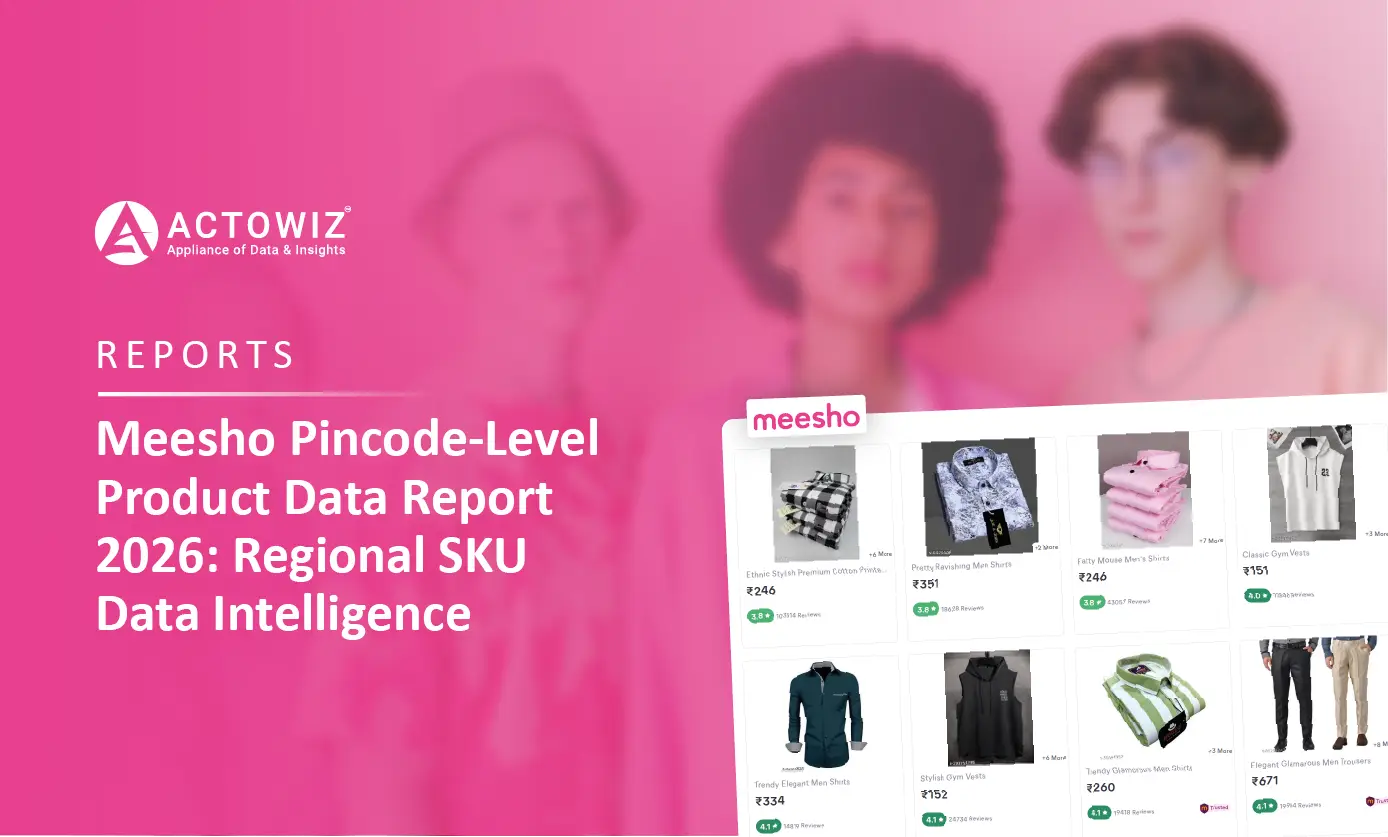
Explore Meesho Pincode-Level Product Data Report 2026 covering local pricing, product availability, SKU trends, and regional e-commerce intelligence.
Whether you're a startup or a Fortune 500 — we have the right plan for your data needs.











































