Core services
Enterprise Data Extraction

Scalable web, app and AI-powered collection across 40+ countries.

All 58 services →
New 2026
AI Training Data

Corpus building with provenance and opt-out compliance.

Learn more →
Free pilot
24-hour sample

We run collection on your own sources before you commit.

Get a sample →
58Services
40+Countries
DEVELOPER

Ready-Made Scrapers

Pre-built for top platforms. Self-serve, no setup.

View All →
TRY FREE

API Playground

Test endpoints instantly. No credit card.

Start Free →
28Tools
2SDKs
icons Delivery & SDKs
Streaming Crawl API Scheduler Realtime Alerts Webhook Delivery 🐍 Python SDK 💚 Node.js SDK
Need it managed instead?

Fixed monthly retainer, named engineer, no per-request metering.

Managed Data API →
HOT

Case Studies

How brands use Actowiz, with named outcomes.

Read →
FREE

Sample Datasets

Real output, no signup.

Download →
NEW

ROI Calculator

Model the return on a data engagement.

Calculate →
Platform · SSENSE

SSENSE Data Scraping

Went through court-supervised restructuring in Canada in 2025. When a retailer's brand relationships are in motion, the brand roster is the series.

SSENSE data scraping collects designer product listings, prices, availability and range. Context that shapes the analysis: the retailer went through court-supervised creditor protection in Canada in 2025, with the founding family retaining ownership in early 2026. For any retailer in that position, which brands are carried, and how deeply, is the series that shows what is actually changing — and it is a series only if brand exits are recorded rather than dropped.

Price series on a designer site are mostly flat until markdown season. The brand roster moves all year, and it moves most when the retailer does.

Free pilot on your own SSENSE list, returned in 24 hours. No card, no trial clock — and you keep the sample data either way.

ssense.jsonl LIVE FEED
{"retailer":"ssense","market_observed_from":"CA", "brand_name":"designer-a","sku_count_brand":412, "brand_first_seen":"2024-02-11","price":890.00, "currency_displayed":"CAD"} {"brand_name":"designer-b","sku_count_brand":38, "sku_count_brand_prior":361, "note":"still carried, 90% shallower. a current-brands list shows nothing changed"} {"brand_name":"designer-c","brand_last_seen":"2026-07-30", "exit_reason":"not_determined"}
3 of 684,220 product rows · globalthe roster is the series · exits never deleted · schema v1.0

Independence and trademarks. Actowiz Solutions is not affiliated with, endorsed by or connected to SSENSE or its owners. SSENSE and related marks belong to their respective owners, used here only to name the publicly accessible source this service collects from.

Our Data Powers
B2C Marketplace
amazon
D2C + Marketplace
NYKAA
D2C + Marketplace
Walmart
FMCG Marketplace
udaan
Food Delivery
Uber Eats
Quick Commerce
blinkit
Taxi Aggregator
Uber
E-Commerce
Tmall
SSENSE at a glance

How we handle SSENSE specifically

Platform-specific handling, not a generic retail template pointed at a different domain.

Retailer
SSENSE — Montreal-based, ships globally
Recent history
Canadian creditor protection in 2025
Outcome
Founding family retained ownership in early 2026
So the series is
The brand roster, not only price
Measured as
Brand first-seen, last-seen and SKU depth per brand
Prices
Shown in the visitor's currency. Market recorded
We do not
Characterise the restructuring beyond public reporting
Refresh
Daily; weekly is enough for roster alone
Platform specifics

The roster as the series

These are the reasons a SSENSE dataset needs its own handling rather than a shared retail schema.

Brand entries, exits and depth

Designer full prices are largely set by brands and move little within a season. What a retailer controls, and what changes when its supplier relationships change, is which brands it carries and how deep.

  • brand_first_seen and brand_last_seen per brand, retained rather than deleted.
  • sku_count_brand per batch — depth, not just presence.
  • A brand going from 400 SKUs to 40 is a different event from a brand disappearing, and both are events.
  • A panel that simply shows current brands hides every one of those changes.

We deliver the roster as an event series, the discipline our panel design page sets out, and we do not attribute an exit to any cause. A brand leaving can reflect the brand's decision, the retailer's, a season boundary or something else entirely — exit_reason is not_determined.

On the restructuring itself

We state what has been publicly reported and nothing more. The data is not a commentary on the business, and we will not produce one from it.

Currency, pricing and what we do not collect

Currency depends on the visitor

Prices are presented in the visitor's local currency, and duties and taxes treatment can differ by destination. market_observed_from and currency_displayed are recorded on every price, with FX stamped at the observation and local currency retained as the primary figure.

A price observed from one market is not the same product offer as from another, so cross-market comparison states both markets.

Markdown timing

For designer stock also carried elsewhere, markdown start dates on a shared schedule, as on our Bloomingdale's page.

What we do not collect

Financial, creditor or court data beyond public reporting, supplier terms, stock quantities, customer data, or a cause attributed to a brand exit.

Scope

What we collect on SSENSE, and what we do not

The right column matters more than the left. Anyone can list fields; the limits are what tell you whether the dataset will hold up.

✅ What we collect

  • brand_first_seen and brand_last_seen per brand, retained
  • sku_count_brand per batch, as depth
  • Brand exits recorded as events, never deleted
  • exit_reason as not_determined
  • market_observed_from and currency_displayed on every price
  • FX stamped per observation, local currency primary
  • Markdown timing on a shared schedule
  • Style-code matching with matched share reported
  • Size availability per size

❌ What we do not, and why

  • A brand exit attributed to a cause
  • Commentary on the retailer's finances derived from the data
  • A current-brands list presented as a roster history
  • A price compared across markets without both markets stated
  • Creditor, supplier or customer data

Core SSENSE fields

The full dictionary is agreed during scoping. These are the fields specific to this platform.

Field What it is on this platform
retailer / market_observed_from Whose site, seen from where
brand_name / brand_first_seen / brand_last_seen The roster as events
sku_count_brand Depth per brand per batch
exit_reason Constant not_determined
product_id / brand_style_code / colourway Match keys
price / currency_displayed / fx_observed_at As displayed, stamped
markdown_started_at / markdown_observed Where our series contains it
match_basis / matched_share_category Cross-stockist
size_availability Per size
panel_schedule_id Shared across stockists
observed_at Timestamp
Use cases

What teams do with SSENSE data

Brand roster tracking

Brand entries, exits and SKU depth over time, which is the series that shows change when a retailer's supplier relationships are in motion.

Designer distribution mapping

Which designers are carried where, across stockists, as a distribution view.

Designer markdown sequencing

Markdown start dates on a shared schedule for stock carried by several stockists.

Market-aware pricing

Prices with the market they were observed from, so a cross-market comparison compares like offers.

The 24-hour sample — run on your sources, not ours

Send us a SSENSE item or category list. We run real collection against it and return the output within 24 hours, with the platform-specific fields populated so you can check them yourself rather than take our word for it.

  • Real extraction from your actual sources
  • Returned within 24 hours
  • Coverage and QA note included
  • You keep the data either way
  • No card, no trial clock
  • Named engineer on the call
Get my free sample Book a 20-min scoping call Reply within one business day. Reference calls available under NDA.
How we engage

Three ways to engage us

Same collection pipeline and QA underneath. The difference is who holds the schedule and how the data reaches you.

Managed service (most common)

We own the collection, the QA and the delivery. You receive clean data on a schedule and never touch a scraper.

  • Dedicated engineer assigned to your account
  • Site changes fixed by us, not reported to you
  • Scheduled delivery to your warehouse or S3
  • Named contact on Slack or email

Best fit: Teams who need the data, not the infrastructure.

API access

The same collection pipeline exposed as an authenticated REST endpoint your systems query directly.

  • On-demand and scheduled endpoints
  • Rate limits agreed to your load profile
  • Sandbox keys for integration testing
  • Versioned schema with deprecation notice

Best fit: Product and engineering teams building on live data.

One-time or project extraction

A defined pull for a specific question — market sizing, diligence, a pitch, a one-off audit.

  • Fixed scope agreed in writing upfront
  • Single delivery with full QA report
  • Methodology documented for your records
  • Converts to managed if you want continuity

Best fit: Research, strategy and diligence work with a deadline.

Pricing

Every engagement is quoted individually, because the honest answer depends on your scope: how many sources, how many records, how often, and how the data reaches you. We scope it with you, run a free pilot on your own sources, and then quote a fixed monthly figure — no per-request metering and no overage billing when volumes move. Request a quote and you will have a number after one call.

SSENSE is usually collected alongside its competitors

Almost nobody buys a single platform in isolation. SSENSE data becomes useful when it sits next to the competitor set on one schema, refreshed on one schedule, so a price index or availability comparison is genuinely like-for-like.

That is what fashion & apparel data covers, and a SSENSE-only engagement can be expanded into it without rebuilding. If you already know you need several platforms, start there instead — it is the same pipeline and usually the better scoping conversation.

FAQ

SSENSE data scraping: frequently asked questions

Platform-specific questions, including what cannot be collected here.

Public reporting describes court-supervised creditor protection in Canada in 2025, with the founding family retaining ownership in early 2026. It continues to trade.

We state what has been publicly reported and do not produce commentary on the business from the data.

Because designer full prices are largely set by brands and move little within a season. Which brands a retailer carries, and how deeply, is what it controls — and what changes when its supplier relationships change.

No. A brand leaving can reflect the brand's decision, the retailer's, a season boundary or something else. We record the exit with its date and leave the reason as not determined.

Yes. Prices are shown in the visitor's currency and duty and tax treatment can differ by destination. We record the market observed from on every price.

For designer stock also carried elsewhere, yes, on a shared schedule across stockists.

We quote individually. A roster-only programme can run weekly and is light; adding price and markdown tracking needs daily.

One scoping call, a free pilot within 24 hours, then a fixed monthly quote. Request a quote.

See real SSENSE data before you commit to anything

Send us an item or category list. We return the output within 24 hours with the platform-specific fields populated.

Free pilot, no card, no obligation. If we cannot collect a field you need on this platform, the sample shows you that too.

Social Proof That Converts

Trusted by Global Leaders Across Q-Commerce, Travel, Retail, and FoodTech

Our web scraping expertise is relied on by 4,000+ global enterprises including Zomato, Tata Consumer, Subway, and Expedia — helping them turn web data into growth.

4,000+ Enterprises Worldwide
50+ Countries Served
20+ Industries
Join 4,000+ companies growing with Actowiz →
Real Results from Real Clients

Hear It Directly from Our Clients

Watch how businesses like yours are using Actowiz data to drive growth.

▶
1 min
★★★★★
"Actowiz Solutions offered exceptional support with transparency and guidance throughout. Anna and Saga made the process easy for a non-technical user like me. Great service, fair pricing!"
TG
Thomas Galido
Co-Founder / Head of Product at Upright Data Inc.
▶
2 min
★★★★★
"Actowiz delivered impeccable results for our company. Their team ensured data accuracy and on-time delivery. The competitive intelligence completely transformed our pricing strategy."
II
Iulen Ibanez
CEO / Datacy.es
▶
1:30
★★★★★
"What impressed me most was the speed — we went from requirement to production data in under 48 hours. The API integration was seamless and the support team is always responsive."
FC
Febbin Chacko
-Fin, Small Business Owner
icons 4.8/5 Average Rating
icons 50+ Video Testimonials
icons 92% Client Retention
icons 50+ Countries Served

Join 4,000+ Companies Growing with Actowiz

From Zomato to Expedia — see why global leaders trust us with their data.

Why Global Leaders Trust Actowiz

Backed by automation, data volume, and enterprise-grade scale — we help businesses from startups to Fortune 500s extract competitive insights across the USA, UK, UAE, and beyond.

icons
7+
Years of Experience
Proven track record delivering enterprise-grade web scraping and data intelligence solutions.
icons
4,000+
Projects Delivered
Serving startups to Fortune 500 companies across 50+ countries worldwide.
icons
200+
In-House Experts
Dedicated engineers across scrapers, AI/ML models, APIs, and data quality assurance.
icons
9.2M
Automated Workflows
Running weekly across eCommerce, Quick Commerce, Travel, Real Estate, and Food industries.
icons
270+ TB
Data Transferred
Real-time and batch data scraping at massive scale, across industries globally.
icons
380M+
Pages Crawled Weekly
Scaled infrastructure for comprehensive global data coverage with 99% accuracy.

AI Solutions Engineered
for Your Needs

→
LLM-Powered Attribute Extraction: High-precision product matching using large language models for accurate data classification.
→
Advanced Computer Vision: Fine-grained object detection for precise product classification using text and image embeddings.
→
GPT-Based Analytics Layer: Natural language query-based reporting and visualization for business intelligence.
→
Human-in-the-Loop AI: Continuous feedback loop to improve AI model accuracy over time.
icons Product Matching icons Attribute Tagging icons Content Optimization icons Sentiment Analysis icons Prompt-Based Reporting

Connect the Dots Across
Your Retail Ecosystem

We partner with agencies, system integrators, and technology platforms to deliver end-to-end solutions across the retail and digital shelf ecosystem.

icons
Analytics Services
icons
Ad Tech
icons
Price Optimization
icons
Business Consulting
icons
System Integration
icons
Market Research
Become a Partner →

Popular Datasets — Ready to Download

Browse All Datasets →
icons
Amazon
eCommerce
Free 100 rows
icons
Zillow
Real Estate
Free 100 rows
icons
DoorDash
Food Delivery
Free 100 rows
icons
Walmart
Retail
Free 100 rows
icons
Booking.com
Travel
Free 100 rows
icons
Indeed
Jobs
Free 100 rows

Latest Insights & Resources

View All Resources →
thumb
Blog

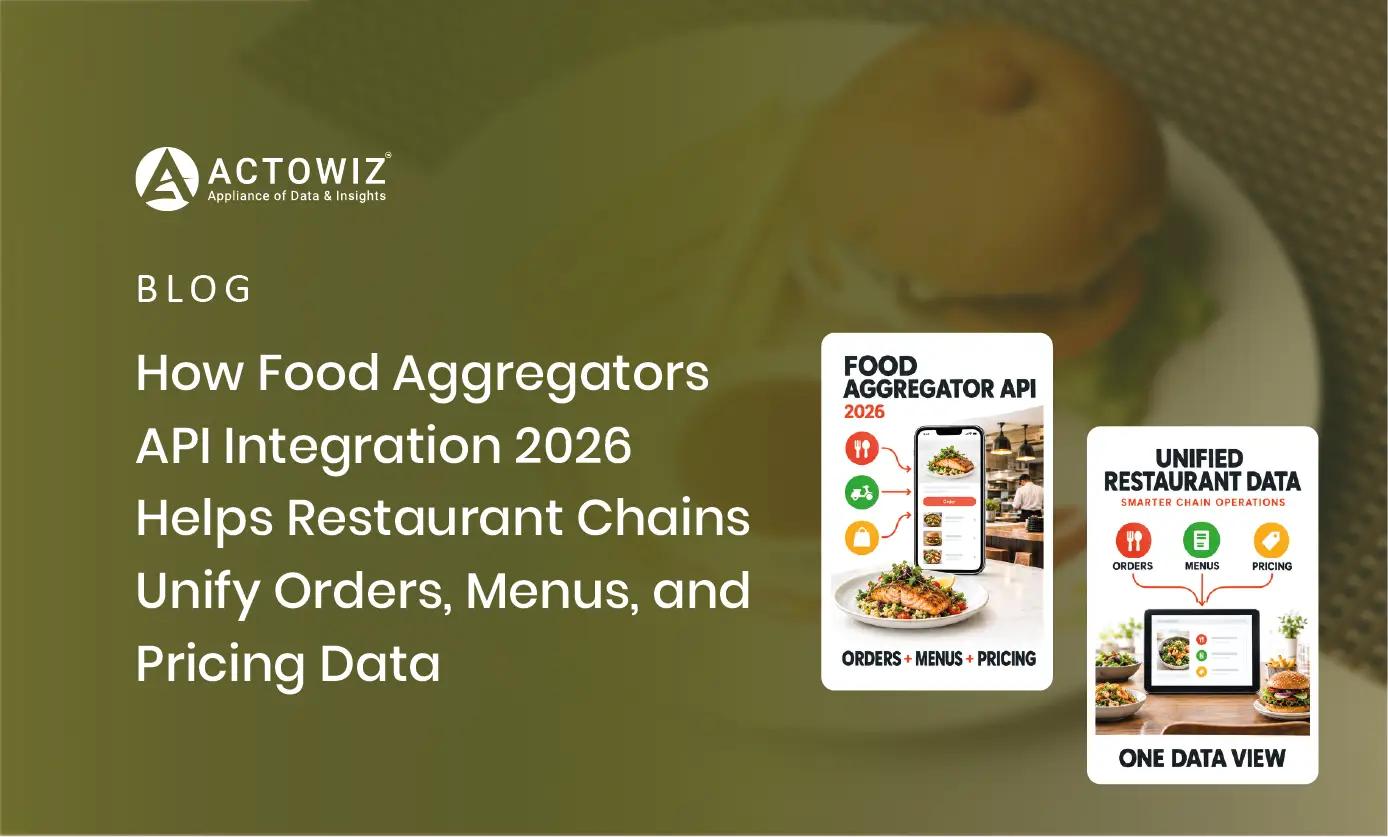
How Food Aggregators API Integration 2026 Helps Restaurant Chains Unify Orders, Menus, and Pricing Data

Food Aggregators API Integration 2026 helps restaurant chains unify menus, orders, pricing, availability, and performance data across platforms.

thumb
Case Study

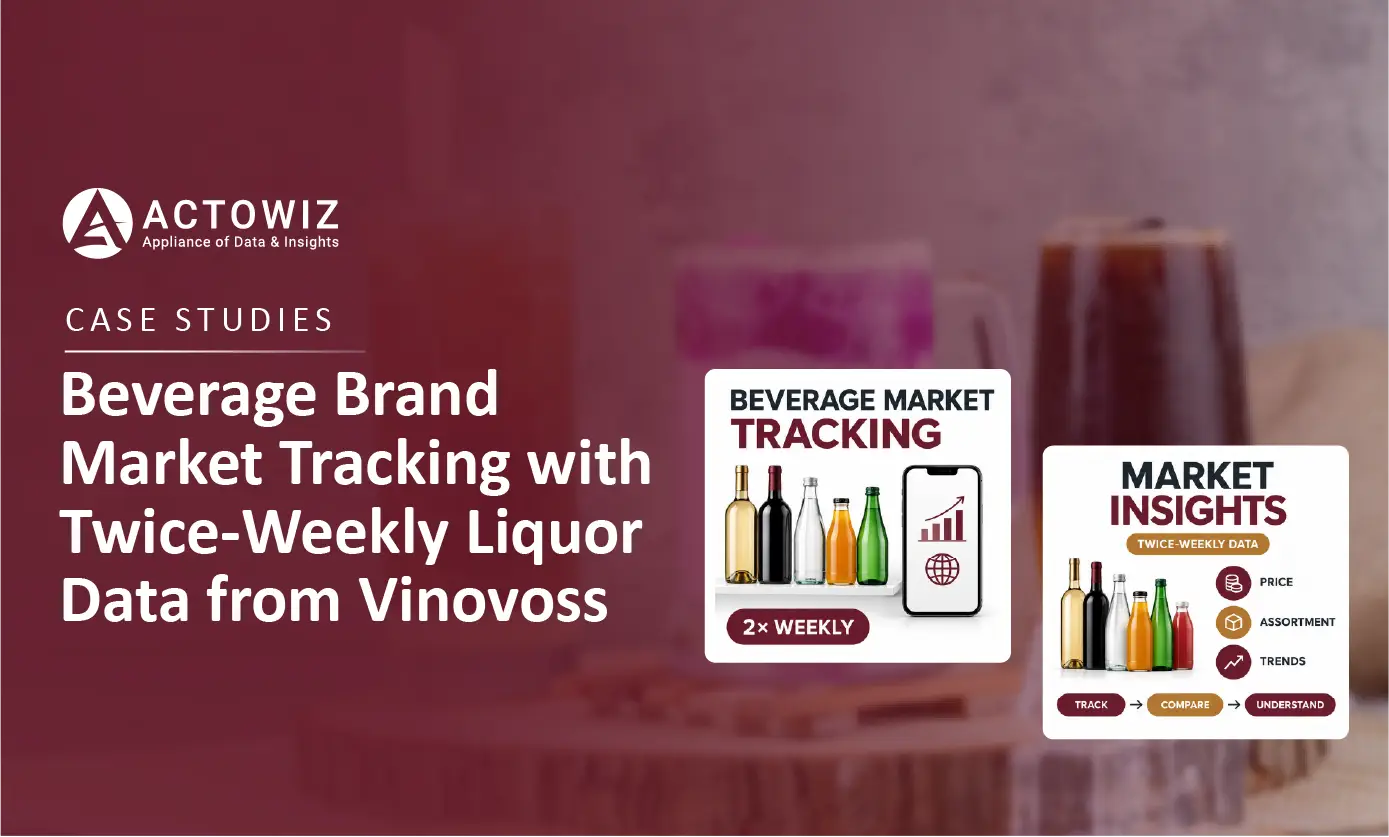
How We Helped a Beverage Brand Optimize Market Tracking with Twice-Weekly Liquor Data Collection from Vinovoss

Track liquor prices, products, availability, and market changes with Twice-Weekly Liquor Data Collection from Vinovoss for timely insights.

thumb
Report

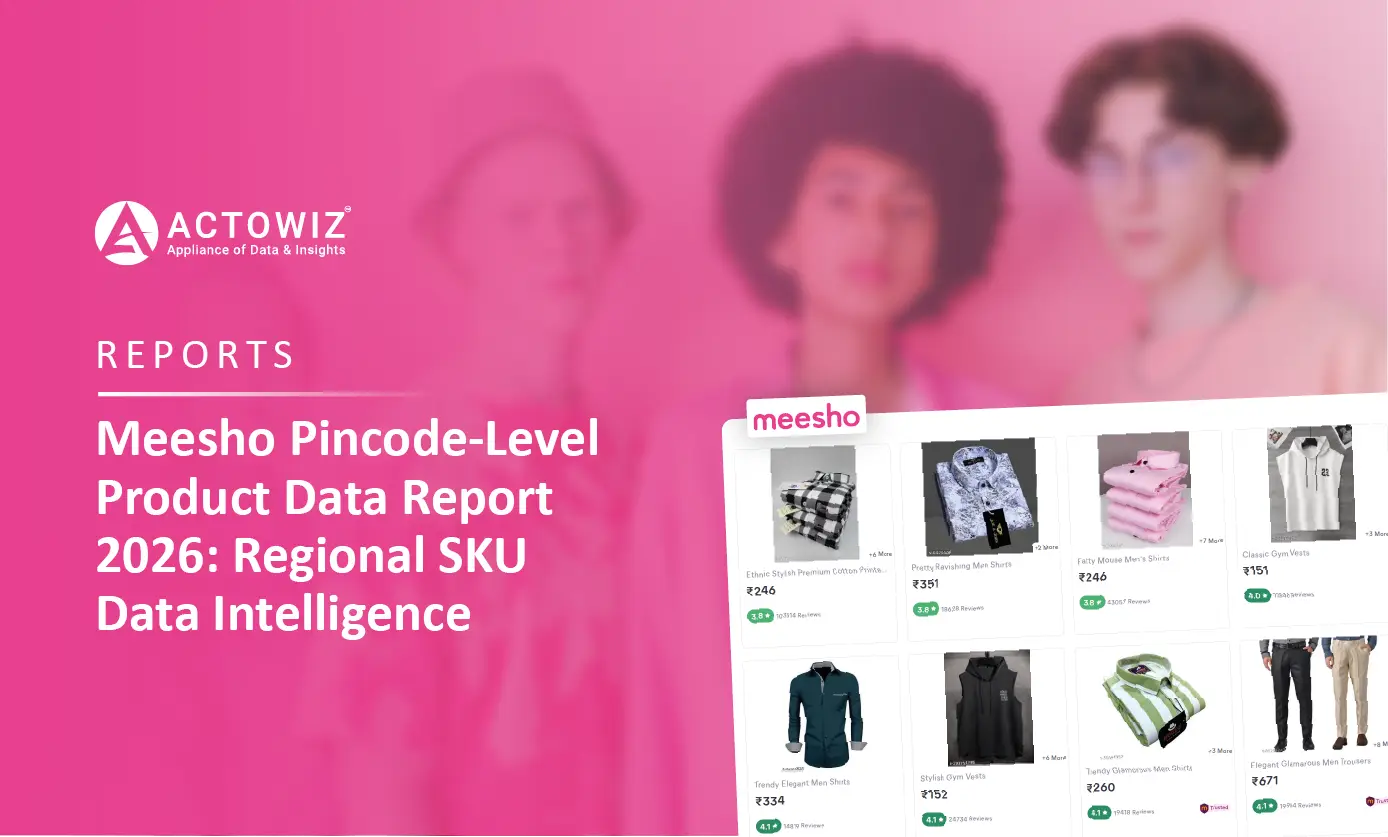
Meesho Pincode-Level Product Data Report 2026

Explore Meesho Pincode-Level Product Data Report 2026 covering local pricing, product availability, SKU trends, and regional e-commerce intelligence.

Start Where It Makes Sense for You

Whether you're a startup or a Fortune 500 — we have the right plan for your data needs.

icons
Enterprise
Book a Strategy Call
Custom solutions, dedicated support, volume pricing for large-scale needs.
icons
Growing Brand
Get Free Sample Data
Try before you buy — 500 rows of real data, delivered in 2 hours. No strings.
icons
Just Exploring
View Plans & Pricing
Transparent plans from $500/mo. Find the right fit for your budget and scale.
Get in Touch
Let's Talk About
Your Data Needs
Tell us what data you need — we'll scope it for free and share a sample within hours.
  • icons
    Free Sample in 2 HoursShare your requirement, get 500 rows of real data — no commitment.
  • icons
    Plans from $500/monthFlexible pricing for startups, growing brands, and enterprises.
  • icons
    US-Based SupportOffices in New York & California. Aligned with your timezone.
  • icons
    ISO 9001 & 27001 CertifiedEnterprise-grade security and quality standards.
Request Free Sample Data
Fill the form below — our team will reach out within 2 hours.
+1 ▼
✓ Free 500-row sample · No credit card · Response within 2 hours

Request Free Sample Data

Our team will reach out within 2 hours with 500 rows of real data — no credit card required.

+1 ▼
✓ Free 500-row sample · No credit card · Response within 2 hours