Core services
Enterprise Data Extraction

Scalable web, app and AI-powered collection across 40+ countries.

All 58 services →
New 2026
AI Training Data

Corpus building with provenance and opt-out compliance.

Learn more →
Free pilot
24-hour sample

We run collection on your own sources before you commit.

Get a sample →
58Services
40+Countries
DEVELOPER

Ready-Made Scrapers

Pre-built for top platforms. Self-serve, no setup.

View All →
TRY FREE

API Playground

Test endpoints instantly. No credit card.

Start Free →
28Tools
2SDKs
icons Delivery & SDKs
Streaming Crawl API Scheduler Realtime Alerts Webhook Delivery 🐍 Python SDK 💚 Node.js SDK

Need it managed instead?

Fixed monthly retainer, named engineer, no per-request metering.

Managed Data API →
HOT

Case Studies

How brands use Actowiz, with named outcomes.

Read →
FREE

Sample Datasets

Real output, no signup.

Download →
NEW

ROI Calculator

Model the return on a data engagement.

Calculate →

Introduction

India's e-commerce market has undergone a major geographic transformation between 2020 and 2026. Online shopping is no longer concentrated primarily in metropolitan areas; Tier II, Tier III, and smaller cities are increasingly contributing to shopper growth, order volumes, seller participation, and product discovery. This shift makes location-specific marketplace intelligence particularly valuable for brands, retailers, sellers, researchers, and e-commerce strategists.

The Meesho Pincode-Level Product Data Report 2026 examines how product pricing, availability, assortment, seller presence, and SKU-level information can be analysed at a granular geographic level. Rather than treating India as one homogeneous market, pincode-level data can reveal differences in product visibility, prices, availability, delivery reach, and competitive intensity.

Pricing & Product Data can be transformed into a structured intelligence layer that enables businesses to compare markets, identify regional opportunities, understand local assortment patterns, and monitor changes over time.

India's e-commerce market was valued at approximately US$125 billion in 2024 and is projected to reach US$163 billion by 2026. The share of online shoppers from Tier II and Tier III cities increased from 46% in FY20 to 56% in FY24 and is projected to reach 64% by FY30.

Meesho's own scale demonstrates the importance of granular marketplace data. For FY2025, the company reported 198.77 million annual transacting users, 1.83 billion placed orders, and ₹299.88 billion in marketplace NMV. By the quarter ended June 30, 2026, its investor-relations site reported more than 274 million annual transacting users, more than 1.04 million annual transacting sellers, and more than 2.83 billion placed orders.

Mapping Local Price Differences Across Markets

Location can influence the products consumers see, their availability, delivery feasibility, and sometimes the final price or promotional opportunity. Meesho Pincode-level Pricing Data Scraping can help businesses build a structured view of these local differences. Combined with Meesho Data Scraping, the resulting datasets can be used to compare product listings, prices, discounts, sellers, and availability across selected pincodes.

The importance of this approach has increased as smaller cities have become central to India's online-commerce growth. In FY20, 46% of online shoppers came from Tier II and Tier III cities; by FY24, that share had increased to 56%. The projection for FY30 is 64%.

Year Market / Geographic Indicator Intelligence Opportunity
2020 46% Tier II/III online shoppers Establish geographic baseline
2021 Digital adoption accelerated Expand pincode coverage
2022 Marketplace adoption broadened Compare local pricing
2023 Smaller-city demand strengthened Monitor regional assortment
2024 56% shoppers from Tier II/III Increase location-level tracking
2025 290–300M online shoppers in India Scale geographic datasets
2026 320–340M online transacting users expected Develop granular market intelligence

Pincode-level pricing analysis can capture MRP, selling price, discount, seller information, product category, delivery availability, and timestamp. Repeating the observation across multiple locations creates a historical dataset that can reveal whether a pricing difference is persistent or temporary.

For example, a product listed at ₹799 in one location and ₹749 in another may warrant investigation into promotional conditions, seller availability, delivery costs, inventory, or marketplace-specific pricing behaviour. A larger dataset makes it possible to identify patterns rather than relying on individual observations.

This type of intelligence can be particularly valuable for brands expanding beyond metropolitan markets. Instead of applying a national pricing strategy uniformly, businesses can identify local competitive conditions and determine where product prices, promotions, or assortment may require adjustment.

Understanding Where Products Are Actually Available

Marketplace visibility does not necessarily mean that every product is equally accessible to every customer. Product availability can vary according to seller inventory, fulfilment capabilities, logistics coverage, product attributes, and location. Meesho product availability by pincode provides a framework for understanding these geographic differences.

The significance of location-specific availability has increased with the expansion of India's online shopper base. IBEF reports that approximately 290–300 million people were online shoppers in 2025, with Tier 2+ cities contributing around 65% of incremental shoppers.

Year Online-Commerce Development Availability Intelligence
2020 Pandemic accelerated digital adoption Track delivery reach
2021 More consumers shifted online Establish pincode coverage
2022 Regional marketplace adoption increased Monitor SKU availability
2023 Non-metro shopping expanded Compare local assortment
2024 Tier II/III shopper share reached 56% Identify availability gaps
2025 290–300M online shoppers Monitor broader geographic coverage
2026 320–340M annual online transacting users Build real-time availability intelligence

A structured availability dataset can record whether a product is deliverable to a specific pincode, whether particular variants are available, and whether the expected delivery window changes. Over time, these observations can reveal geographic gaps.

For sellers, this can highlight locations where products are consistently unavailable despite strong demand potential. For brands, the same information can indicate where distribution or fulfilment expansion may be commercially attractive.

Availability intelligence can also be combined with price information. A market where a product is widely available at a competitive price may represent a mature opportunity, while a market with limited availability but strong category demand could represent an expansion opportunity.

This makes pincode-level analysis useful for both operational planning and strategic market research.

Measuring the Rise of Smaller-City Commerce

The growth of Tier II and Tier III markets is one of the strongest structural changes in Indian e-commerce. Meesho Tier 2 and Tier 3 market analysis can help businesses understand how assortment, pricing, seller activity, and consumer access differ beyond major metropolitan markets.

In 2024, Meesho reported 35% year-on-year growth, with more than half of its orders coming from small towns, according to IBEF. By FY26, Tier II and Tier III cities were expected to contribute 66% of new D2C orders, according to a Unicommerce report cited by IBEF.

Year Small-City Commerce Signal Strategic Importance
2020 46% of online shoppers from Tier II/III Geographic expansion begins
2021 Digital adoption accelerates New local demand
2022 Smaller cities increasingly shop online Broader product reach
2023 Non-metro markets mature Local benchmarking
2024 More than half of Meesho orders from small towns Strong marketplace relevance
2025 Tier II+ cities drive ~65% of incremental shoppers Regional expansion
2026 66% of new D2C orders projected from Tier II/III Hyperlocal strategy becomes central

The opportunity is not simply about reaching more consumers. Smaller cities can exhibit different preferences in fashion, beauty, home products, electronics, and value-oriented merchandise. Product categories that perform strongly in metros may not necessarily have the same pricing or assortment requirements in smaller locations.

Pincode-level datasets allow these differences to be quantified. Businesses can group locations by city tier, state, region, or other geographic classifications and compare product counts, average prices, discount levels, seller concentration, and availability.

Such analysis can help brands determine where to expand, which products to promote, and which regional markets show underserved demand. For marketplace sellers, it can also identify locations where competition is relatively low but product availability suggests an opportunity.

Evaluating Direct-to-Consumer Competitive Signals

The rise of D2C brands has created another important layer of competition within India's digital commerce ecosystem. Meesho D2C competitive Data intelligence can help brands compare marketplace products, prices, assortment, promotions, and seller activity against broader digital-commerce trends.

India's D2C ecosystem is increasingly being driven by smaller cities. According to Unicommerce data cited by IBEF, Tier II and Tier III cities are expected to contribute nearly 66% of new D2C orders in FY26, alongside a 33% increase in order volumes and 32% growth in GMV.

Year D2C / E-commerce Trend Competitive Intelligence Focus
2020 Digital-first brands gain momentum Establish competitor baselines
2021 Online consumer acquisition expands Track product positioning
2022 D2C assortment broadens Compare category depth
2023 Regional demand strengthens Monitor local competitors
2024 Small-town demand accelerates Compare regional prices
2025 D2C and marketplace competition intensifies Track sellers and promotions
2026 Tier II/III expected to drive 66% of new D2C orders Build geographic competitive intelligence

D2C intelligence can include brand names, product titles, categories, price points, discount percentages, ratings, reviews, seller information, and availability. Comparing these variables across locations can reveal whether competitive intensity differs significantly between metropolitan and smaller markets.

For example, a brand may face intense competition in Mumbai but relatively limited competition for the same product category in a Tier III city. A pincode-level dataset can help quantify this difference.

The value increases further when data is collected historically. Instead of simply identifying today's competitors, businesses can determine which brands are entering a market, which products are gaining visibility, and where pricing strategies are changing.

This provides a more complete view of competitive dynamics and supports smarter regional expansion strategies.

Structuring Seller and Product Intelligence

Marketplace sellers represent a critical component of regional e-commerce. Meesho Seller & Product Data Extraction can help businesses understand which sellers are active, what products they offer, how prices differ, and how assortment varies across geographic markets.

Meesho's scale makes seller intelligence particularly significant. Its FY2025 prospectus data reported 706,471 annual transacting sellers for the last twelve months ended September 30, 2025. By June 2026, the company's investor-relations site reported more than 1.04 million annual transacting sellers.

Year Seller / Marketplace Development Data Opportunity
2020 Seller digitisation accelerates Build seller baselines
2021 Marketplace participation grows Track product portfolios
2022 Regional sellers expand Identify local suppliers
2023 Marketplace assortment broadens Compare seller pricing
2024 Non-metro demand expands Map seller-market relationships
2025 706K+ annual transacting sellers* Large-scale seller intelligence
2026 1.04M+ annual transacting sellers* Scalable seller monitoring

*Figures are from different reporting periods and should not be treated as a like-for-like annual series.

Seller-level data can include seller name, product assortment, pricing, discounts, category, ratings, product availability, and geographic coverage. When combined with pincode information, this creates a valuable picture of how supply is distributed across markets.

Brands can use such data to identify competitive sellers and pricing clusters. Marketplace analysts can study seller concentration by category or region. Researchers can identify whether certain locations have more fragmented or concentrated supply.

Seller intelligence can also support assortment benchmarking. If several sellers offer similar products at substantially different prices, businesses can investigate whether product quality, brand positioning, delivery conditions, or other attributes explain the difference.

This makes seller and product data useful for competitive research, market-entry studies, pricing strategy, and regional assortment planning.

Delivering Granular Marketplace Data Through APIs

Large-scale pincode monitoring can generate substantial volumes of product and location observations. Meesho SKU-Level Data API infrastructure can help businesses integrate structured product intelligence into dashboards, databases, analytics environments, and internal applications.

The need for scalable data delivery is reflected in Meesho's rapidly increasing transaction volumes. Its FY2025 results reported 1.83 billion placed orders, while its Q3 FY26 shareholder letter reported 690 million placed orders during the quarter and 1.951 billion orders during the first nine months of FY26.

Year Marketplace Scale Signal Data Infrastructure Need
2020 Digital adoption accelerates Basic structured datasets
2021 E-commerce user base expands Automated collection
2022 Regional demand broadens More pincode coverage
2023 SKU diversity increases Historical databases
2024 E-commerce market reaches US$125B Scalable pipelines
2025 Meesho reports 1.83B placed orders High-volume data processing
2026 Meesho reports 2.83B+ placed orders for quarter ended June API-driven intelligence

A scalable API layer can provide normalized product information with fields such as SKU, title, category, seller, price, MRP, discount, availability, pincode, timestamp, and product URL. Businesses can then connect the information to an E-commerce Dashboard, pricing systems, business-intelligence platforms, or internal databases.

The principal advantage is repeatability. Rather than performing individual research exercises, organisations can establish recurring data workflows that continuously update product and geographic observations.

This creates a historical intelligence asset capable of supporting price tracking, assortment analysis, seller monitoring, availability studies, market expansion, and competitive research.

Actowiz Solutions can help businesses build scalable marketplace data workflows focused on product, pricing, seller, SKU, and geographic intelligence. The E-commerce Dashboard approach can bring pincode-level observations into a single analytical environment, allowing businesses to compare prices, product counts, availability, sellers, categories, and regional trends.

The Meesho Pincode-Level Product Data Report 2026 demonstrates how granular marketplace information can support more precise decision-making. Instead of relying on national averages, businesses can analyse individual locations and identify meaningful differences between metros, Tier II cities, Tier III markets, and other regions.

Actowiz Solutions can support data extraction, validation, normalization, historical storage, and structured delivery based on business requirements. Datasets can be designed around selected pincodes, categories, sellers, products, SKUs, and monitoring frequencies.

This enables brands, retailers, marketplace researchers, D2C companies, and analytics teams to transform fragmented marketplace information into structured intelligence that supports pricing, assortment, competitive benchmarking, and expansion decisions.

Conclusion

India's e-commerce landscape has become increasingly decentralised between 2020 and 2026. Tier II and Tier III cities are now major contributors to online shopper and order growth, while marketplaces continue to expand their user, seller, product, and transaction ecosystems. The result is a market where national-level data alone may not provide sufficient visibility.

The Meesho Pincode-Level Product Data Report 2026 highlights the value of analysing pricing, availability, sellers, products, SKUs, and assortment at a granular geographic level. Meesho's reported growth—from 198.77 million annual transacting users and 1.83 billion placed orders in FY2025 to more than 274 million annual transacting users and 2.83 billion+ placed orders for the quarter ended June 2026—illustrates the scale of the marketplace and the importance of structured intelligence.

Businesses can strengthen these capabilities through Ecommerce Data Scraping, supported by a scalable Web Crawling service and Web Data Mining framework. Combining geographic information with product and seller attributes can create a powerful dataset for pricing intelligence, regional assortment analysis, competitive benchmarking, and market expansion.

Turn pincode-level marketplace data into actionable e-commerce intelligence with Actowiz Solutions—connect with our team to build a customized product, pricing, seller, SKU, and regional data solution for 2026!

Social Proof That Converts

Trusted by Global Leaders Across Q-Commerce, Travel, Retail, and FoodTech

Our web scraping expertise is relied on by 4,000+ global enterprises including Zomato, Tata Consumer, Subway, and Expedia — helping them turn web data into growth.

4,000+ Enterprises Worldwide
50+ Countries Served
20+ Industries
Join 4,000+ companies growing with Actowiz →
Real Results from Real Clients

Hear It Directly from Our Clients

Watch how businesses like yours are using Actowiz data to drive growth.

▶
1 min
★★★★★
"Actowiz Solutions offered exceptional support with transparency and guidance throughout. Anna and Saga made the process easy for a non-technical user like me. Great service, fair pricing!"
TG
Thomas Galido
Co-Founder / Head of Product at Upright Data Inc.
▶
2 min
★★★★★
"Actowiz delivered impeccable results for our company. Their team ensured data accuracy and on-time delivery. The competitive intelligence completely transformed our pricing strategy."
II
Iulen Ibanez
CEO / Datacy.es
▶
1:30
★★★★★
"What impressed me most was the speed — we went from requirement to production data in under 48 hours. The API integration was seamless and the support team is always responsive."
FC
Febbin Chacko
-Fin, Small Business Owner
icons 4.8/5 Average Rating
icons 50+ Video Testimonials
icons 92% Client Retention
icons 50+ Countries Served

Join 4,000+ Companies Growing with Actowiz

From Zomato to Expedia — see why global leaders trust us with their data.

Why Global Leaders Trust Actowiz

Backed by automation, data volume, and enterprise-grade scale — we help businesses from startups to Fortune 500s extract competitive insights across the USA, UK, UAE, and beyond.

icons
7+
Years of Experience
Proven track record delivering enterprise-grade web scraping and data intelligence solutions.
icons
4,000+
Projects Delivered
Serving startups to Fortune 500 companies across 50+ countries worldwide.
icons
200+
In-House Experts
Dedicated engineers across scrapers, AI/ML models, APIs, and data quality assurance.
icons
9.2M
Automated Workflows
Running weekly across eCommerce, Quick Commerce, Travel, Real Estate, and Food industries.
icons
270+ TB
Data Transferred
Real-time and batch data scraping at massive scale, across industries globally.
icons
380M+
Pages Crawled Weekly
Scaled infrastructure for comprehensive global data coverage with 99% accuracy.

AI Solutions Engineered
for Your Needs

→
LLM-Powered Attribute Extraction: High-precision product matching using large language models for accurate data classification.
→
Advanced Computer Vision: Fine-grained object detection for precise product classification using text and image embeddings.
→
GPT-Based Analytics Layer: Natural language query-based reporting and visualization for business intelligence.
→
Human-in-the-Loop AI: Continuous feedback loop to improve AI model accuracy over time.
icons Product Matching icons Attribute Tagging icons Content Optimization icons Sentiment Analysis icons Prompt-Based Reporting

Connect the Dots Across
Your Retail Ecosystem

We partner with agencies, system integrators, and technology platforms to deliver end-to-end solutions across the retail and digital shelf ecosystem.

icons
Analytics Services
icons
Ad Tech
icons
Price Optimization
icons
Business Consulting
icons
System Integration
icons
Market Research
Become a Partner →

Popular Datasets — Ready to Download

Browse All Datasets →
icons
Amazon
eCommerce
Free 100 rows
icons
Zillow
Real Estate
Free 100 rows
icons
DoorDash
Food Delivery
Free 100 rows
icons
Walmart
Retail
Free 100 rows
icons
Booking.com
Travel
Free 100 rows
icons
Indeed
Jobs
Free 100 rows

Latest Insights & Resources

View All Resources →
thumb
Blog

How Extract Cosmetics Category Data from E-Commerce Solves Daily SKUs, Sales, and Keywords Tracking Challenges

Extract Cosmetics Category Data from E-Commerce to track daily SKUs, sales, keywords, pricing, and product trends for smarter beauty market analysis.

thumb
Case Study

How We Helped a Beverage Brand Optimize Market Tracking with Twice-Weekly Liquor Data Collection from Vinovoss

Track liquor prices, products, availability, and market changes with Twice-Weekly Liquor Data Collection from Vinovoss for timely insights.

thumb
Report

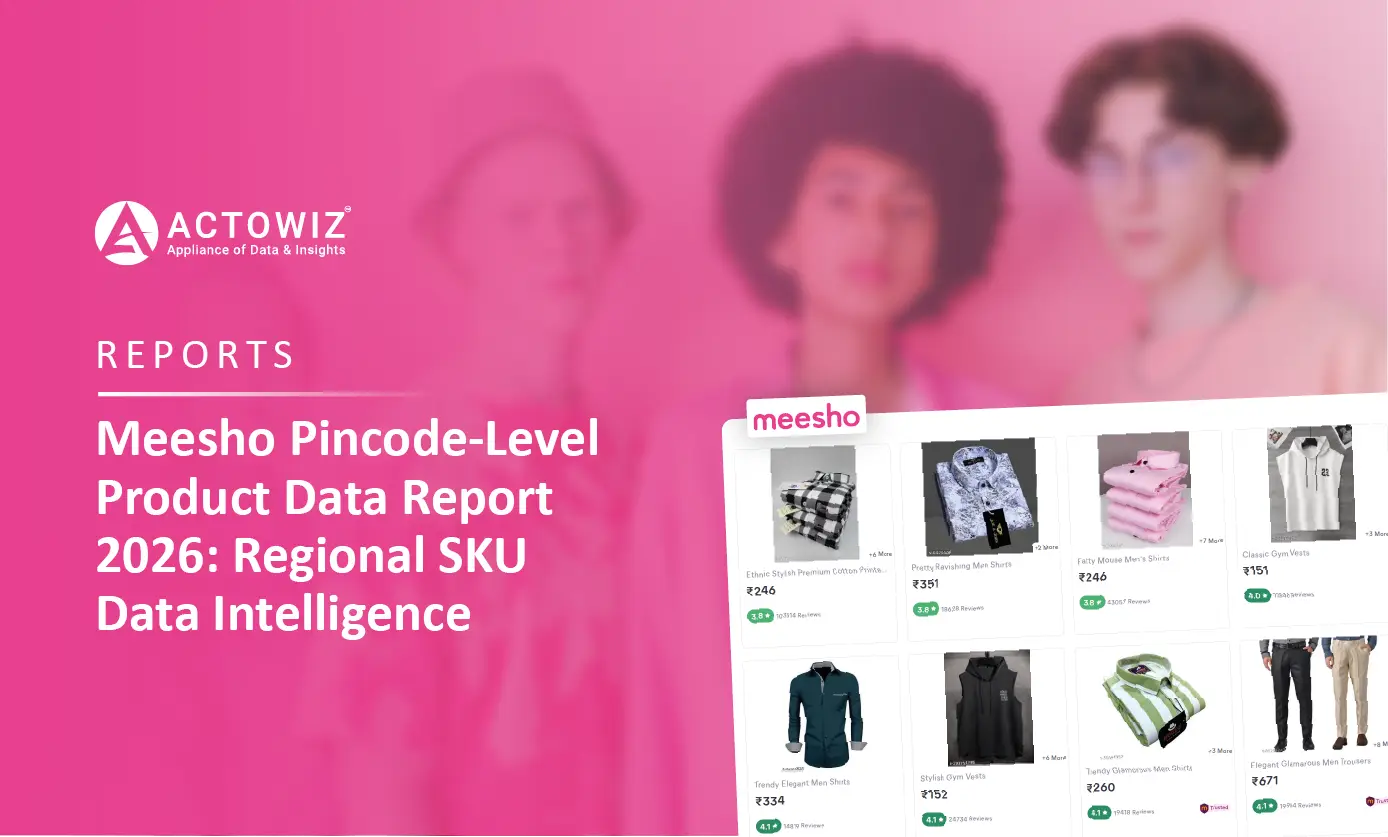
Meesho Pincode-Level Product Data Report 2026

Explore Meesho Pincode-Level Product Data Report 2026 covering local pricing, product availability, SKU trends, and regional e-commerce intelligence.

Start Where It Makes Sense for You

Whether you're a startup or a Fortune 500 — we have the right plan for your data needs.

icons
Enterprise
Book a Strategy Call
Custom solutions, dedicated support, volume pricing for large-scale needs.
icons
Growing Brand
Get Free Sample Data
Try before you buy — 500 rows of real data, delivered in 2 hours. No strings.
icons
Just Exploring
View Plans & Pricing
Transparent plans from $500/mo. Find the right fit for your budget and scale.

Request Free Sample Data

Our team will reach out within 2 hours with 500 rows of real data — no credit card required.

+1 ▼
✓ Free 500-row sample · No credit card · Response within 2 hours