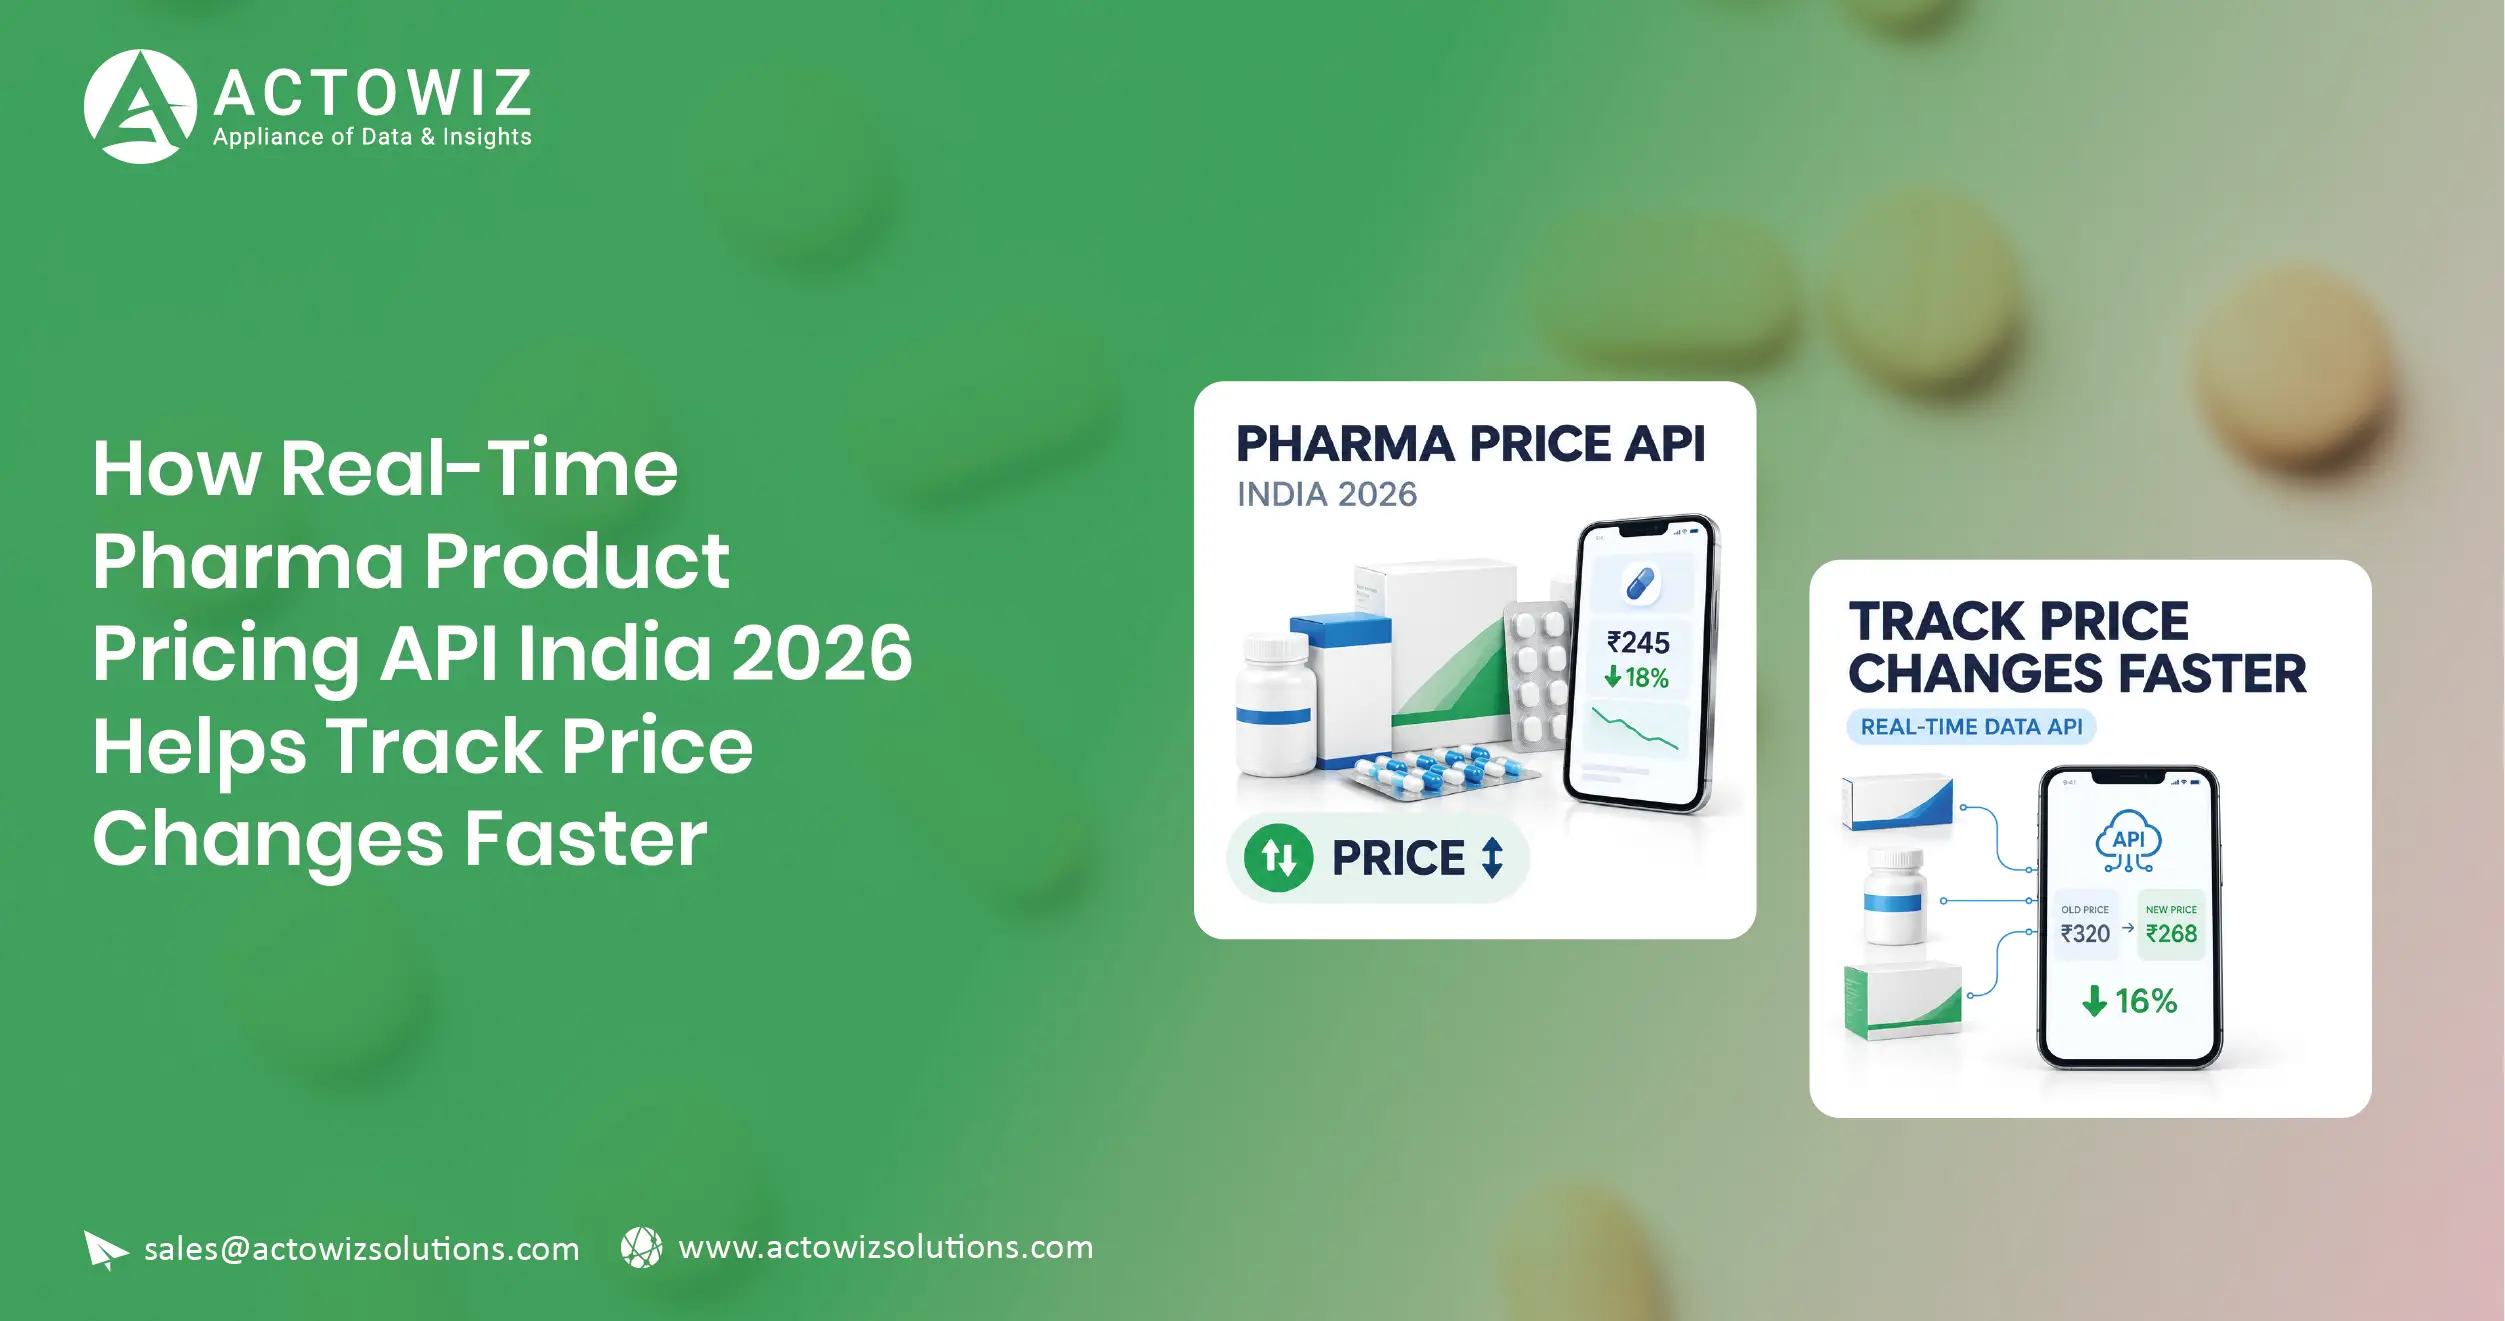
Introduction
Pharmaceutical pricing in India changes across products, formulations, brands,
channels, and regulatory updates. Real-Time Pharma Product Pricing API India 2026 can help
pharmaceutical companies, distributors, online pharmacies, aggregators, and market-research
teams collect structured pricing and availability information at regular intervals instead of
relying on manual price checks.
India's domestic pharmaceutical market was valued at ₹5.30 lakh crore (US$60
billion) in FY26, while the country's pharmaceutical industry continues to expand across
domestic consumption, manufacturing, exports, and digital healthcare.
The pricing environment also has a regulatory dimension. The National Pharmaceutical
Pricing Authority (NPPA) maintains price-control mechanisms and its Pharma Sahi Daam service
allows users to check prices of scheduled and non-scheduled medicines.
For businesses, however, checking one product at a time is not sufficient when
thousands of SKUs need monitoring. Healthcare &
Pharmacy Data Scraping can create a structured
data layer containing product names, manufacturers, strengths, pack sizes, MRP, selling prices,
discounts, availability, seller information, and timestamps where those fields are publicly
accessible.
The core answer is simple: real-time or high-frequency pharmaceutical pricing data
helps businesses detect price changes earlier, compare competing offers, monitor inventory
signals, and build historical pricing intelligence.
Why Does Faster Pharmaceutical Price Tracking Matter?
A pharmaceutical pricing workflow needs to distinguish between several different
values:
- MRP
- Selling price
- Discounted price
- Unit price
- Pack price
- Price per dosage where calculable
- Availability
- Seller or pharmacy
- Collection timestamp
A product priced at ₹500 on one channel and ₹450 on another should not automatically
be interpreted as a 10% competitive discount. The comparison needs to consider pack size,
formulation, strength, seller, location, and whether the prices refer to MRP or the final
selling price.
The need for careful monitoring is reinforced by India's regulated pricing
environment. NPPA continues to issue price-related decisions under the Drugs (Prices Control)
Order, 2013. In May 2026, NPPA reported fixing retail prices for 42 formulations following its
145th Authority meeting.
What Should a Pricing Dataset Capture?
| Data Field |
Why It Matters |
| Product Name |
Identifies the medicine |
| Brand |
Enables brand comparison |
| Manufacturer |
Supports manufacturer-level analysis |
| Strength |
Prevents incorrect product matching |
| Dosage Form |
Distinguishes tablets, capsules, syrups, etc. |
| Pack Size |
Enables like-for-like comparison |
| MRP |
Regulatory/reference pricing |
| Selling Price |
Actual listed commercial price |
| Discount |
Measures price reduction |
| Availability |
Tracks supply visibility |
| Seller |
Identifies selling channel |
| Timestamp |
Establishes when the price was observed |
This structure allows businesses to move from simple price collection to systematic
market intelligence.
How Can Businesses Build a Consistent Pricing Data Layer?
India Pharmaceutical product pricing data API solutions can help businesses access
structured product and pricing records without repeatedly collecting information manually.
An API-based architecture is particularly useful when a company needs to feed
pricing information into an existing dashboard, data warehouse, business-intelligence platform,
or internal application.
The workflow generally involves four stages:
1. Collection – Gather accessible product and pricing information.
2. Normalization – Standardize product names, manufacturers, pack sizes, currencies,
and price fields.
3. Validation – Detect missing, inconsistent, or duplicate records.
4. Delivery – Provide structured records through an API, database, file, or
customized data feed.
India's Pharmaceutical Market Scale
India's domestic pharmaceutical market reached ₹5.30 lakh crore in FY26, according
to IBEF, which also reports a projection of ₹12.47 lakh crore by 2030.
| Market Indicator |
Reported Value |
Period |
| Domestic pharmaceutical market |
₹5.30 lakh crore |
FY26 |
| Domestic pharmaceutical market |
US$60 billion |
FY26 |
| Projected domestic market |
₹12.47 lakh crore |
2030 |
| Projected domestic market |
US$130 billion |
2030 |
| Pharmaceutical sector turnover |
₹2.25 lakh crore |
FY25 |
| Pharmaceutical exports |
More than US$31 billion |
FY26 |
*Source: IBEF and Government-reported industry data. *
The scale of the market makes automation important. A pricing team monitoring a few
dozen products may manage periodic manual checks. A national operation covering thousands of
products and multiple sellers requires automated collection and structured storage.
Practical Example
Suppose a distributor wants to monitor 5,000 pharmaceutical SKUs across several
online channels.
A manual process would require employees to search each product, record the current
price, check availability, and update a spreadsheet.
An automated workflow can instead collect the available fields at scheduled
intervals, match records to the company's master catalog, calculate price differences, and send
only significant changes to analysts.
The API is therefore not merely a technical delivery mechanism. It becomes part of
the pricing-monitoring workflow.
How Can Businesses Monitor Price and Availability Together?
Pharma pricing & inventory data API India combines two closely related signals: what
a product costs and whether it is available.
This distinction matters because a price change without an availability signal can
produce an incomplete picture.
For example:
- Product A: ₹100 and in stock
- Product B: ₹90 but unavailable
- Product C: ₹105 and available
A simple lowest-price comparison would identify Product B as the cheapest option. An
inventory-aware comparison recognizes that Product B may not currently be purchasable.
This is where Real-Time Pharma Product Pricing API India 2026 becomes valuable as a
recurring data architecture rather than a one-time extraction project.
Real Regulatory Pricing Activity
NPPA's 2026 records show continued pricing activity. Its May 2026 updates included
retail-price fixation for 42 formulations and extensions involving separate ceiling prices for
an IV-fluid formulation.
| NPPA Activity |
Reported Detail |
Date |
| Retail prices fixed |
42 formulations |
4 May 2026 |
| Separate ceiling-price extension |
IV-fluid formulation |
4 May 2026 |
| Draft price calculation sheets |
Multiple formulations |
May 2026 |
| NPPA Authority meeting |
145th meeting |
30 April 2026 |
This demonstrates why pharmaceutical price-monitoring systems need to account for
both commercial marketplace prices and regulatory pricing information.
Recommended Price-Inventory Fields
| Field |
Business Question |
| MRP |
What is the reference price? |
| Selling Price |
What is the listed commercial price? |
| Discount |
How much lower is the selling price? |
| Stock Status |
Is the product currently available? |
| Pack Size |
Is the comparison like-for-like? |
| Seller |
Who is offering the product? |
| Location |
Where is the offer available? |
| Timestamp |
When was it observed? |
A business can then calculate meaningful metrics such as price gaps only after
matching products on strength, formulation, pack size, and other relevant attributes.
How Can Businesses Track Individual Pharmaceutical Products Accurately?
Pharma SKU pricing & availability data India enables businesses to monitor
individual product records rather than treating an entire medicine category as one pricing unit.
SKU-level identification is particularly important in pharmaceuticals because a
single brand can have multiple:
- Strengths
- Pack sizes
- Dosage forms
- Flavors
- Manufacturers
- Combination formulations
- Product variants
A 10-tablet pack should not be directly compared with a 30-tablet pack. Similarly,
250 mg and 500 mg formulations should not be treated as the same SKU.
Product-Matching Framework
| Attribute |
Matching Requirement |
| Brand |
Same or equivalent brand |
| Generic/Composition |
Same active ingredient(s) |
| Strength |
Same strength |
| Dosage Form |
Same formulation |
| Pack Size |
Same quantity |
| Manufacturer |
Record separately |
| MRP |
Compare corresponding pack |
| Selling Price |
Compare same product |
| Availability |
Track by seller/location |
This structure reduces false price alerts.
Practical Example
Consider a medicine listed in 10-tablet and 15-tablet packs.
If the 10-tablet pack is listed at ₹120 and the 15-tablet pack at ₹165, comparing
their absolute prices could incorrectly suggest that one seller is cheaper.
A normalized analysis can calculate price per tablet:
- 10-tablet pack: ₹12 per tablet
- 15-tablet pack: ₹11 per tablet
The business can then identify the actual unit-price difference.
This kind of normalization is essential for pharmaceutical pricing analytics.
It also enables companies to identify whether price changes are genuine changes in
commercial pricing or simply differences caused by pack size and product configuration.
How Can Businesses Detect Competitive Price Movements?
Real-time pharmaceutical competitive pricing data enables businesses to monitor
price changes across selected products, brands, sellers, or channels and compare them against
their own pricing records.
India's pharmaceutical market has shown measurable price and volume changes across
therapy areas. In May 2025, the Indian Pharmaceutical Market grew 7.2%, while its moving annual
turnover for June 2024–May 2025 reached more than ₹2.29 lakh crore.
In July 2025, the market grew 7.9%, while MAT for August 2024–July 2025 exceeded
₹2.30 lakh crore.
| Market Metric |
Reported Value |
Period |
| Indian Pharmaceutical Market growth |
7.2% |
May 2025 |
| IPM MAT |
>₹2.29 lakh crore |
June 2024–May 2025 |
| IPM growth |
7.9% |
July 2025 |
| IPM MAT |
>₹2.30 lakh crore |
August 2024–July 2025 |
| Domestic volume growth |
0.4% |
June 2024–May 2025 |
| Domestic volume growth |
0.4% |
August 2024–July 2025 |
*Source: Pharmarack data reported by IBEF. *
These figures show why pricing teams should distinguish value growth from
unit-volume growth.
What Can a Competitive Pricing Monitor Detect?
A recurring system can identify:
- Price increases
- Price reductions
- New discounts
- Product availability changes
- Competitor assortment changes
- Seller entry or exit
- Pack-size differences
- Persistent price gaps
- Sudden price movements
For example, a pharmaceutical distributor can set an internal monitoring rule that
flags a tracked SKU whenever a competitor's listed selling price changes.
The alert can contain:
Product → Previous Price → Current Price → Difference → Competitor → Availability →
Timestamp
This gives the analyst the information required to investigate the change without
manually checking the source.
How Can Businesses Turn Price Records Into Market Insights?
Pharma price intelligence API for India market analysis can convert repeated pricing
observations into historical benchmarks.
The difference between price data and price intelligence is context.
A dataset may show that a medicine moved from ₹220 to ₹205.
An intelligence system can additionally answer:
- Did other sellers make the same change?
- Was the MRP changed?
- Did the discount change?
- Did availability change?
- Was the change isolated to one location?
- Did competing products also change price?
- How long did the previous price remain active?
Real Market Growth Data
ICRA projected India's pharmaceutical sector revenue growth of 7–9% for FY26, with
domestic-market growth of 8–10%.
| Indicator |
FY26 Projection |
| Indian pharmaceutical sector revenue growth |
7–9% |
| Domestic pharmaceutical market growth |
8–10% |
| European pharmaceutical revenue growth |
10–12% |
| Indian R&D investment |
6–7% of revenue |
*Source: ICRA outlook reported by IBEF. *
A market-analysis API can use historical observations to calculate:
Price Gap
Competitor Price − Client Price
Price Gap %
((Competitor Price − Client Price) / Client Price) × 100
Discount %
((MRP − Selling Price) / MRP) × 100
These calculations should only be applied when the compared products and price
definitions are equivalent.
Practical Use Case
A pharmaceutical company can monitor 1,000 priority SKUs across several online
channels.
The system can group products by:
- Therapy area
- Brand
- Generic composition
- Manufacturer
- Pack size
- Seller
- Geography
The resulting dataset can reveal which categories experience frequent price changes
and which products maintain relatively stable pricing.
This is more useful than simply downloading a list of current prices.
How Can Aggregators Build Large-Scale Pharmaceutical Datasets?
Pharma Data Scraping for B2B &
Aggregators can support organizations that need large
volumes of structured product, pricing, inventory, seller, and catalog information.
B2B distributors, pharmacy aggregators, market researchers, procurement platforms,
and pharmaceutical analytics companies may need thousands or millions of records.
The challenge is not only collection volume. Data consistency becomes equally
important.
India's Pharmaceutical Scale
India exported pharmaceutical products worth more than US$31 billion in FY26,
according to IBEF. The sector's major export categories include generic formulations, bulk
drugs, vaccines, and biosimilars.
| Indicator |
Reported Value |
Period |
| Pharmaceutical exports |
>US$31 billion |
FY26 |
| Domestic pharmaceutical market |
US$60 billion |
FY26 |
| Domestic pharmaceutical market |
₹5.30 lakh crore |
FY26 |
| Projected domestic market |
US$130 billion |
2030 |
| Jan Aushadhi Kendras |
16,912 |
30 June 2025 |
| Medicines offered through Jan Aushadhi |
2,110 |
30 June 2025 |
*Source: IBEF and Government-reported data. *
The Jan Aushadhi figures also demonstrate the breadth of India's
medicine-distribution ecosystem. IBEF reports 16,912 operational Jan Aushadhi Kendras as of June
30, 2025, with a target of 25,000 by March 2027.
B2B Data Architecture
A scalable pharmaceutical data pipeline can include:
1. Source discovery
2. Product extraction
3. SKU matching
4. Price normalization
5. Inventory extraction
6. Seller identification
7. Data validation
8. Duplicate removal
9. Historical storage
10. API delivery
For aggregators, product matching is particularly important. The same medicine can
appear with different naming conventions across sources.
A normalization layer can standardize:
Brand + composition + strength + dosage form + pack size
before records are compared.
What Changed in Pharmaceutical Pricing and Data Monitoring From 2020 to 2026?
From 2020 to 2026, India's pharmaceutical industry expanded in scale while its data
requirements became increasingly complex. In the early part of this period, many pricing teams
relied on spreadsheets, periodic market reports, distributor inputs, and manual product checks.
Digital healthcare adoption and the growth of online medicine discovery increased the number of
digital touchpoints from which market information could be collected. India's pharmaceutical
sector also strengthened its manufacturing and export position, with the country described by
the Government as the world's third-largest pharmaceutical producer by volume and a major global
supplier of generic medicines. By FY25, pharmaceutical exports reached US$30.47 billion,
according to IBEF, while FY26 exports surpassed US$31 billion. The domestic market was valued at
approximately US$60 billion in FY26. Regulatory price monitoring also remained active. NPPA's
2026 records include new retail-price decisions, draft price-calculation sheets, and other
pricing-related orders under the DPCO framework. At the same time, pharmaceutical companies and
data teams increasingly have access to automated extraction, APIs, cloud databases, dashboards,
and AI-assisted analytics. These changes make historical, structured, machine-readable pricing
data more valuable. Instead of checking individual medicine prices periodically, organizations
can establish recurring collection systems that capture product identity, pricing, availability,
seller, and timestamp information. This creates a foundation for competitive benchmarking,
procurement analysis, inventory monitoring, market research, and pricing intelligence.
How Can Actowiz Solutions Help?
Actowiz Solutions can develop customized pharmaceutical data collection workflows
based on a company's products, sources, geography, required fields, and refresh frequency.
The Real-Time Pharma Product Pricing API India 2026 approach can be structured
around automated collection, product matching, price normalization, validation, historical
storage, and API delivery.
A typical solution can capture:
- Product name
- Brand
- Generic composition
- Manufacturer
- Strength
- Dosage form
- Pack size
- MRP
- Selling price
- Discount
- Availability
- Seller
- Product URL
- Timestamp
- Location where available
The exact fields depend on the source and publicly accessible information.
What Does the Data Workflow Look Like?
| Stage |
Function |
| Source Identification |
Identify relevant public data sources |
| Extraction |
Collect product and pricing records |
| Parsing |
Convert source information into structured fields |
| Normalization |
Standardize product and price values |
| SKU Matching |
Match equivalent products |
| Validation |
Identify incomplete or inconsistent records |
| Historical Storage |
Preserve dated snapshots |
| Analytics |
Calculate price and availability metrics |
| API Delivery |
Provide structured records to applications |
Actowiz Solutions can also support Drug Sentiment Analysis
Using Web Scraping by
collecting publicly accessible reviews, ratings, comments, and other relevant textual signals
where legally and technically accessible.
For example, public feedback can be categorized around:
- Product experience
- Delivery
- Packaging
- Availability
- Seller service
- Price perception
Such analysis should not be interpreted as clinical evidence or as a substitute for
medical or regulatory evaluation. It is primarily a market and consumer-intelligence layer.
How Should Businesses Use Real-Time Pricing Data Responsibly?
Pharmaceutical pricing data requires careful interpretation.
Businesses should avoid comparing products solely by name. Product identity should
be validated using composition, strength, dosage form, pack size, and other relevant attributes.
They should also distinguish:
- MRP from selling price
- Discount from permanent price reduction
- Temporary stock-out from product discontinuation
- One seller's offer from market-wide pricing
- Online price from offline retail price
Regulatory pricing information should also be sourced from authoritative government
channels. NPPA's Pharma Sahi Daam service provides consumers with access to prices of scheduled
and non-scheduled medicines and enables complaints regarding potential overpricing.
For commercial intelligence, third-party marketplace or pharmacy data should
therefore complement rather than replace official regulatory information.
Conclusion
Faster pharmaceutical price tracking requires more than collecting today's prices.
Businesses need product-level identification, pack-size normalization, inventory signals,
competitor comparisons, historical snapshots, and reliable delivery into their analytical
systems.
The Real-Time Pharma Product Pricing API India 2026 model can provide that
foundation by transforming frequently changing pharmaceutical marketplace information into
structured, machine-readable data.
For pharmaceutical manufacturers, distributors, B2B aggregators, online pharmacies,
researchers, and pricing teams, this approach can support competitive benchmarking, price-change
detection, inventory visibility, and market analysis.
Actowiz Solutions can build customized data workflows around specific pharmaceutical
sources, products, fields, and refresh requirements.
Web scraping API, Custom
Datasets, and instant data scraper solutions can be combined
with automated validation, historical storage, and structured delivery to support large-scale
pharmaceutical intelligence projects.
You can also reach us for all your mobile app
scraping, data collection, web scraping, and instant data scraper service requirements!

 Pricing & Promotions
MAP Violations Brand Protection Counterfeit Detection Price Intelligence AI HOT Data Intelligence
Pricing & Promotions
MAP Violations Brand Protection Counterfeit Detection Price Intelligence AI HOT Data Intelligence Brand & Intelligence
Share of Search Content Audit & PDP Reviews & Ratings Retail Media Buy Box Monitoring Social Commerce HOT Live Commerce NEW Agentic Commerce NEW
Brand & Intelligence
Share of Search Content Audit & PDP Reviews & Ratings Retail Media Buy Box Monitoring Social Commerce HOT Live Commerce NEW Agentic Commerce NEW Digital Shelf & Search
Assortment Planning Competitive Benchmarking Product Availability Q-Commerce NEW
Digital Shelf & Search
Assortment Planning Competitive Benchmarking Product Availability Q-Commerce NEW AssortmentE-commerce Intelligence Hyperlocal Insights POI & Store Locator DTC Brand Analytics NEW
 For Retailers
 E-Commerce Dashboard
 Flipkart Insights (Live) #1
 Grocery Intelligence
.svg) Grocery Price (U.S.)
Grocery Price (U.S.)
.svg) Quick Commerce (India) HOT
Quick Commerce (India) HOT
 Food & Restaurant
 Fashion Intelligence
 Automotive
 Travel & Hospitality
 Real Estate
 Food Delivery Intelligence NEW
 OTT & Streaming NEW
 By Use Case
 Pricing Intelligence
 Digital Shelf Analytics
 MAP Monitoring HOT
 Cross-Border Price Parity NEW
 Share of Search
 Review Sentiment
 Kitchen Market Gaps NEW
 Dynamic Pricing / AI Repricing NEW
 Promotions & Deals Alerts NEW
 B2B / POI & Lead Data NEW
 By Region🇮🇳 India 🇺🇸 USA 🇦🇪 Middle East 🇬🇧 UK 🇦🇺 Australia 🌏 SE Asia 🇪🇺 Europe 🌎 LATAMIndia
 Flipkart Real-Time Insights
 Quick Commerce — Zepto · Blinkit
 Pincode Price Tracker
Middle East
Pincode Price Tracker
Middle East GCC Q-Commerce — Talabat · Noon NEW
UK & Australia
GCC Q-Commerce — Talabat · Noon NEW
UK & Australia UK Grocery — Tesco, Sainsbury's, Asda
 AU Grocery — Coles & Woolworths NEW
 Marketplace Scrapers
Amazon API TikTok Shop API HOT Uber Eats API Airbnb API Zepto / Blinkit API Instacart API NEW Talabat API NEW
Marketplace Scrapers
Amazon API TikTok Shop API HOT Uber Eats API Airbnb API Zepto / Blinkit API Instacart API NEW Talabat API NEW Developer APIsWeb Extract API Reviews API SERP API Pricing Webhook NEW
 Universal APIsStreaming Crawl API Scheduler Realtime Alerts Webhook Delivery 🐍 Python SDK 💚 Node.js SDK
 Delivery & SDKs
 Knowledge Center
Digital Shelf Playbook MAP Compliance Guide Pricing Intel Guide Scraping Compliance TikTok Shop Guide NEW Cross-Border Guide NEW
Knowledge Center
Digital Shelf Playbook MAP Compliance Guide Pricing Intel Guide Scraping Compliance TikTok Shop Guide NEW Cross-Border Guide NEW Guides & Playbooks
🎉 Seasonal & event tracking NEWBlack Friday pricing report Festive season, India Ramadan, GCC grocery All seasonal reportsSample Datasets HOT ROI Calculator NEW API Postman Collection Demo Dashboards Free API Playground NEW Press Kit
Guides & Playbooks
🎉 Seasonal & event tracking NEWBlack Friday pricing report Festive season, India Ramadan, GCC grocery All seasonal reportsSample Datasets HOT ROI Calculator NEW API Postman Collection Demo Dashboards Free API Playground NEW Press Kit Downloads & Tools
Trust Center About Us FAQs Careers
Downloads & Tools
Trust Center About Us FAQs Careers Trust & CompanyRetail shelf research NEWRetail shelf research






































 4.8/5 Average Rating
 50+ Video Testimonials
 92% Client Retention
 50+ Countries Served