Introduction
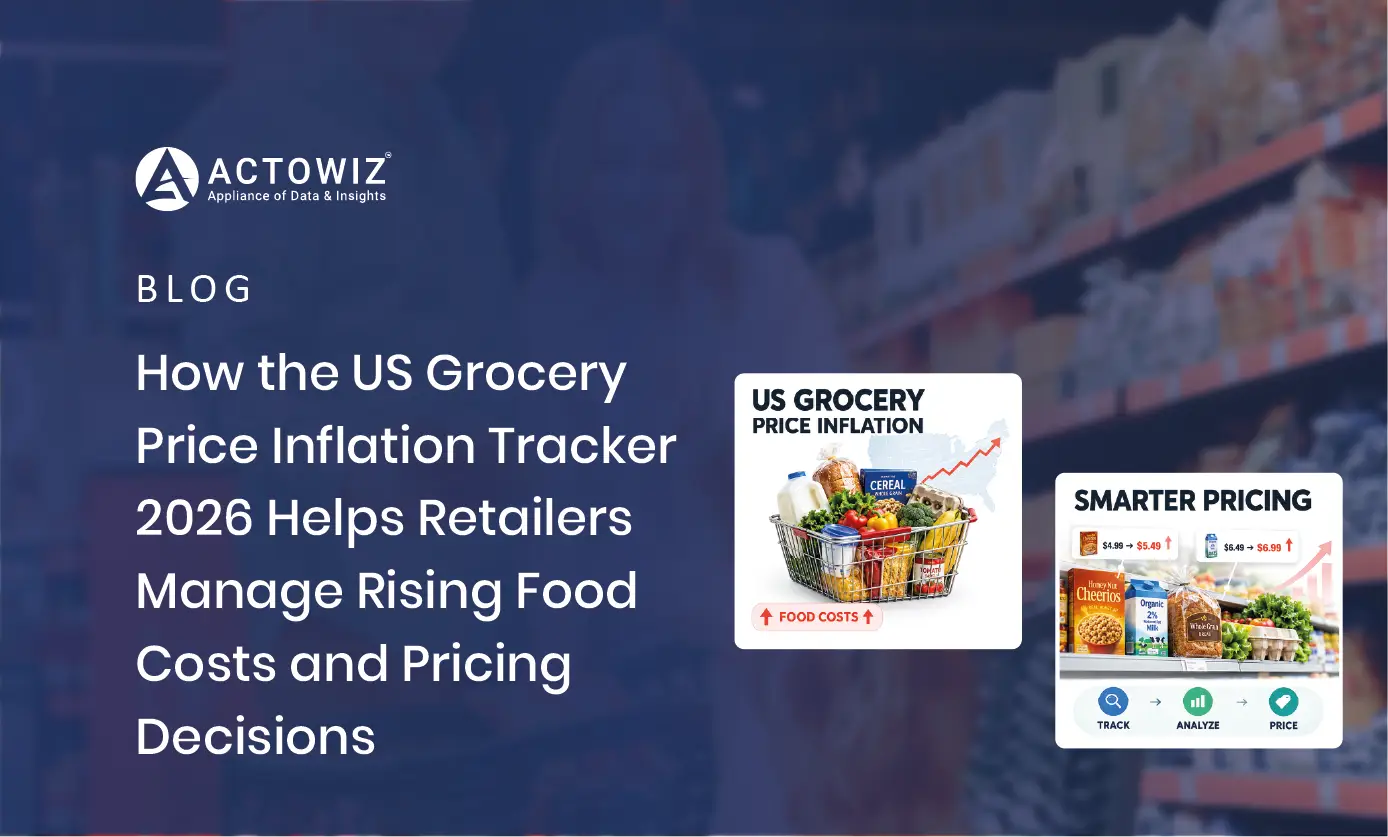
US Grocery Price Inflation Tracker 2026 helps retailers, CPG brands, grocery
suppliers, pricing teams, and market researchers monitor changing food prices, identify
category-level movements, benchmark competitors, and make more informed pricing decisions. In
August 2026, U.S. food-at-home prices were 2.2% higher than a year earlier, while USDA forecasts
average food-at-home prices to rise 2.5% across 2026. (Economic Research Service)
The core challenge is not simply that grocery prices change. It is understanding
which products are changing, how quickly prices are moving, which competitors are moving with
them, and whether a change is temporary or persistent.
For retailers and brands, Grocery Data Scraping
Services can bring together product,
category, retailer, location, price, promotion, availability, and timestamp information into a
structured grocery pricing dataset. This allows teams to move from occasional manual price
checks toward repeatable market intelligence.
USDA data also shows why category-level analysis matters. In July 2026, food-at-home
prices were 2.7% above July 2025, but individual categories behaved differently. Beef and veal
were 9.4% higher year over year, while other categories experienced considerably smaller
movements. (Economic Research Service)
Why Do Grocery Businesses Need Better Inflation Visibility?
Grocery inflation affects more than the final shelf price. It can influence margins,
promotional planning, assortment decisions, supplier negotiations, consumer pricing, and
competitive positioning.
A retailer may see a product become more expensive because of supplier costs, while
a competitor may temporarily absorb some of that increase. Without competitor-level
observations, a pricing team may not know whether its price movement reflects the broader market
or creates a new competitive gap.
What does grocery inflation monitoring need to capture?
| Data point |
Pricing relevance |
| Product name |
Identifies the monitored item |
| Brand |
Enables brand-level analysis |
| Category |
Supports category benchmarking |
| Pack size |
Prevents misleading price comparisons |
| Current price |
Measures present shelf pricing |
| Previous price |
Identifies price movement |
| Unit price |
Enables normalized comparison |
| Promotion |
Separates regular and promotional pricing |
| Availability |
Adds inventory context |
| Retailer |
Enables competitive benchmarking |
| Location |
Supports regional analysis |
| Timestamp |
Establishes when data was observed |
USDA notes that retail food prices reflect not only farm-level commodity prices but
also processing and retailing costs. This makes shelf-level monitoring important for businesses
attempting to understand the final consumer price environment. (Economic Research Service)
What Can Retailers Learn From Inflation Monitoring?
USA Grocery Price Inflation Monitoring provides retailers with a structured way to
track how prices change across products, categories, competitors, and locations.
Rather than looking only at a national inflation percentage, pricing teams can break
the market into measurable components.
For example, a grocery retailer could monitor:
- 100 priority SKUs
- 20 major product categories
- Selected private-label products
- National-brand equivalents
- Key competitor products
- Promotional prices
- Unit prices
- Regional price differences
- Product availability
- Historical price movements
Which inflation metrics matter most?
| Metric |
What it reveals |
| YoY price change |
Annual movement |
| MoM price change |
Short-term movement |
| Average category price |
Category direction |
| Price gap |
Competitive difference |
| Unit-price change |
Normalized movement |
| Promotion frequency |
Promotional intensity |
| Price volatility |
Stability of pricing |
| Availability rate |
Stock-related context |
| Regional variance |
Geographic differences |
What happened between 2020 and 2026?
The 2020–2026 period demonstrates why historical grocery data matters. In 2020,
changes in consumer purchasing patterns and supply-chain disruptions increased the
importance of
monitoring food-at-home markets. In 2021, businesses faced continuing supply constraints and
changing consumer demand. In 2022, grocery inflation accelerated sharply, with USDA
reporting an
11.4% annual increase in food-at-home prices. In 2023, growth slowed to 5.0%, followed by a
much
smaller 1.2% increase in 2024. Food-at-home prices then increased 2.3% in 2025. (Economic
Research Service) In 2026, the pattern remains uneven rather than uniform. USDA's August
outlook
forecasts food-at-home prices to rise 2.5% for the year, but expects different categories to
behave differently. Beef and veal, fish and seafood, fresh fruits, fresh vegetables,
processed
fruits and vegetables, sugar and sweets, and nonalcoholic beverages are among categories
forecast to grow faster than their 20-year historical averages. (Economic Research Service)
This
historical progression shows why retailers benefit from tracking both broad inflation and
individual product-level movements.
How Can Real-Time Data Improve Pricing Decisions?
Real-Time US Grocery Price Inflation Intelligence allows businesses to supplement
official inflation statistics with more granular digital shelf observations.
Government inflation statistics provide essential macroeconomic context, but
individual businesses often need a much more detailed view. They may need to know whether a
particular brand increased its price, whether a competitor changed a promotion, or whether a
product became unavailable in a particular market.
A continuously updated commercial dataset can provide that additional layer.
What can real-time monitoring reveal?
| Signal |
Business application |
| Price increase |
Identify emerging pricing pressure |
| Price decrease |
Detect competitive movement |
| Promotion launch |
Track retailer strategy |
| Promotion removal |
Identify normalization |
| Product disappearance |
Monitor availability |
| New SKU |
Identify assortment changes |
| Pack-size change |
Improve price normalization |
| Regional difference |
Identify local pricing patterns |
A real-time workflow does not necessarily mean collecting every product every
minute. The appropriate frequency depends on the business use case. High-priority SKUs may
require frequent monitoring, while slower-moving categories may be suitable for daily or weekly
collection.
Why does historical context remain important?
A single price observation can be misleading. Suppose a product is 15% cheaper than
its previous price. Without historical observations, the business cannot immediately determine
whether this is a routine promotion, a clearance event, a permanent repricing, or a temporary
competitive response.
A historical dataset makes these distinctions easier to investigate.
What changed from 2020 to 2026?
Between 2020 and 2026, the need for frequent digital price monitoring increased as
consumers and retailers relied more heavily on online product information. In 2020 and 2021,
businesses faced unusual demand and availability conditions. The sharp food inflation recorded
in 2022 made frequent pricing updates more valuable because older observations could quickly
become outdated. In 2023 and 2024, inflation slowed but category-level differences remained
important. By 2025, food-at-home prices were rising 2.3% annually, while some individual
categories experienced significantly different movements. (Economic Research Service) In 2026,
BLS data for August showed food-at-home prices up 2.2% year over year, with nonalcoholic
beverages up 3.7% and fruits and vegetables up 3.2%. (Bureau of Labor Statistics) This
reinforces the value of granular monitoring: an overall grocery inflation figure cannot fully
explain what is happening to individual products or categories.
How Should Supermarkets Track Price Changes?
US Supermarket Price Inflation Tracking should combine macroeconomic benchmarks with
retailer-level product observations.
For a supermarket pricing team, the goal is not merely to know that grocery
inflation is 2% or 3%. The more useful question is: Which products require attention because
their competitive position has changed?
A structured monitoring program can rank products by:
- Percentage price movement
- Absolute price movement
- Competitive price gap
- Promotional frequency
- Historical volatility
- Category inflation
- Regional variance
- Availability changes
Example monitoring framework
| Product group |
Monitoring frequency |
Primary metric |
| High-volume SKUs |
Daily |
Price gap |
| Promotional products |
Daily |
Promotion movement |
| Fresh products |
Daily/weekly |
Price volatility |
| Private label |
Weekly |
Competitive gap |
| National brands |
Daily/weekly |
Price index |
| Long-tail assortment |
Weekly/monthly |
Availability |
| Seasonal products |
Weekly |
Price trend |
Retailers can also create category-specific thresholds. For instance, a pricing team
might flag products when the competitive price gap exceeds a defined percentage or when a
competitor changes price multiple times within a specified period.
What does 2026 data indicate?
BLS reported that food-at-home prices were unchanged from July to August 2026 but
were 2.2% higher than August 2025. Within the grocery basket, fruits and vegetables were 3.2%
higher year over year, nonalcoholic beverages were 3.7% higher, and cereals and bakery products
were 2.6% higher. (Bureau of Labor Statistics) These differences demonstrate why a single
supermarket inflation number is insufficient for detailed pricing decisions. A retailer managing
beverages, bakery products, produce, dairy, and meat needs category-specific observations to
understand where its pricing position is changing.
How did monitoring evolve from 2020 to 2026?
In 2020, many grocery pricing exercises depended on periodic manual collection and
spreadsheet comparisons. As online grocery visibility expanded in 2021, retailers and brands
gained access to larger volumes of digital product information. The 2022 inflation surge made
outdated price snapshots more problematic because prices could move rapidly. During 2023 and
2024, the slowdown in aggregate inflation shifted attention toward category-level differences,
promotional activity, and competitive positioning. By 2025 and 2026, structured datasets became
increasingly useful for connecting historical pricing observations with current market signals.
The result is a transition from simply recording prices to building historical price
intelligence. Businesses can now organize product-level observations by retailer, location,
category, pack size, promotion, and timestamp, enabling more precise analysis than broad
inflation statistics alone.
Which Grocery Price Trends Should Businesses Analyze?
US Grocery Price Trends and Inflation Data should be evaluated at both macro and
micro levels.
Macro data can show the overall direction of food prices. Micro-level data can
explain what is happening within individual categories, brands, products, and retailers.
USDA's Food Price Outlook uses BLS CPI and PPI information to produce food price
forecasts, making it a useful macroeconomic reference for businesses. (Economic Research
Service)
Which trends deserve attention?
| Trend |
Why it matters |
| Year-over-year inflation |
Long-term direction |
| Month-over-month change |
Short-term movement |
| Category divergence |
Identifies pressure points |
| Brand price changes |
Supports competitive analysis |
| Private-label pricing |
Tracks value positioning |
| Promotional changes |
Measures retailer activity |
| Unit-price movement |
Controls for pack-size differences |
| Geographic variance |
Identifies local differences |
Why should businesses separate price and inflation signals?
Inflation is a market-level measurement. A price change is a product-level
observation.
These two concepts should not be treated as interchangeable.
For example, if overall food-at-home inflation is 2.2%, that does not mean every
grocery product increased exactly 2.2%. BLS's August 2026 data illustrates this clearly: fruits
and vegetables were up 3.2% year over year, nonalcoholic beverages were up 3.7%, dairy and
related products were down 0.3%, and meats, poultry, fish, and eggs were up 1.1%. (Bureau of
Labor Statistics)
What does 2020–2026 reveal?
From 2020 through 2026, aggregate food inflation and individual product prices
repeatedly moved at different rates. The major inflation acceleration in 2022 was followed by
slower growth in 2023 and 2024, while 2025 brought renewed food-at-home price growth of 2.3%.
(Economic Research Service) In 2026, USDA forecasts food-at-home prices to rise 2.5%, but its
category outlook identifies both faster-growing and slower-growing categories. (Economic
Research Service) This means a retailer cannot rely solely on a national inflation assumption
when determining product-level prices. Historical datasets can reveal whether a specific SKU is
moving with its category, moving faster than its category, or behaving differently from
competing products. Combining official inflation statistics with granular retailer observations
creates a more complete analytical framework.
How Can Retailers Extract Actionable Pricing Insights?
Pricing Insights from
Leading US Retailer datasets can help businesses compare how
major retailers respond to changing market conditions.
Retailer-level monitoring can examine:
- Average price by category
- Price gaps between retailers
- Promotional frequency
- Private-label versus branded pricing
- Pack-size differences
- Product availability
- Regional pricing
- Price-change frequency
- Historical price movements
The objective is not to copy a competitor's price automatically. Instead, the data
provides evidence that pricing teams can evaluate alongside costs, margins, demand, inventory,
and commercial strategy.
What can a retailer benchmark?
| Benchmark |
Example question |
| Brand price |
How does our branded SKU compare? |
| Unit price |
Is the apparent price gap real? |
| Promotion |
Is a competitor discounting? |
| Category average |
Are we above or below the market? |
| Private label |
How strong is value competition? |
| Geography |
Does the gap vary by location? |
| Historical price |
Is this movement unusual? |
Why is historical data important?
A retailer may observe a competitor lowering a product's price by 8%. Without
historical data, it is difficult to know whether this is an isolated promotion or part of a
longer pricing strategy.
A historical database can show:
Previous price → promotion → promotional end → new regular price → subsequent
adjustment
That sequence is much more useful than a single snapshot.
How has the opportunity changed since 2020?
The 2020–2026 period has created a larger need for retailer-level price
intelligence. In 2020, exceptional grocery demand made availability and pricing difficult to
interpret. In 2021, digital shopping continued expanding. In 2022, inflation reached a level
that made frequent price observation especially valuable. USDA recorded an 11.4% annual increase
in food-at-home prices that year. (Economic Research Service) The following years brought
progressively slower aggregate inflation, but product categories continued to diverge. In 2025,
food-at-home inflation was 2.3%, below its 20-year historical average of 2.6%. (Economic
Research Service) In 2026, official data still shows differences between categories, meaning
competitive intelligence needs to preserve product and category context. Businesses that
maintain historical retailer-level datasets can therefore analyze price changes against both
competitors and broader market conditions.
How Does Inflation Affect Grocery Pricing?
Inflation Effects
on Grocery Prices can appear through higher shelf
prices, changing
promotions, assortment adjustments, pack-size changes, private-label competition, and different
pricing responses between retailers.
Inflation does not affect every product equally.
According to USDA's August 2026 Food Price Outlook, seven of the 15 food-at-home
categories examined were forecast to grow faster than their 20-year historical average. These
included beef and veal, fish and seafood, fresh fruits, fresh vegetables, processed fruits and
vegetables, sugar and sweets, and nonalcoholic beverages. (Economic Research Service)
Which categories showed notable movements?
| Category |
August 2026 YoY movement |
| Food at home |
+2.2% |
| Fruits & vegetables |
+3.2% |
| Nonalcoholic beverages |
+3.7% |
| Cereals & bakery products |
+2.6% |
| Meats, poultry, fish & eggs |
+1.1% |
| Dairy & related products |
-0.3% |
| Food away from home |
+3.4% |
Source: U.S. Bureau of Labor Statistics, August 2026 CPI. (Bureau of Labor
Statistics)
This variation means retailers should avoid applying a uniform pricing response
across every category.
What should pricing teams monitor?
Cost pressure: Determine whether supplier or market conditions are changing.
Competitive movement: Identify whether competitors are changing prices
simultaneously.
Consumer sensitivity: Identify products where price changes may influence demand.
Promotion behavior: Separate temporary discounts from permanent price changes.
Unit economics: Compare price changes with pack sizes and units.
Historical patterns: Determine whether the movement is unusual.
What changed between 2020 and 2026?
The six-year period shows how rapidly grocery pricing conditions can change. In
2020, the market faced pandemic-related disruptions and significant shifts in food-at-home
purchasing. In 2021, supply constraints and demand changes remained important. In 2022,
food-at-home inflation reached 11.4%, creating an unusually strong pricing environment.
(Economic Research Service) Growth then moderated to 5.0% in 2023 and 1.2% in 2024. Food-at-home
prices increased 2.3% in 2025, before USDA forecast a 2.5% increase for 2026. (Economic Research
Service) The key lesson is that inflation moves in cycles and categories do not always follow
the same path. A pricing intelligence program should therefore preserve historical observations
instead of relying exclusively on the latest monthly inflation percentage.
How Can Actowiz Solutions Help?
Actowiz Solutions can help retailers, CPG brands, grocery suppliers, market research
companies, and pricing teams build customized grocery intelligence workflows.
The US Grocery Price Inflation Tracker 2026 can be designed around the client's
target retailers, categories, products, locations, competitive set, collection frequency, and
required output format.
What can the workflow include?
Product Discovery
Define the product universe, priority categories, brands, SKUs, and competitor
products that need monitoring.
Data Collection
Collect permitted product information from selected public digital sources according
to the client's scope and applicable requirements.
Data Normalization
Standardize product names, brands, categories, pack sizes, prices, units, and other
attributes so records can be compared consistently.
Data Validation
Apply quality checks to identify missing values, duplicates, unexpected price
movements, and inconsistent product records.
Historical Storage
Maintain timestamped observations so businesses can compare current prices against
historical values.
Analytics Delivery
Deliver structured datasets for spreadsheets, databases, dashboards, APIs, or other
analytics workflows.
Which data fields can be captured?
| Dataset component |
Example fields |
| Product |
Name, SKU, brand |
| Category |
Department, category, subcategory |
| Price |
Current, previous, unit price |
| Promotion |
Discount, sale status |
| Pack |
Weight, quantity, size |
| Availability |
In stock, unavailable |
| Retailer |
Retailer name |
| Location |
Store, ZIP, region |
| Digital |
URL, timestamp |
| Historical |
Previous observations |
Actowiz Solutions can also tailor monitoring frequency according to the commercial
use case. High-priority products can be monitored more frequently, while lower-priority products
can follow a less intensive schedule.
The objective is to convert fragmented grocery pricing information into a structured
intelligence layer that pricing, merchandising, category, marketing, and strategy teams can use.
How Can Businesses Build a More Actionable Grocery Pricing Program?
A useful inflation monitoring system should connect data collection → normalization
→ comparison → historical analysis → alerts → business decisions.
Recommended implementation framework
Step 1: Define the competitive universe
Select retailers, categories, brands, SKUs, locations, and product attributes.
Step 2: Establish the baseline
Capture an initial dataset to establish current pricing and assortment conditions.
Step 3: Normalize products
Match equivalent products using brand, product type, pack size, and other relevant
attributes.
Step 4: Track changes
Capture price, promotion, availability, and assortment changes at scheduled
intervals.
Step 5: Build historical benchmarks
Store timestamped observations to calculate price movement and volatility.
Step 6: Create exception rules
Flag significant price gaps, unusual movements, availability changes, or promotion
events.
Step 7: Connect the dataset to decision-making
Make the resulting information available to pricing, merchandising, category
management, and strategy teams.
This approach prevents grocery inflation monitoring from becoming simply another
reporting exercise. The goal is to create a repeatable information system that helps teams
understand what is changing and where attention may be required.
Conclusion
Grocery pricing decisions require more than a single inflation percentage. In August
2026, U.S. food-at-home prices were 2.2% higher than a year earlier, while USDA's annual 2026
forecast calls for a 2.5% increase. At the same time, individual categories showed substantially
different movements. (Economic Research Service)
A structured US Grocery Price Inflation Tracker 2026 can help retailers and brands
connect these market-level signals with product-level observations. Historical prices,
competitor movements, promotions, product availability, pack sizes, and regional differences can
provide a more complete picture of grocery pricing conditions.
Actowiz Solutions can support this process through Web Scraping, Mobile App
Scraping, and a Real-time dataset tailored to the client's products, retailers, locations, and
monitoring requirements.
The result is a scalable data foundation for competitive pricing, category
intelligence, assortment analysis, and market research.
Ready to turn grocery price movements into actionable pricing intelligence? Contact
Actowiz Solutions to build a customized grocery data monitoring solution for your business!
You can also reach us for all your mobile app
scraping, data collection, web scraping , and instant data scraper service requirements!

 Pricing & Promotions
MAP Violations Brand Protection Counterfeit Detection Price Intelligence AI HOT Data Intelligence
Pricing & Promotions
MAP Violations Brand Protection Counterfeit Detection Price Intelligence AI HOT Data Intelligence Brand & Intelligence
Share of Search Content Audit & PDP Reviews & Ratings Retail Media Buy Box Monitoring Social Commerce HOT Live Commerce NEW Agentic Commerce NEW
Brand & Intelligence
Share of Search Content Audit & PDP Reviews & Ratings Retail Media Buy Box Monitoring Social Commerce HOT Live Commerce NEW Agentic Commerce NEW Digital Shelf & Search
Assortment Planning Competitive Benchmarking Product Availability Q-Commerce NEW
Digital Shelf & Search
Assortment Planning Competitive Benchmarking Product Availability Q-Commerce NEW AssortmentE-commerce Intelligence Hyperlocal Insights POI & Store Locator DTC Brand Analytics NEW
 For Retailers
 E-Commerce Dashboard
 Flipkart Insights (Live) #1
 Grocery Intelligence
.svg) Grocery Price (U.S.)
Grocery Price (U.S.)
.svg) Quick Commerce (India) HOT
Quick Commerce (India) HOT
 Food & Restaurant
 Fashion Intelligence
 Automotive
 Travel & Hospitality
 Real Estate
 Food Delivery Intelligence NEW
 OTT & Streaming NEW
 By Use Case
 Pricing Intelligence
 Digital Shelf Analytics
 MAP Monitoring HOT
 Cross-Border Price Parity NEW
 Share of Search
 Review Sentiment
 Kitchen Market Gaps NEW
 Dynamic Pricing / AI Repricing NEW
 Promotions & Deals Alerts NEW
 B2B / POI & Lead Data NEW
 By Region🇮🇳 India 🇺🇸 USA 🇦🇪 Middle East 🇬🇧 UK 🇦🇺 Australia 🌏 SE Asia 🇪🇺 Europe 🌎 LATAMIndia
 Flipkart Real-Time Insights
 Quick Commerce — Zepto · Blinkit
 Pincode Price Tracker
Middle East
Pincode Price Tracker
Middle East GCC Q-Commerce — Talabat · Noon NEW
UK & Australia
GCC Q-Commerce — Talabat · Noon NEW
UK & Australia UK Grocery — Tesco, Sainsbury's, Asda
 AU Grocery — Coles & Woolworths NEW
 Marketplace Scrapers
Amazon API TikTok Shop API HOT Uber Eats API Airbnb API Zepto / Blinkit API Instacart API NEW Talabat API NEW
Marketplace Scrapers
Amazon API TikTok Shop API HOT Uber Eats API Airbnb API Zepto / Blinkit API Instacart API NEW Talabat API NEW Developer APIsWeb Extract API Reviews API SERP API Pricing Webhook NEW
 Universal APIsStreaming Crawl API Scheduler Realtime Alerts Webhook Delivery 🐍 Python SDK 💚 Node.js SDK
 Delivery & SDKs
 Knowledge Center
Digital Shelf Playbook MAP Compliance Guide Pricing Intel Guide Scraping Compliance TikTok Shop Guide NEW Cross-Border Guide NEW
Knowledge Center
Digital Shelf Playbook MAP Compliance Guide Pricing Intel Guide Scraping Compliance TikTok Shop Guide NEW Cross-Border Guide NEW Guides & Playbooks
🎉 Seasonal & event tracking NEWBlack Friday pricing report Festive season, India Ramadan, GCC grocery All seasonal reportsSample Datasets HOT ROI Calculator NEW API Postman Collection Demo Dashboards Free API Playground NEW Press Kit
Guides & Playbooks
🎉 Seasonal & event tracking NEWBlack Friday pricing report Festive season, India Ramadan, GCC grocery All seasonal reportsSample Datasets HOT ROI Calculator NEW API Postman Collection Demo Dashboards Free API Playground NEW Press Kit Downloads & Tools
Trust Center About Us FAQs Careers
Downloads & Tools
Trust Center About Us FAQs Careers Trust & CompanyRetail shelf research NEWRetail shelf research






































 4.8/5 Average Rating
 50+ Video Testimonials
 92% Client Retention
 50+ Countries Served