Introduction
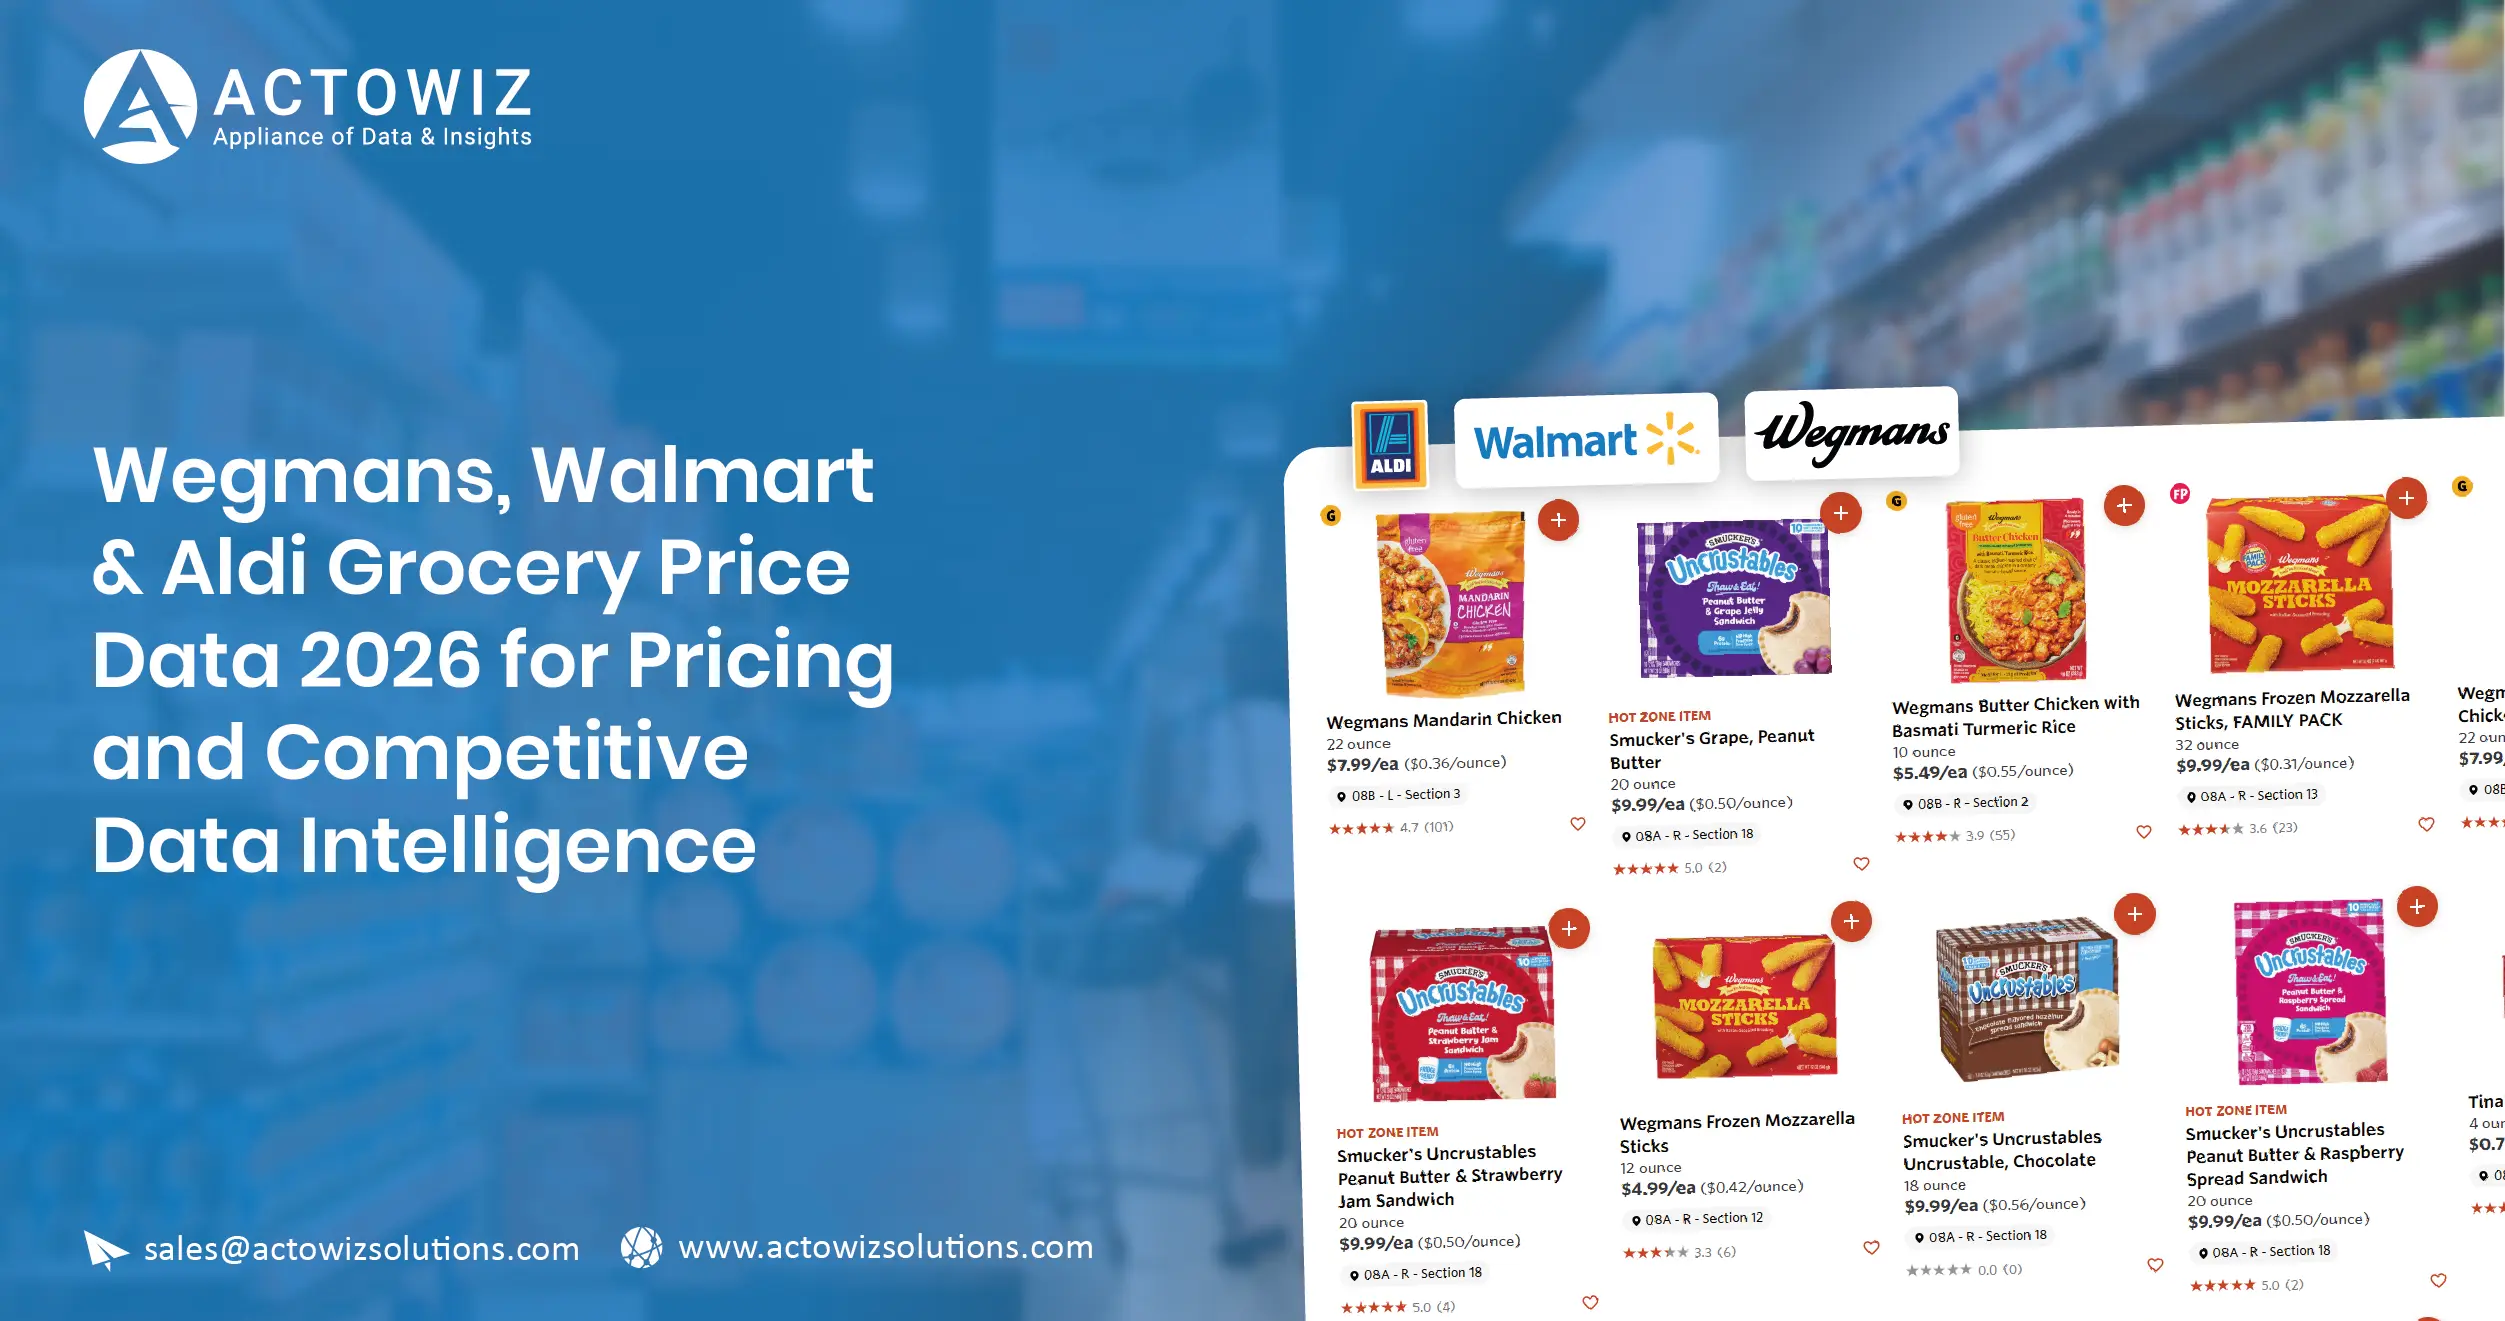
Wegmans, Walmart and Aldi Grocery Price Data 2026 helps grocery brands, retailers, CPG companies, pricing teams, and market researchers understand how product prices, promotions, assortments, and availability change across competing retailers. Instead of relying on occasional manual checks, businesses can collect structured product-level information at scale and use it for price benchmarking, assortment analysis, promotional tracking, and competitive intelligence.
The need for this visibility is increasing. USDA Economic Research Service data shows that U.S. food-at-home prices increased 2.3% in 2025 compared with 2024. In July 2026, food-at-home prices were 2.7% higher than a year earlier, while USDA's August 2026 outlook forecasts a 2.5% increase for food-at-home prices during 2026.
For grocery businesses, the challenge is not simply knowing whether prices are rising. The real challenge is determining where, when, how much, and against which competitors prices are changing.
A structured grocery dataset can connect product names, brands, categories, pack sizes, current prices, previous prices, discounts, promotions, availability, URLs, retailer, geography, and collection timestamps. This gives pricing and commercial teams a consistent foundation for daily decisions.
Why is grocery pricing intelligence becoming more important?
The U.S. food retail environment has become increasingly data-intensive. USDA reports that inflation-adjusted food sales at grocery stores reached approximately $617 billion in 2025, while food sales at warehouse clubs and supercenters reached approximately $289 billion.
At the same time, the competitive landscape represented by the three retailers is changing. Wegmans reported 114 stores across nine states and Washington, D.C., in its 2025 Impact Report. Walmart's fiscal 2026 annual report reported 4,611 retail units in the Walmart U.S. segment at fiscal year-end and a 4.4% increase in Walmart U.S. net sales. ALDI announced plans to open more than 180 stores in 2026 and reach nearly 2,800 U.S. stores by year-end.
These developments create more locations, more products, more competitive signals, and more price observations to monitor.
What does the data reveal?
| Metric |
Latest available reference |
Business relevance |
| U.S. food-at-home inflation, 2025 |
2.3% |
Indicates continuing pricing movement |
| Food-at-home year-over-year inflation, July 2026 |
2.7% |
Shows current pricing pressure |
| 2026 food-at-home forecast |
2.5% |
Supports forward-looking planning |
| Grocery-store food sales, 2025 |
$617B inflation-adjusted |
Demonstrates market scale |
| Walmart U.S. retail units, FY2026 |
4,611 |
Highlights monitoring scale |
| Wegmans stores |
114 |
Provides regional competitive coverage |
| ALDI planned 2026 store count |
Nearly 2,800 |
Demonstrates expanding coverage |
*Sources: USDA ERS, Walmart FY2026 Annual Report, Wegmans 2025 Impact Report, and ALDI U.S. 2026 announcement. *
What can retailers learn from cross-store price comparison?
A retailer needs more than its own price list to understand its competitive position. Wegmans, Walmart and Aldi Grocery Price Comparison enables teams to compare equivalent or comparable products across multiple retailers and identify differences in shelf price, unit price, promotions, pack size, and availability.
For example, a 12-ounce packaged food product may appear cheaper at one retailer while offering a smaller pack size. Comparing only displayed prices can therefore produce misleading conclusions. A robust dataset should normalize pack sizes and, where possible, calculate unit-level price metrics.
What should a comparison dataset contain?
| Data field |
Example use |
| Product name |
Product matching |
| Brand |
Brand-level benchmarking |
| Category |
Category comparison |
| Pack size |
Unit-price normalization |
| Current price |
Competitive pricing |
| Original price |
Discount calculation |
| Promotion |
Promotional analysis |
| Availability |
Stock monitoring |
| Product URL |
Verification |
| Retailer |
Competitor segmentation |
| Location/ZIP |
Regional comparison |
| Timestamp |
Historical tracking |
How did the market evolve from 2020 to 2026?
From 2020 onward, grocery pricing intelligence moved from periodic competitive checks toward more continuous digital monitoring. The pandemic accelerated online grocery adoption and increased the importance of digital product visibility. In 2021, supply-chain constraints and changing shopping patterns made product availability and price changes more difficult to interpret. In 2022, broader inflationary pressures pushed food-at-home prices substantially higher, with USDA reporting an 11.4% increase in food-at-home prices that year. In 2023, food-at-home price growth slowed to 5.0%, while 2024 brought another slowdown to 1.2%. By 2025, food-at-home prices increased 2.3%, with particularly notable movements in eggs, beef and veal, sugar and sweets, and nonalcoholic beverages. USDA's 2026 outlook forecasts another 2.5% increase for food-at-home prices. This progression illustrates why historical datasets matter: a single price observation cannot explain whether a change is seasonal, promotional, category-specific, retailer-specific, or part of a broader market movement. For pricing teams, maintaining comparable historical observations creates a stronger basis for identifying structural changes and temporary fluctuations.
How can businesses monitor regional price movements?
Geography can materially change grocery pricing. Retailers operate different store networks, encounter different competitive environments, and may adjust assortments or promotions by location. Wegmans, Walmart and Aldi Price Monitoring USA can therefore be structured around ZIP codes, cities, states, metropolitan areas, or selected store locations.
USDA's Food-at-Home Monthly Area Prices dataset itself demonstrates the value of geographic monitoring. The dataset provides monthly price information for 90 food-at-home categories across 15 U.S. geographic areas, with mean unit values and price indexes.
A commercial competitive dataset can complement this broader economic data with retailer-, product-, and location-level observations.
Which regional signals matter?
| Signal |
Why it matters |
| Store location |
Identifies geographic pricing differences |
| ZIP code |
Enables localized monitoring |
| Product availability |
Distinguishes price change from stock issues |
| Promotional frequency |
Measures retailer promotional intensity |
| Unit price |
Enables fair comparison |
| Private-label presence |
Supports assortment analysis |
| Competitor overlap |
Identifies direct competitive pressure |
| Collection time |
Provides temporal context |
What happened between 2020 and 2026?
The 2020–2026 period demonstrates why geographic context should be preserved alongside price data. In 2020, grocery shopping patterns shifted sharply toward food-at-home consumption, creating unusual demand and availability conditions. During 2021 and 2022, transportation, labor, commodity, and supply-chain pressures affected retail prices and product availability across markets. USDA reports that food-at-home prices increased 11.4% in 2022, followed by a 5.0% increase in 2023. In 2024, food-at-home inflation slowed to 1.2%, but individual categories continued to behave differently. In 2025, average food-at-home prices increased 2.3%, while eggs increased 21.9% on average and beef and veal increased 11.6%. By 2026, USDA's July data showed food-at-home prices 2.7% above July 2025, while fresh vegetables were 6.3% higher year over year and sugar and sweets were 7.4% higher. For commercial teams, these differences reinforce the need to monitor categories and locations independently rather than applying a single national pricing assumption.
How can teams build a scalable product-level dataset?
Manual collection becomes difficult when thousands of products must be compared across multiple retailers. Wegmans, Walmart and Aldi Grocery Data Collection provides a structured approach to capturing product information consistently across retailer websites and other permitted digital sources.
A scalable collection workflow can capture product attributes, normalize them into a common schema, validate records, identify duplicates, and deliver the information in analytics-ready formats.
What does a scalable workflow look like?
Discovery → Collection → Extraction → Normalization → Validation → Matching → Historical Storage → Analytics
The workflow can be configured around a retailer's product taxonomy or a client's specific competitive set.
For example, the same product can have different naming conventions across retailers. One retailer may display a brand name first, another may emphasize the product type, while another may use a different pack-size format. Normalization allows these records to be mapped into a consistent structure.
Which metrics can be tracked?
| Metric |
Example output |
| SKU count |
Number of monitored products |
| Price observations |
Current and historical prices |
| Promotion rate |
Products under promotion |
| Availability rate |
In-stock percentage |
| Price variance |
Difference between retailers |
| Unit-price variance |
Normalized comparison |
| Assortment overlap |
Shared products |
| Category coverage |
Monitored categories |
| Update frequency |
Daily/hourly/custom schedule |
How has collection technology changed from 2020 to 2026?
Between 2020 and 2026, grocery data collection increasingly shifted toward automated pipelines capable of handling larger product catalogs and more frequent updates. In 2020, many teams still depended heavily on spreadsheets and manually captured competitor prices. In 2021, growing e-commerce adoption increased the volume of digital product information available for analysis. In 2022, rapid price changes made historical snapshots more valuable because manually updated spreadsheets could become outdated quickly. In 2023 and 2024, automated extraction, product matching, data validation, and scheduled collection became increasingly useful for maintaining consistent competitive datasets. By 2025 and 2026, the challenge is less about obtaining a few prices and more about managing large volumes of product, location, promotion, and availability records. USDA's F-MAP product, for example, maintains monthly data across 90 food groups and 15 geographic areas, illustrating the value of structured longitudinal pricing information. A commercial dataset can extend this principle to specific retailers and SKUs, enabling businesses to combine historical observations with current competitive signals.
What does U.S. competitive pricing intelligence need to measure?
US Grocery Competitive Pricing Intelligence becomes actionable when raw prices are converted into comparable commercial metrics. Pricing teams can use these metrics to identify gaps, monitor competitor movements, evaluate promotions, and support pricing decisions.
A useful competitive intelligence program should answer questions such as:
- Which products are priced differently across retailers?
- Which categories experience the highest price volatility?
- Which competitor frequently changes promotional prices?
- Where are private-label products competing with national brands?
- Which products show persistent price gaps?
- Are price differences caused by pack-size differences?
- Which locations display unusual competitive movements?
- How frequently should each category be monitored?
What should a pricing dashboard contain?
| Dashboard component |
Business question |
| Price index |
How does our price position compare? |
| Price gap |
How large is the difference? |
| Promotion tracker |
Which products are discounted? |
| Historical trend |
Is the movement temporary or persistent? |
| Availability monitor |
Is a price change linked to stock? |
| Category view |
Which categories are moving? |
| Retailer view |
Which competitors changed prices? |
| Geographic view |
Where are differences concentrated? |
What does 2020–2026 tell pricing teams?
The 2020–2026 period shows why competitive pricing cannot be evaluated independently from broader market conditions. In 2020, extraordinary shifts in food-at-home demand changed retailer behavior and purchasing patterns. During 2021 and 2022, inflation and supply-chain pressures created larger price movements, with USDA recording 11.4% food-at-home inflation in 2022. The subsequent slowdown in 2023 and 2024 did not mean that every category moved uniformly. In 2025, average food-at-home inflation was 2.3%, but eggs and beef experienced much larger increases. USDA's 2026 outlook similarly identifies different expected trajectories across categories, forecasting higher growth for several categories while expecting eggs and fats and oils to decline relative to 2025. For commercial teams, this means competitive intelligence should combine retailer-level observations with category context. A 5% price increase can have a very different meaning when the entire category is rising rapidly than when competitors remain flat. Historical competitive datasets help teams make that distinction.
Which product attributes should be included in a 2026 grocery dataset?
US Supermarket Product & Price Data 2026 should go beyond product name and shelf price. A buyer or analyst needs enough context to compare products accurately and explain price changes.
Recommended schema
| Data category |
Key fields |
| Product identity |
Product name, SKU, UPC where available |
| Brand |
Brand, private label/national brand |
| Category |
Department, category, subcategory |
| Pricing |
Current price, previous price, unit price |
| Promotions |
Discount, sale status, promotion text |
| Pack information |
Quantity, weight, size |
| Availability |
In stock, unavailable, limited availability |
| Retailer |
Retailer name, store/location |
| Digital information |
Product URL, collection timestamp |
| Historical information |
Previous observations and price history |
For brands and retailers, this structure enables multiple use cases. Pricing managers can benchmark prices. Category managers can identify assortment gaps. CPG teams can monitor branded products. Market researchers can study category movements. E-commerce teams can track digital shelf conditions.
What historical developments matter?
From 2020 to 2026, product-level data became increasingly useful because grocery competition became more digital, dynamic, and geographically diverse. The 2020 disruption highlighted availability as an important dimension alongside price. In 2021 and 2022, supply and inflation pressures made frequent updates more important. In 2023, slower food-at-home inflation reduced some of the broad pricing pressure but left substantial differences among categories. In 2024, food-at-home inflation fell to 1.2%, according to USDA. In 2025, food-at-home inflation returned to 2.3%, while categories such as eggs and beef showed much larger movements. In 2026, USDA continues to forecast different rates across categories, including 5.9% growth for fresh vegetables and 7.1% for sugar and sweets. This makes a broad grocery dataset more valuable than a simple price list. Businesses need product attributes, category context, retailer information, historical timestamps, and normalized unit measures to interpret competitive changes correctly.
How can automated monitoring reduce manual pricing work?
Walmart Data Scraping Services can support large-scale collection of publicly available product information for organizations that need recurring monitoring across extensive catalogs. The same technical framework can be adapted to competitive datasets involving multiple grocery retailers.
A typical workflow can include:
1. Define the product and category universe.
2. Identify retailer pages and permitted data sources.
3. Collect product-level information.
4. Normalize names, pack sizes, categories, and prices.
5. Validate records and remove duplicates.
6. Match comparable products.
7. Store historical observations.
8. Generate recurring datasets or dashboards.
9. Monitor exceptions and significant price changes.
10. Deliver structured outputs for analytics.
Automation is especially useful when the monitoring scope changes frequently. Walmart's fiscal 2026 annual report shows the scale of its U.S. retail footprint, with 4,611 retail units reported at fiscal year-end. A large footprint combined with extensive product assortment illustrates why manually checking every location and product is operationally difficult.
What should an automated system prioritize?
| Requirement |
Expected benefit |
| Scheduled collection |
Consistent updates |
| Product matching |
Comparable analysis |
| Price normalization |
Fair benchmarking |
| Validation rules |
Better data quality |
| Historical storage |
Trend analysis |
| Location tagging |
Regional insights |
| Availability capture |
Stock-aware interpretation |
| API/data-feed delivery |
Faster analytics integration |
How did automation evolve from 2020 to 2026?
In 2020, manual spreadsheets could still provide useful snapshots for small competitive sets, but rapidly changing shopping conditions made frequent updates difficult. By 2021 and 2022, increased online grocery activity and significant inflation strengthened the case for scheduled data collection. In 2023 and 2024, automation increasingly focused on data quality, product matching, historical storage, and analytics integration rather than simple extraction alone. By 2025 and 2026, large retailer footprints and increasingly digital shopping experiences made scalable monitoring particularly relevant. ALDI announced plans to operate nearly 2,800 U.S. stores by the end of 2026, while Walmart reported 4,611 Walmart U.S. retail units in its fiscal 2026 annual report. These figures demonstrate the potential scale of retailer coverage. Automated systems can help businesses move from occasional competitive checks to repeatable data pipelines, provided collection methods respect applicable website terms, access controls, privacy requirements, and other legal constraints.
How Can Actowiz Solutions Help?
Actowiz Solutions can build customized grocery intelligence workflows around the buyer's product universe, competitor set, geography, update frequency, and analytics requirements.
Scraping Wegmans Grocery Data can be incorporated into a broader retailer-monitoring workflow designed to capture structured product attributes, prices, promotions, availability, categories, pack information, and timestamps where publicly accessible and permitted.
The broader Wegmans, Walmart and Aldi Grocery Price Data 2026 workflow can be configured around selected categories, SKUs, locations, or competitive products rather than requiring businesses to monitor every available product.
What services can be included?
Web Scraping can collect structured information from permitted public web sources and convert product pages into standardized records.
Mobile App Scraping can support permitted collection from digital shopping environments where relevant product information is presented through mobile applications.
A Real-time dataset or high-frequency dataset can be designed for use cases where frequent price and availability changes need closer monitoring. The actual refresh schedule can be customized according to the business requirement and source availability.
What can the final dataset support?
- Competitive price benchmarking
- Promotion monitoring
- Assortment comparison
- Product availability tracking
- Category intelligence
- Regional price analysis
- Private-label benchmarking
- Historical price analysis
- Pricing dashboards
- Market research
- Competitor movement alerts
Actowiz Solutions can also structure the output for analytics platforms, databases, spreadsheets, APIs, or other client workflows. Data validation and normalization can be incorporated so that product records from different retailers can be compared using consistent fields.
The methodology should be aligned with the intended use case. For example, a CPG brand may focus on its own SKUs and direct competitors, while a pricing team may require a broader category-level dataset. A market research organization may prioritize historical observations, whereas an e-commerce team may need more frequent availability and price updates.
What business outcomes can grocery price datasets support?
A structured competitive dataset can transform fragmented online product information into measurable commercial signals.
1. Better price benchmarking
Businesses can compare current and historical prices across selected retailers and identify persistent or temporary differences.
2. More consistent promotion analysis
Teams can track sale prices, discount percentages, promotional messaging, and changes over time.
3. Stronger assortment visibility
Product-level records reveal which brands, pack sizes, categories, and product variants are available across competitors.
4. Faster competitive response
Scheduled monitoring can reduce the delay between a competitor price change and internal awareness.
5. Regional intelligence
Location-specific observations can reveal pricing differences that national averages cannot explain.
6. Historical decision support
A time-series dataset makes it easier to distinguish temporary changes from sustained movements.
USDA's current data reinforces the importance of this distinction. Food-at-home prices were 2.3% higher in 2025 than in 2024, while individual categories such as eggs and beef experienced considerably different rates of change.
Conclusion
Grocery pricing decisions increasingly require granular, timely, and comparable information. U.S. food-at-home prices were 2.3% higher in 2025, and USDA's 2026 outlook forecasts another 2.5% increase, while individual categories continue to move at different rates. Businesses can use Web Scraping, Mobile App Scraping, and a Real-time dataset to capture and analyze changing grocery prices efficiently.
For businesses tracking major grocery retailers, structured product and pricing datasets can provide a clearer view of competitive movements, promotional activity, assortment changes, regional differences, and historical trends.
Retailers, CPG brands, pricing teams, and market researchers can use Scrape Product Data from Aldi workflows alongside broader competitive monitoring to create repeatable intelligence pipelines tailored to their product universe.
Actowiz Solutions can help businesses design scalable data collection, normalization, validation, and delivery workflows for Wegmans, Walmart and Aldi Grocery Price Data 2026, supporting grocery and e-commerce intelligence with structured, actionable datasets.
Need reliable grocery pricing and competitive intelligence data? Contact Actowiz Solutions to discuss your retailer, category, location, frequency, and dataset requirements!
You can also reach us for all your mobile app scraping, data collection, web scraping , and instant data scraper service requirements!

 Pricing & Promotions
MAP Violations Brand Protection Counterfeit Detection Price Intelligence AI HOT Data Intelligence
Pricing & Promotions
MAP Violations Brand Protection Counterfeit Detection Price Intelligence AI HOT Data Intelligence Brand & Intelligence
Share of Search Content Audit & PDP Reviews & Ratings Retail Media Buy Box Monitoring Social Commerce HOT Live Commerce NEW Agentic Commerce NEW
Brand & Intelligence
Share of Search Content Audit & PDP Reviews & Ratings Retail Media Buy Box Monitoring Social Commerce HOT Live Commerce NEW Agentic Commerce NEW Digital Shelf & Search
Assortment Planning Competitive Benchmarking Product Availability Q-Commerce NEW
Digital Shelf & Search
Assortment Planning Competitive Benchmarking Product Availability Q-Commerce NEW AssortmentE-commerce Intelligence Hyperlocal Insights POI & Store Locator DTC Brand Analytics NEW
 For Retailers
 E-Commerce Dashboard
 Flipkart Insights (Live) #1
 Grocery Intelligence
.svg) Grocery Price (U.S.)
Grocery Price (U.S.)
.svg) Quick Commerce (India) HOT
Quick Commerce (India) HOT
 Food & Restaurant
 Fashion Intelligence
 Automotive
 Travel & Hospitality
 Real Estate
 Food Delivery Intelligence NEW
 OTT & Streaming NEW
 By Use Case
 Pricing Intelligence
 Digital Shelf Analytics
 MAP Monitoring HOT
 Cross-Border Price Parity NEW
 Share of Search
 Review Sentiment
 Kitchen Market Gaps NEW
 Dynamic Pricing / AI Repricing NEW
 Promotions & Deals Alerts NEW
 B2B / POI & Lead Data NEW
 By Region🇮🇳 India 🇺🇸 USA 🇦🇪 Middle East 🇬🇧 UK 🇦🇺 Australia 🌏 SE Asia 🇪🇺 Europe 🌎 LATAMIndia
 Flipkart Real-Time Insights
 Quick Commerce — Zepto · Blinkit
 Pincode Price Tracker
Middle East
Pincode Price Tracker
Middle East GCC Q-Commerce — Talabat · Noon NEW
UK & Australia
GCC Q-Commerce — Talabat · Noon NEW
UK & Australia UK Grocery — Tesco, Sainsbury's, Asda
 AU Grocery — Coles & Woolworths NEW
 Marketplace Scrapers
Amazon API TikTok Shop API HOT Uber Eats API Airbnb API Zepto / Blinkit API Instacart API NEW Talabat API NEW
Marketplace Scrapers
Amazon API TikTok Shop API HOT Uber Eats API Airbnb API Zepto / Blinkit API Instacart API NEW Talabat API NEW Developer APIsWeb Extract API Reviews API SERP API Pricing Webhook NEW
 Universal APIsStreaming Crawl API Scheduler Realtime Alerts Webhook Delivery 🐍 Python SDK 💚 Node.js SDK
 Delivery & SDKs
 Knowledge Center
Digital Shelf Playbook MAP Compliance Guide Pricing Intel Guide Scraping Compliance TikTok Shop Guide NEW Cross-Border Guide NEW
Knowledge Center
Digital Shelf Playbook MAP Compliance Guide Pricing Intel Guide Scraping Compliance TikTok Shop Guide NEW Cross-Border Guide NEW Guides & Playbooks
🎉 Seasonal & event tracking NEWBlack Friday pricing report Festive season, India Ramadan, GCC grocery All seasonal reportsSample Datasets HOT ROI Calculator NEW API Postman Collection Demo Dashboards Free API Playground NEW Press Kit
Guides & Playbooks
🎉 Seasonal & event tracking NEWBlack Friday pricing report Festive season, India Ramadan, GCC grocery All seasonal reportsSample Datasets HOT ROI Calculator NEW API Postman Collection Demo Dashboards Free API Playground NEW Press Kit Downloads & Tools
Trust Center About Us FAQs Careers
Downloads & Tools
Trust Center About Us FAQs Careers Trust & CompanyRetail shelf research NEWRetail shelf research






































 4.8/5 Average Rating
 50+ Video Testimonials
 92% Client Retention
 50+ Countries Served