Core services
Enterprise Data Extraction

Scalable web, app and AI-powered collection across 40+ countries.

All 58 services →
New 2026
AI Training Data

Corpus building with provenance and opt-out compliance.

Learn more →
Free pilot
24-hour sample

We run collection on your own sources before you commit.

Get a sample →
58Services
40+Countries
DEVELOPER

Ready-Made Scrapers

Pre-built for top platforms. Self-serve, no setup.

View All →
TRY FREE

API Playground

Test endpoints instantly. No credit card.

Start Free →
28Tools
2SDKs
icons Delivery & SDKs
Streaming Crawl API Scheduler Realtime Alerts Webhook Delivery 🐍 Python SDK 💚 Node.js SDK

Need it managed instead?

Fixed monthly retainer, named engineer, no per-request metering.

Managed Data API →
HOT

Case Studies

How brands use Actowiz, with named outcomes.

Read →
FREE

Sample Datasets

Real output, no signup.

Download →
NEW

ROI Calculator

Model the return on a data engagement.

Calculate →

Introduction

The hospitality industry has entered a highly competitive distribution environment where travellers can compare room rates across multiple channels within seconds. Hotels must therefore understand not only their own pricing but also how rates, promotions, cancellation policies, room types, and availability appear across online travel agencies (OTAs). The OTA Price Parity Intelligence Report 2026 examines the evolution of digital hotel distribution, pricing discrepancies, competitive rate monitoring, and the growing importance of structured market intelligence.

The report also explores Hotel Price Intelligence Across OTAs, highlighting how hotels can identify rate gaps, evaluate distribution performance, and improve pricing decisions through systematic data collection. The period from 2020 to 2026 covers a major transformation: pandemic disruption, rapid recovery in leisure travel, renewed OTA demand, stronger direct-booking strategies, and increasingly automated revenue-management practices.

Industry data shows that OTA distribution remains significant. In 2025, independent properties reported that OTAs accounted for 63.4% of bookings, up from 61.3% in 2024. Meanwhile, Booking Holdings reported $186.1 billion in total gross bookings in 2025, up 12.4% year over year. These developments make price parity intelligence increasingly important for hotels seeking profitable and consistent distribution.

How Distribution Economics Changed Across the Period

Hotel Price Parity Monitoring with Booking.com Data has become increasingly relevant as accommodation distribution has shifted toward digital channels. In 2020, the pandemic caused hotel demand and OTA volumes to fall sharply, while direct channels benefited from travellers seeking flexible cancellation policies and direct communication. In 2021, OTA hotel gross bookings in the U.S. increased 97% from 2020 to nearly $41 billion, with OTAs representing 52% of hotel online leisure sales.

The recovery accelerated through 2022 and 2023. Hotels increasingly needed to compare public rates across channels because consumers were once again shopping across multiple platforms. D-EDGE reported that direct revenue share increased from 23.6% in 2019 to 29.5% in 2023.

Year Key distribution indicator Parity implication
2020 OTA hotel demand dropped sharply Large rate and availability fluctuations
2021 OTA hotel gross bookings rose 97% in U.S. Competitive monitoring became important
2022 Direct channels recovered strongly Hotels compared OTA and direct offers
2023 Direct revenue share reached 29.5% in D-EDGE data More channel-level comparisons
2024 Global OTA hotel gross bookings reached $266B High-value monitoring environment
2025 Independent-property OTA share reached 63.4% Strong need for parity visibility
2026 Automation and AI increasingly influence pricing Real-time intelligence becomes strategic

The 2024 global hotel distribution data estimated $266 billion in OTA gross bookings compared with $262 billion through digital-direct channels. For revenue teams, this demonstrates why price parity cannot be treated simply as a distribution compliance issue. Booking.com Hotel Competitor Rate Intelligence also functions as a competitive intelligence capability that supports pricing, promotions, inventory decisions, and channel strategy.

Building a Reliable Competitive Rate Framework

Hotel Competitor Rate Intelligence allows hospitality businesses to move beyond isolated rate checks and create a structured view of market positioning. A meaningful competitive framework should capture property name, destination, room category, occupancy, stay dates, refundable status, meal plan, taxes, discounts, currency, and final displayed price.

The importance of this approach increased between 2020 and 2026 as travellers became more accustomed to comparing properties digitally. In 2023, D-EDGE found that Booking.com generated 43% of online revenue for hotels in its European dataset, while direct bookings represented 29% and Expedia 13%. In Asia, direct bookings represented 32%, Traveloka 19%, Booking.com 15%, and Agoda 11%.

Year Market development Competitive intelligence requirement
2020 Demand disruption Monitor rapidly changing rates
2021 OTA rebound Compare recovering competitor prices
2022 Leisure demand recovery Track promotions and availability
2023 Digital distribution expanded Benchmark channel positioning
2024 OTA and direct channels remained highly competitive Monitor total customer-facing price
2025 OTA dependency increased for independent hotels Increase monitoring frequency
2026 AI-supported revenue decisions expand Automate competitive intelligence

Booking.com itself reported approximately 4.0 million properties on its platform at the end of 2024, including around 500,000 hotels, motels, and resorts. By the end of 2025, the total reached approximately 4.4 million properties.

For hotel groups, competitive intelligence can therefore be organized around specific market segments rather than generic competitor lists. Monitoring comparable properties by star rating, location, amenities, room type, and guest profile can reveal whether a rate difference represents a genuine competitive opportunity or simply reflects different inventory conditions. Booking.com Hotel Direct vs OTA Price Comparison Data can further help revenue teams evaluate channel-level price gaps and make more informed distribution and pricing decisions.

Identifying Hidden Gaps in Channel Pricing

Booking.com & OTA Rate Parity Data Analysis provides a structured way to identify differences between a hotel's advertised rates across distribution channels. A parity gap can occur because of public discounts, mobile promotions, loyalty pricing, package rates, currency conversions, taxes, fees, room-type mismatches, or differences in cancellation conditions.

From 2020 through 2022, such differences were often influenced by unprecedented changes in demand and promotional activity. By 2023 and 2024, the challenge shifted toward more sophisticated channel comparison. Global hotel digital distribution represented 60% of distribution revenue on average in D-EDGE's 2019–2023 dataset.

Year Analytical focus Typical data variables
2020 Demand volatility Base rate, availability
2021 OTA recovery Promotions, cancellation
2022 Rebound pricing Room type, occupancy
2023 Channel optimization Rate, discount, inventory
2024 Cross-channel benchmarking Taxes, fees, packages
2025 Automated monitoring Frequency and anomaly detection
2026 Predictive intelligence Trends, alerts, competitive signals

The analytical process should normalize rates before comparison. A $150 refundable room and a $130 non-refundable room should not automatically be classified as a $20 parity gap. Similarly, a mobile-only promotion should be evaluated separately from the publicly available flexible rate.

This creates a more accurate parity framework based on like-for-like comparisons. Hotels can then classify discrepancies as acceptable promotional differences, channel-specific conditions, or genuine pricing anomalies requiring action. Booking.com price parity monitoring enables revenue teams to track these variations consistently, identify recurring discrepancies, and respond quickly to pricing issues across distribution channels.

Comparing Direct Distribution With Third-Party Channels

Hotel Direct vs OTA Price Comparison Data helps revenue and distribution teams understand how their own website pricing compares with third-party channels. This is increasingly important because direct bookings can reduce intermediary costs while OTAs provide significant customer reach.

The industry's distribution balance has changed considerably. In 2019, global OTA hotel gross bookings were approximately $270 billion. By 2024, the figure was $266 billion, while digital-direct hotel bookings increased from $218 billion to $262 billion. This indicates that direct distribution has strengthened without eliminating the importance of OTAs.

Year Distribution environment Strategic priority
2020 Pandemic disruption Protect demand and flexibility
2021 OTA rebound Maintain channel competitiveness
2022 Direct booking recovery Strengthen owned channels
2023 Direct revenue share increased Compare total channel economics
2024 OTA and direct volumes remained substantial Monitor customer-facing prices
2025 Direct online and OTA bookings each reported at 21% in RateGain survey Balance reach and profitability
2026 Multi-channel pricing becomes increasingly automated Optimize net revenue

A 2025 RateGain/HEDNA/NYU distribution study covering more than 21,000 properties found that direct online bookings and OTA bookings each represented 21% of respondents' total bookings.

Consequently, hotels should not pursue parity simply to make every channel identical. The objective should be to understand differences, control unauthorized or undesirable discrepancies, and determine where channel-specific offers generate incremental demand without damaging the hotel's direct relationship with customers. A Booking.Com Hotel Data Scraper can support this process by collecting structured hotel rates, room details, availability, and promotional information for systematic channel comparison.

Improving Monitoring Frequency and Decision Speed

Modern price parity monitoring increasingly depends on automated data collection rather than occasional manual checks. A hotel operating across multiple destinations and room categories can face thousands of potential rate combinations across dates, occupancy levels, room types, and booking conditions.

Between 2020 and 2022, manual monitoring could often provide basic competitive visibility because demand was highly disrupted and inventory was constrained. As travel normalized during 2023 and 2024, the number of pricing signals increased. By 2025 and 2026, automated monitoring became more valuable because hotels could use structured data to identify anomalies and prioritize the most commercially important discrepancies.

Year Monitoring maturity Recommended approach
2020 Reactive Manual spot checks
2021 Basic digital comparison Daily monitoring
2022 Broader competitive tracking Scheduled extraction
2023 Structured benchmarking Multiple stay-date checks
2024 Cross-channel intelligence Automated comparison
2025 Near-real-time decision support Alerts and dashboards
2026 AI-assisted intelligence Continuous anomaly detection

The objective is not simply to collect more data. It is to convert raw rates into useful alerts. For example, a system can flag when a property is consistently 8–10% more expensive than comparable hotels, when a competitor launches a large discount, or when the hotel's direct rate is unexpectedly higher than an OTA rate.

This allows revenue teams to prioritize meaningful events instead of reviewing thousands of individual prices. It also creates historical datasets that can reveal recurring parity patterns by market, weekday, season, room category, and booking window.

Building an Automated Intelligence Infrastructure

A modern Hotel Data Scraper can support systematic collection of publicly visible accommodation information across selected channels, destinations, and stay dates. When combined with structured processing and analytics, this infrastructure can transform fragmented rate observations into a consistent market intelligence layer.

The broader OTA Price Parity Intelligence Report 2026 reflects this transition from basic scraping toward decision-oriented intelligence. Booking Holdings' 2025 results demonstrate the scale of the digital travel environment: the company reported $186.1 billion in total gross bookings, representing a 12.4% increase from 2024.

Year Technology trend Business opportunity
2020 Rapid digital adoption Establish digital rate tracking
2021 OTA recovery Expand competitor datasets
2022 More dynamic pricing Increase monitoring coverage
2023 API and automation adoption Centralize rate intelligence
2024 Larger digital distribution footprint Scale data collection
2025 AI and automation Generate actionable alerts
2026 Predictive data intelligence Support proactive pricing

A scalable infrastructure can capture property details, room names, displayed rates, promotions, availability, stay dates, occupancy, cancellation conditions, and other relevant attributes. Data can then be normalized, stored historically, and compared against internal pricing.

The strongest systems combine extraction with validation and analytics. This makes it possible to identify recurring parity gaps, detect sudden competitor movements, monitor destination-level trends, and supply data to revenue-management dashboards. In 2026, the strategic value lies not simply in scraping rates but in creating a reliable intelligence workflow that helps commercial teams make faster and better-informed decisions.

For hospitality businesses seeking scalable pricing intelligence, Actowiz Solutions can support structured collection and processing of accommodation information for competitive analysis. Scrape Hotel Pricing Data from Booking.com can help businesses organize publicly available rate, room, availability, promotion, and booking-condition information into usable datasets. Combined with the OTA Price Parity Intelligence Report 2026, this approach can support competitive benchmarking, channel comparison, anomaly identification, and historical trend analysis.

Actowiz Solutions can also help businesses develop customized data workflows based on destinations, properties, room categories, stay dates, and monitoring frequency. The objective is to turn fragmented market information into structured intelligence that revenue, distribution, and strategy teams can use for faster decisions.

Conclusion

The evolution of hotel distribution from 2020 to 2026 demonstrates why pricing visibility has become a strategic requirement. OTAs continue to provide enormous customer reach, while direct channels are becoming increasingly sophisticated. This creates an environment where hotels must continuously understand how their rates, promotions, room conditions, and availability compare across channels.

A structured parity intelligence framework can help businesses detect pricing gaps, benchmark competitors, monitor channel performance, and identify opportunities to improve net revenue. The combination of automated collection, historical datasets, normalization, and analytics provides a stronger foundation than periodic manual checks.

Businesses looking to strengthen their hospitality data capabilities can combine Web Crawling service expertise with Web Data Mining to build scalable, customized intelligence workflows.

Turn OTA pricing data into actionable hospitality intelligence with Actowiz Solutions—connect with our team to explore customized hotel data collection and price parity monitoring solutions for 2026!

Social Proof That Converts

Trusted by Global Leaders Across Q-Commerce, Travel, Retail, and FoodTech

Our web scraping expertise is relied on by 4,000+ global enterprises including Zomato, Tata Consumer, Subway, and Expedia — helping them turn web data into growth.

4,000+ Enterprises Worldwide
50+ Countries Served
20+ Industries
Join 4,000+ companies growing with Actowiz →
Real Results from Real Clients

Hear It Directly from Our Clients

Watch how businesses like yours are using Actowiz data to drive growth.

1 min
★★★★★
"Actowiz Solutions offered exceptional support with transparency and guidance throughout. Anna and Saga made the process easy for a non-technical user like me. Great service, fair pricing!"
TG
Thomas Galido
Co-Founder / Head of Product at Upright Data Inc.
2 min
★★★★★
"Actowiz delivered impeccable results for our company. Their team ensured data accuracy and on-time delivery. The competitive intelligence completely transformed our pricing strategy."
II
Iulen Ibanez
CEO / Datacy.es
1:30
★★★★★
"What impressed me most was the speed — we went from requirement to production data in under 48 hours. The API integration was seamless and the support team is always responsive."
FC
Febbin Chacko
-Fin, Small Business Owner
icons 4.8/5 Average Rating
icons 50+ Video Testimonials
icons 92% Client Retention
icons 50+ Countries Served

Join 4,000+ Companies Growing with Actowiz

From Zomato to Expedia — see why global leaders trust us with their data.

Why Global Leaders Trust Actowiz

Backed by automation, data volume, and enterprise-grade scale — we help businesses from startups to Fortune 500s extract competitive insights across the USA, UK, UAE, and beyond.

icons
7+
Years of Experience
Proven track record delivering enterprise-grade web scraping and data intelligence solutions.
icons
4,000+
Projects Delivered
Serving startups to Fortune 500 companies across 50+ countries worldwide.
icons
200+
In-House Experts
Dedicated engineers across scrapers, AI/ML models, APIs, and data quality assurance.
icons
9.2M
Automated Workflows
Running weekly across eCommerce, Quick Commerce, Travel, Real Estate, and Food industries.
icons
270+ TB
Data Transferred
Real-time and batch data scraping at massive scale, across industries globally.
icons
380M+
Pages Crawled Weekly
Scaled infrastructure for comprehensive global data coverage with 99% accuracy.

AI Solutions Engineered
for Your Needs

LLM-Powered Attribute Extraction: High-precision product matching using large language models for accurate data classification.
Advanced Computer Vision: Fine-grained object detection for precise product classification using text and image embeddings.
GPT-Based Analytics Layer: Natural language query-based reporting and visualization for business intelligence.
Human-in-the-Loop AI: Continuous feedback loop to improve AI model accuracy over time.
icons Product Matching icons Attribute Tagging icons Content Optimization icons Sentiment Analysis icons Prompt-Based Reporting

Connect the Dots Across
Your Retail Ecosystem

We partner with agencies, system integrators, and technology platforms to deliver end-to-end solutions across the retail and digital shelf ecosystem.

icons
Analytics Services
icons
Ad Tech
icons
Price Optimization
icons
Business Consulting
icons
System Integration
icons
Market Research
Become a Partner →

Popular Datasets — Ready to Download

Browse All Datasets →
icons
Amazon
eCommerce
Free 100 rows
icons
Zillow
Real Estate
Free 100 rows
icons
DoorDash
Food Delivery
Free 100 rows
icons
Walmart
Retail
Free 100 rows
icons
Booking.com
Travel
Free 100 rows
icons
Indeed
Jobs
Free 100 rows

Latest Insights & Resources

View All Resources →
thumb
Blog

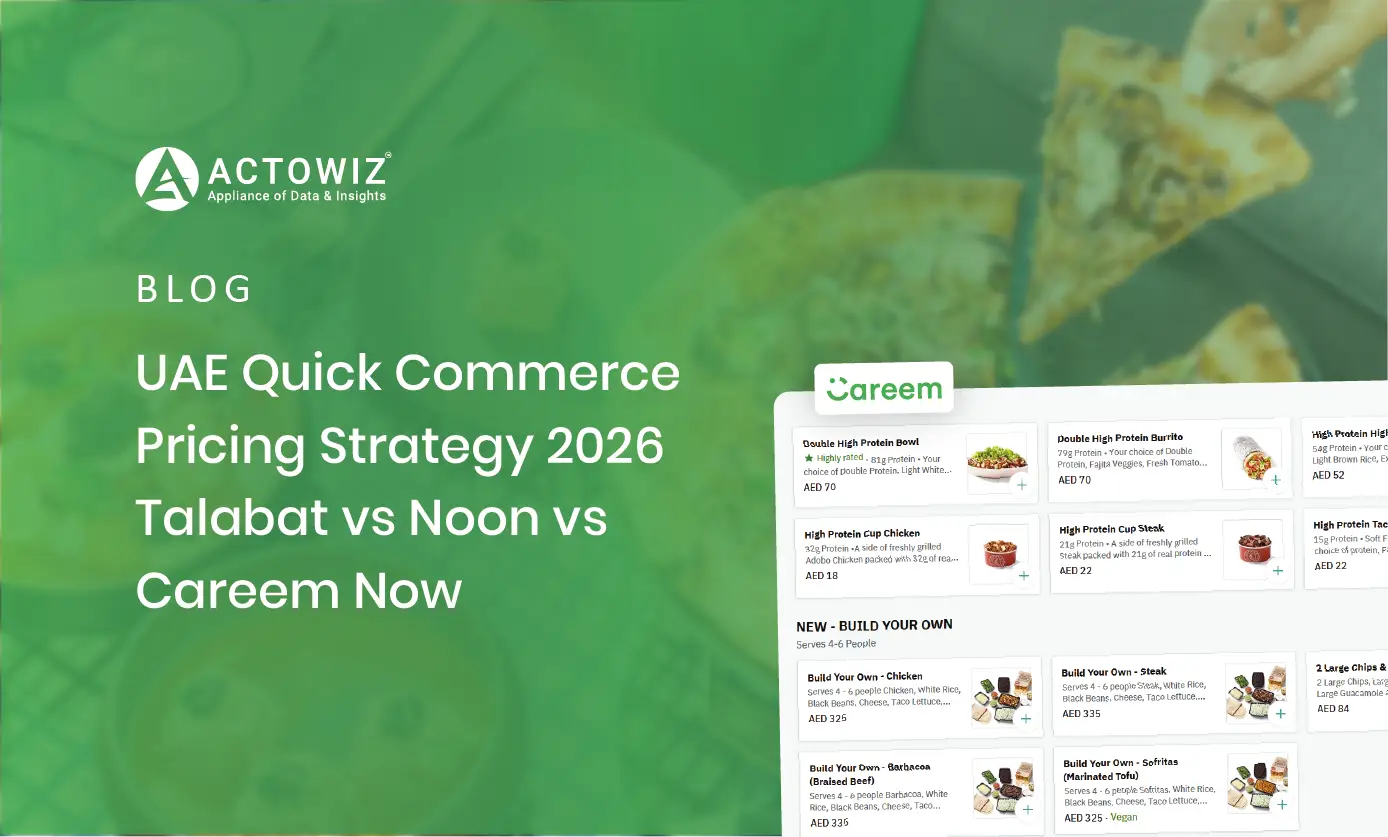
UAE Quick Commerce Pricing Strategy Report 2026 - How Talabat vs Noon vs Careem Now Can Improve Price Competitiveness

Explore the UAE Quick Commerce Pricing Strategy Report 2026 to compare Talabat, Noon, and Careem Now and improve pricing intelligence.

thumb
Case Study

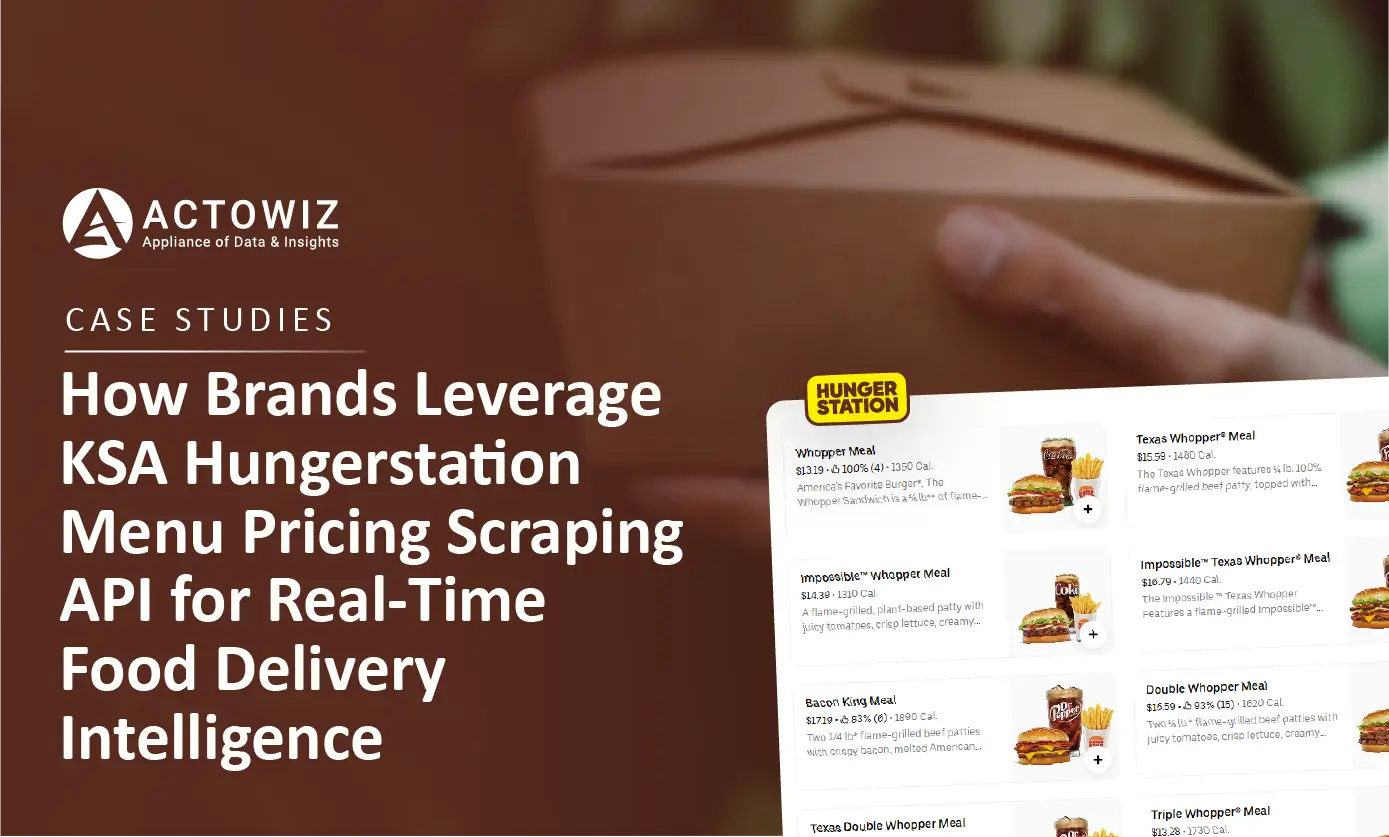
How Brands Leverage KSA Hungerstation Menu Pricing Scraping API for Real-Time Food Delivery Intelligence

Explore KSA Hungerstation Menu Pricing Scraping API to track menu prices, competitor changes, and food delivery market trends in Saudi Arabia.

thumb
Report

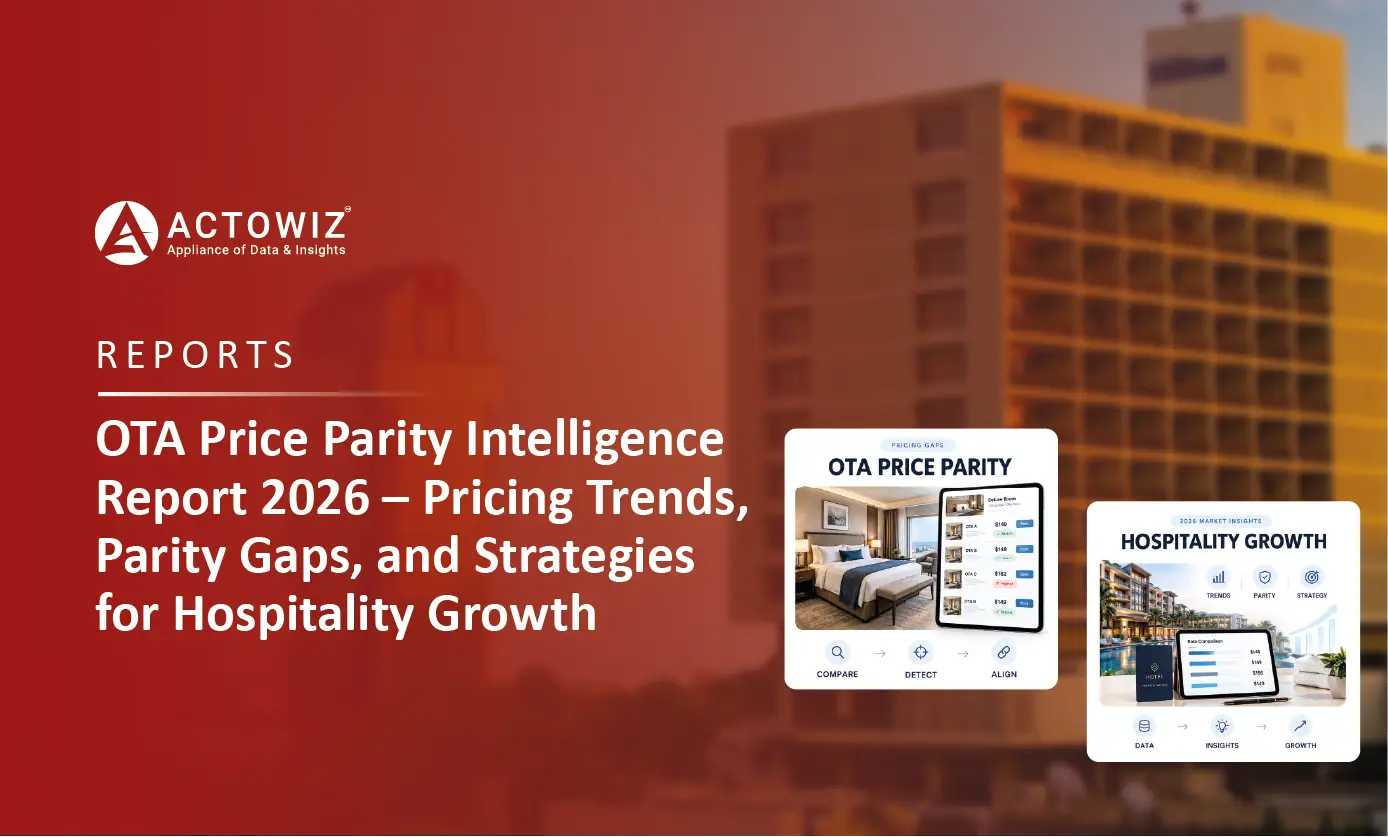
OTA Price Parity Intelligence Report 2026 – Pricing Trends, Parity Gaps, and Strategies for Hospitality Growth

Explore OTA Price Parity Intelligence Report 2026 covering rate gaps, competitor pricing, channel trends, and strategies to improve hotel revenue.

Start Where It Makes Sense for You

Whether you're a startup or a Fortune 500 — we have the right plan for your data needs.

icons
Enterprise
Book a Strategy Call
Custom solutions, dedicated support, volume pricing for large-scale needs.
icons
Growing Brand
Get Free Sample Data
Try before you buy — 500 rows of real data, delivered in 2 hours. No strings.
icons
Just Exploring
View Plans & Pricing
Transparent plans from $500/mo. Find the right fit for your budget and scale.

Request Free Sample Data

Our team will reach out within 2 hours with 500 rows of real data — no credit card required.

+1
Free 500-row sample · No credit card · Response within 2 hours