🎃 HALLOWEEN OFF Spooky Savings Event! Get FLAT 20% OFF on all Web Scraping & Data Extraction Plans 20% OFF Web Scraping Plans!
Ends in: 00d : 00h : 00m : 00s
🦇
👻
🎃 Spooktacular Limited Offer

Don’t Let High Data Costs Haunt You! 🎃

Get FLAT 20% OFF

T&C Apply

Scrape competitor prices, monitor MAP, and extract real-time datasets at a spooky discount this Halloween.

Offer Expires In:
00d : 00h : 00m : 00s
⚡ Claim 20% Discount Now
🎃
Promo Code Copied!
SPOOKY30 (20% OFF Applied)
Core services
Enterprise Data Extraction

Scalable web, app and AI-powered collection across 40+ countries.

All 58 services →
New 2026
AI Training Data

Corpus building with provenance and opt-out compliance.

Learn more →
Free pilot
24-hour sample

We run collection on your own sources before you commit.

Get a sample →
58Services
40+Countries
DEVELOPER

Ready-Made Scrapers

Pre-built for top platforms. Self-serve, no setup.

View All →
TRY FREE

API Playground

Test endpoints instantly. No credit card.

Start Free →
28Tools
2SDKs
icons Delivery & SDKs
Streaming Crawl API Scheduler Realtime Alerts Webhook Delivery 🐍 Python SDK 💚 Node.js SDK

Need it managed instead?

Fixed monthly retainer, named engineer, no per-request metering.

Managed Data API →
HOT

Case Studies

How brands use Actowiz, with named outcomes.

Read →
FREE

Sample Datasets

Real output, no signup.

Download →
NEW

ROI Calculator

Model the return on a data engagement.

Calculate →

Introduction

Zoomcar Data Intelligence 2026: Rental Market Insights

Three buyers.

Heads of e-commerce and digital shelf leads at brands and retailers who are being asked, internally, whether their catalogue is "ready for AI shopping" and have no evidence either way. They need a scoring method they can run against their own listings and a benchmark to sit against.

Founders and heads of growth at direct-to-consumer and marketplace-native brands, who need to know whether the listings carrying their revenue are legible to a machine that is increasingly the first reader.

Data and platform leads who will have to fix whatever this report finds — the people who own feeds, PDP templates, structured markup and identifier hygiene.

On inquiry themes: through September, a recurring pattern of inbound questions clustered around three things — whether product listings are structured well enough for AI assistants to use, how to audit a catalogue's identifier and attribute coverage at scale, and how to monitor whether a retailer's own pages and their structured markup actually agree. This report answers all three with measured evidence instead of opinion.

What this report measures

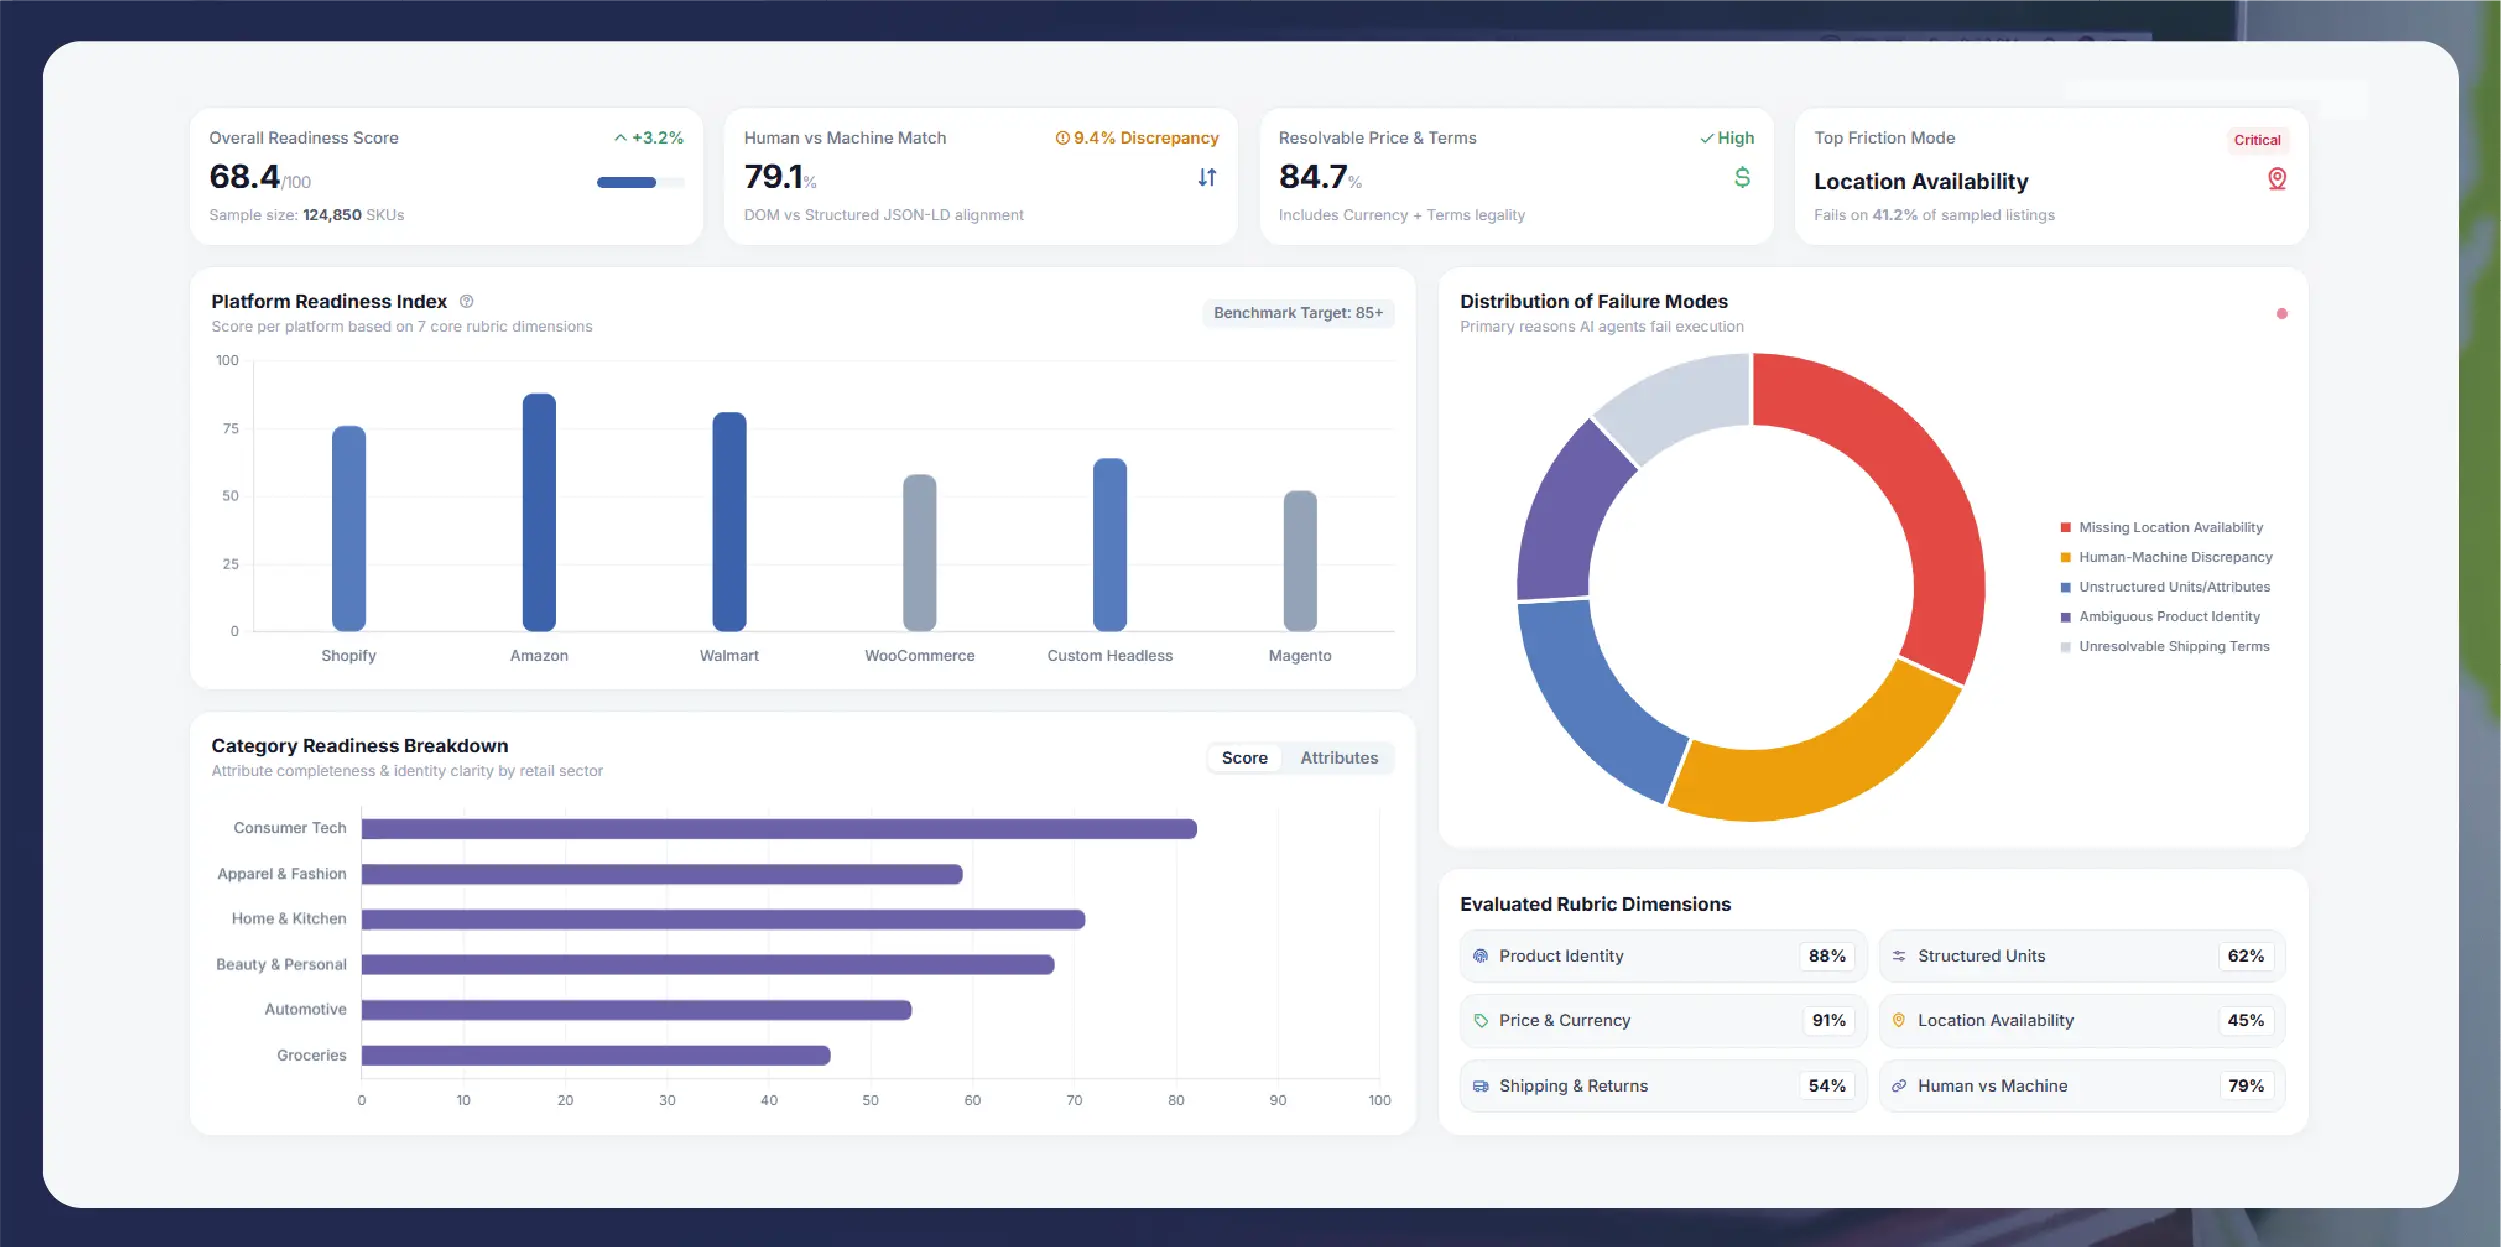
This report scores a defined sample of public product listings against a published rubric of what an agent demonstrably needs in order to answer a shopping question and complete a purchase: unambiguous product identity, structured attributes with units, a resolvable price with currency, location-aware availability, legible shipping and returns terms, a stable purchase URL, and agreement between what the page shows a human and what its structured markup tells a machine.

The output is a readiness score per listing, aggregated by platform, category and country, plus the distribution of specific failure modes.

What this report does and does not measure

It does measure: data legibility. Whether the fields an agent needs are present, machine-readable, internally consistent and stable across observations. All of it from what is publicly observable on a listing.

It does not measure: market share, brand share, sales, conversion, traffic, or revenue of any kind. It does not measure agent behaviour — we do not run agents against listings and we make no claim about which listings an agent would choose. It does not measure the quality of the product, the competitiveness of the price, or the reputation of the seller. It does not measure data a retailer supplies privately through a merchant feed, an API partnership or any other non-public channel.


A listing that scores poorly here may sell extremely well. The two are different questions.

The readiness rubric

The rubric is Actowiz Solutions' own. It is published in full so readers can dispute it, re-weight it, or run it themselves.

Each dimension is scored 0 or the full weight — pass or fail, no partial credit — to keep the index reproducible. A listing's total readiness score is the sum of weights passed, out of 100. Scores are then banded: Agent-ready (85–100), Partially readable (60–84), Weakly readable (35–59), Not agent-readable (0–34).

# Dimension Pass condition Weight
1 Stable internal identifier A platform-level product or listing ID is exposed on the page or in markup, and is unchanged across all observations in the window 10
2 External identifier resolvability A GTIN, EAN, UPC, ISBN or MPN is present, syntactically valid (including check digit where applicable) and resolves to the same product across at least two independent listings 15
3 Canonical title quality Title contains brand, product name and the variant-defining attribute; contains no promotional or vendor-inserted text (e.g. "Best Seller", "Free Ship"); under the platform's truncation threshold 10
4 Structured attribute coverage At least the category's defined mandatory attribute set is present as key–value pairs, with units expressed for every dimensional or weight value 15
5 Price resolvability A single unambiguous current price with an explicit currency code, distinguishable from list price and from any bundle or subscription price 12
6 Availability with location dimension Availability state is machine-readable and resolves for a specified location (postcode, pincode or store), not a global "in stock" flag alone 12
7 Shipping and returns terms Shipping cost or a cost rule, a delivery estimate, and a returns window are each machine-readable on or one click from the listing 8
8 Stable buy URL A canonical product URL that is unchanged across all observations, resolves without a redirect chain and without a required session parameter 8
9 Visible/markup consistency Price, availability and title in the structured markup match what is rendered to a human, within the tolerance defined in the methodology 10
Total 100

Dimension 9 is deliberately weighted as heavily as identifier presence. A listing whose markup disagrees with its own page is not partially readable — it is actively misleading to a machine reader, and we treat it as such.

Collection design

Sample at a glance
Planned scope
Countries 3 (India, United States, United Kingdom)
Channel classes 3 (general marketplaces, category-specialist marketplaces, quick-commerce)
Categories 5
Country × category cells per platform 15
Rubric dimensions scored per observation 9, weighted to 100 points
Cadence Repeat observation of every sampled listing across the window; quarterly edition

These figures are the planned scope of the design below, not an achieved count. A records-per-edition figure is deliberately absent, and would have to be invented: the per-cell target is defined statistically rather than as a fixed number, and the number of platforms is not fixed in the design, so sample size is an outcome of collection rather than an input to it. The sample size is therefore reported as a result — the distinct listings tracked total listings in sample, the observations behind them total observations, and the realised cell sizes with their margin of error cell sample sizes and margin of error. Realised volume runs under any full-grid expectation, because cells that fall below the minimum are reported as insufficient sample rather than combined upward, and sponsored placements are excluded from the frame entirely.

Sources. Major general marketplaces, category-specialist marketplaces and quick-commerce platforms across three countries: India, the United States and the United Kingdom. Quick-commerce is included specifically because its availability data is location-bound and short-lived, which stresses dimensions 6 and 9 harder than any other channel.

Category sampling. A fixed set of categories chosen for contrast in attribute complexity: consumer electronics (high attribute count, strong GTIN culture), grocery and packaged food (high GTIN coverage, weak attribute structure), apparel (weak GTIN culture, variant-heavy), beauty and personal care, and home and kitchen. Each category has a published mandatory attribute set, defined before collection begins, used for dimension 4.

Sampling method. Within each platform × country × category cell, listings are drawn from category browse and search result pages, stratified to include both high-visibility and deep-catalogue listings, so the index is not merely a measure of how well the best-merchandised listings are maintained. Sponsored placements are excluded. The per-cell target is set so that a difference of a few percentage points between platforms is distinguishable from sampling noise at the cell level; the realised cell sizes and the resulting margin are published in the appendix. Cells that fall below the minimum are reported as insufficient sample rather than being combined upward.

Cadence and window. Each listing in the sample is observed on multiple occasions across the collection window. Repeat observation is required — not optional — because dimensions 1, 5, 6, 8 and 9 are all stability or consistency tests and cannot be scored from a single visit. The collection window and the as-of date are stated on the cover.

Rendering. Listings are collected as a browser would render them, so that client-side-injected price and availability are captured. Structured markup is captured separately from rendered content, which is what makes dimension 9 measurable at all.

Data schema

One row per listing per observation. Scoring runs over the observation set.

Field Type Description Example format
observation_id string Unique per listing per visit ob_8f2c11a0
listing_id string Actowiz-assigned stable key for the listing across observations lst_0041927
observed_at timestamp UTC capture time 2026-11-04T09:12:33Z
country enum Collection country IN / US / GB
platform string Source platform label marketplace_a
platform_type enum Channel class marketplace / quick_commerce
category_l1 string Top-level category Consumer Electronics
category_l2 string Sub-category Headphones
platform_product_id string Platform's own product/listing ID as exposed B0XXXXXXX
external_id_type enum Identifier class found gtin13 / upc / mpn / none
external_id_value string Raw identifier as published 5012345678900
external_id_valid boolean Syntax and check digit pass true
external_id_cross_resolved boolean Same ID found on ≥2 independent listings for same product false
title_raw string Title exactly as published Brand X ANC Headphones, Black
title_has_brand boolean Brand token present true
title_has_variant_attr boolean Variant-defining attribute present true
title_promo_tokens array[string Promotional strings detected in title ["Best Seller"
attributes_found integer Count of key–value attribute pairs 14
attributes_required integer Mandatory count for this category 11
attributes_with_units integer Dimensional attributes carrying an explicit unit 3
price_current decimal Current price as rendered 8999.00
price_currency string ISO 4217 code INR
price_list decimal, nullable List/MRP price where distinguishable 11999.00
price_ambiguous boolean Multiple candidate prices, none resolvable as current false
availability_state enum Machine-readable state in_stock / out_of_stock / preorder / unknown
availability_location string, nullable Location the state was resolved for 560034
shipping_cost_readable boolean Cost or cost rule machine-readable true
delivery_estimate_readable boolean Delivery window machine-readable false
returns_window_readable boolean Returns window machine-readable true
canonical_url string Canonical product URL https://…/p/0041927
url_stable boolean Unchanged across observations true
url_redirect_chain_len integer Hops to final URL 0
markup_present boolean Product structured markup detected true
markup_price_delta decimal, nullable Markup price minus rendered price -500.00
markup_availability_match boolean, nullable Markup availability equals rendered false
markup_title_match boolean, nullable Markup title equals rendered title true
dim_1_pass … dim_9_pass boolean Per-dimension pass flags true
readiness_score integer Sum of passed weights, 0–100 62
readiness_band enum Band label Partially readable

Report sections

Cover and as-of statement — title, collection window, as-of date, sample scale, one-line scope.

Executive summary — the headline: a large share of the sampled digital shelf is not agent-readable, with the dominant failure modes named. One page, no figure.

What this report measures, and what it does not — the does/does-not note, verbatim.

The readiness rubric — the full table, published for dispute.

Figure 1: Readiness bands across the sample — stacked bar. X: country. Y: share of listings (%). Series: the four readiness bands. Stacked because the bands are mutually exclusive and sum to 100% of listings — the shape of the whole is the finding.

Figure 2: Score distribution — histogram. X: readiness score (0–100, 5-point bins). Y: count of listings. A histogram because the question is whether the shelf is bimodal — a well-maintained head and a long unreadable tail — which a mean would hide.

Figure 3: Pass rate by rubric dimension — horizontal bars. X: pass rate (%). Y: the nine dimensions, sorted ascending. Items against one measure, so bars; sorted so the weakest dimension reads first.

Figure 4: Readiness by platform type — grouped bars. X: platform type (marketplace, quick-commerce). Y: pass rate (%). Series: the availability and consistency dimensions only. Isolates the channel effect on the two time-sensitive dimensions.

Figure 5: Identifier resolvability by category — bars. X: category. Y: share of listings with a valid, cross-resolvable external identifier. The clearest single illustration of why identity, not markup, is the first blocker.

Figure 6: Attribute completeness against the mandatory set — box plot. X: category. Y: attributes found as a share of the mandatory set. A box because the spread within a category is the finding, not the median.

Figure 7: Visible-versus-markup price disagreement — histogram. X: signed markup price delta as a share of rendered price. Y: count of listings. Shows both direction and magnitude of disagreement; a pass rate alone loses both.

Figure 8: Readiness over the collection window — line. X: observation date. Y: mean readiness score. Series: country. A level tracked over time, so a line. Establishes the quarterly baseline.

Failure mode profiles — four short written profiles of the most common failure patterns, each with an anonymised example structure and the fix.

What a brand can do about it — a prioritised remediation order derived from dimension weights and observed pass rates.

Methodology and limitations — in full.

Appendix: category mandatory attribute sets, cell sample sizes, margin of error, rubric change log.

Data slots

Slot marker Produced by
total listings in sample Count of distinct listing_id
total observations Count of observation_id
platforms covered Distinct platform
categories covered Distinct category_l2
collection window start and end Min/max observed_at
share of listings not agent-readable Share in band 0–34
share of listings agent-ready Share in band 85–100
mean readiness score, overall Mean readiness_score
mean readiness score by country Mean by country
band distribution by country Fig 1
score histogram bins Fig 2
pass rate per dimension, 1–9 Fig 3
share of tracked listings carrying a resolvable GTIN external_id_cross_resolved = true
share with an external identifier present but syntactically invalid external_id_type ≠ none AND external_id_valid = false
share of titles containing promotional tokens title_promo_tokens non-empty
median attribute completeness by category Fig 6
share of dimensional attributes lacking units attributes_with_units vs dimensional count
share with ambiguous current price price_ambiguous = true
share with availability resolvable to a location availability_location non-null
availability pass rate, quick-commerce vs marketplace Fig 4
share with all three shipping/returns terms readable Dimension 7 pass
share with unstable buy URL across window url_stable = false
share with no product structured markup markup_present = false
share where markup price disagrees with rendered price markup_price_delta ≠ 0
markup price delta distribution Fig 7
share where markup availability disagrees markup_availability_match = false
mean readiness score over time by country Fig 8
cell sample sizes and margin of error Appendix

Methodology and limitations

The rubric is ours. Actowiz Solutions designed the nine dimensions and set the weights. They are not a standard and we do not present them as one. We publish the rubric in full, with the weights and the pass conditions, so that a reader who disagrees can re-weight it and re-derive the index. Any change to the rubric between quarterly editions is recorded in a change log so that period-on-period comparisons are auditable.

The readiness criteria are derived from the task, not from a vendor spec. Agentic commerce protocols are still consolidating. We therefore do not build this index on any single vendor's published requirements, we do not assert a fixed specification or version number, and we do not describe commercial arrangements between companies. Instead, each dimension is derived from what any agent demonstrably needs in order to answer a shopping question and complete a purchase: it must know which product this is (dimensions 1–3), what the product is (4), what it costs (5), whether it can be had here and now (6–7), where to buy it (8), and whether the machine-readable version of the page can be trusted (9). If the protocol landscape settles into something narrower or broader, the rubric will be revised in the open rather than retrofitted.

Public listings only. Everything here is observed from a public product listing as a browser renders it. Many retailers supply richer, cleaner data privately — through merchant feeds, partner APIs or direct integrations — and none of that is visible to us or counted here. A low score means the public listing is hard to read. It does not mean the retailer has no good data anywhere.

Poor score, strong sales. Readiness is not performance. A listing can fail most of this rubric and still be a category bestseller, because human shoppers tolerate ambiguity that machines do not. Readers should treat the index as a measure of exposure to a coming constraint, not as a diagnosis of current commercial health.

Agent behaviour is not measured. We do not run shopping agents against these listings, and we make no claim about which listings an agent would surface, prefer or purchase. Agent selection logic is proprietary, changing and outside the scope of this work.

Pass/fail scoring is deliberately blunt. Binary scoring loses nuance — a listing missing one of eleven mandatory attributes scores the same on dimension 4 as one missing all eleven. We accept that cost in exchange for reproducibility; the underlying per-field counts are in the schema for anyone who wants a graded version.

Sampling. The index describes the sampled cells, not the entire catalogue of any platform. Cells below the minimum sample are reported as insufficient rather than merged. Sponsored placements are excluded, which means the index reflects organic catalogue quality.

Rendering and timing. Price and availability are point-in-time. Quick-commerce availability in particular can change within minutes, so some measured visible/markup disagreement will reflect capture latency rather than a genuine data defect. The tolerance window used to separate the two is published in the appendix.

Social Proof That Converts

Trusted by Global Leaders Across Q-Commerce, Travel, Retail, and FoodTech

Our web scraping expertise is relied on by 4,000+ global enterprises including Zomato, Tata Consumer, Subway, and Expedia — helping them turn web data into growth.

4,000+ Enterprises Worldwide
50+ Countries Served
20+ Industries
Join 4,000+ companies growing with Actowiz →
Real Results from Real Clients

Hear It Directly from Our Clients

Watch how businesses like yours are using Actowiz data to drive growth.

▶
1 min
★★★★★
"Actowiz Solutions offered exceptional support with transparency and guidance throughout. Anna and Saga made the process easy for a non-technical user like me. Great service, fair pricing!"
TG
Thomas Galido
Co-Founder / Head of Product at Upright Data Inc.
▶
2 min
★★★★★
"Actowiz delivered impeccable results for our company. Their team ensured data accuracy and on-time delivery. The competitive intelligence completely transformed our pricing strategy."
II
Iulen Ibanez
CEO / Datacy.es
▶
1:30
★★★★★
"What impressed me most was the speed — we went from requirement to production data in under 48 hours. The API integration was seamless and the support team is always responsive."
FC
Febbin Chacko
-Fin, Small Business Owner
icons 4.8/5 Average Rating
icons 50+ Video Testimonials
icons 92% Client Retention
icons 50+ Countries Served

Join 4,000+ Companies Growing with Actowiz

From Zomato to Expedia — see why global leaders trust us with their data.

Why Global Leaders Trust Actowiz

Backed by automation, data volume, and enterprise-grade scale — we help businesses from startups to Fortune 500s extract competitive insights across the USA, UK, UAE, and beyond.

icons
7+
Years of Experience
Proven track record delivering enterprise-grade web scraping and data intelligence solutions.
icons
4,000+
Projects Delivered
Serving startups to Fortune 500 companies across 50+ countries worldwide.
icons
200+
In-House Experts
Dedicated engineers across scrapers, AI/ML models, APIs, and data quality assurance.
icons
9.2M
Automated Workflows
Running weekly across eCommerce, Quick Commerce, Travel, Real Estate, and Food industries.
icons
270+ TB
Data Transferred
Real-time and batch data scraping at massive scale, across industries globally.
icons
380M+
Pages Crawled Weekly
Scaled infrastructure for comprehensive global data coverage with 99% accuracy.

AI Solutions Engineered
for Your Needs

→
LLM-Powered Attribute Extraction: High-precision product matching using large language models for accurate data classification.
→
Advanced Computer Vision: Fine-grained object detection for precise product classification using text and image embeddings.
→
GPT-Based Analytics Layer: Natural language query-based reporting and visualization for business intelligence.
→
Human-in-the-Loop AI: Continuous feedback loop to improve AI model accuracy over time.
icons Product Matching icons Attribute Tagging icons Content Optimization icons Sentiment Analysis icons Prompt-Based Reporting

Connect the Dots Across
Your Retail Ecosystem

We partner with agencies, system integrators, and technology platforms to deliver end-to-end solutions across the retail and digital shelf ecosystem.

icons
Analytics Services
icons
Ad Tech
icons
Price Optimization
icons
Business Consulting
icons
System Integration
icons
Market Research
Become a Partner →

Popular Datasets — Ready to Download

Browse All Datasets →
icons
Amazon
eCommerce
Free 100 rows
icons
Zillow
Real Estate
Free 100 rows
icons
DoorDash
Food Delivery
Free 100 rows
icons
Walmart
Retail
Free 100 rows
icons
Booking.com
Travel
Free 100 rows
icons
Indeed
Jobs
Free 100 rows

Latest Insights & Resources

View All Resources →
thumb
Blog

Weekly Circular Data: Tracking Sale Prices Across the Top 10 US Grocery Chains

Track weekly grocery circular data across the top 10 US grocery chains. Analyze sale prices, discounts, promotions, product offers, and competitor pricing trends.

thumb
Case Study

How We Helped a Leading Food-Tech Brand Leverage Restaurant & Menu Data from RestaurantGuru UK for Smarter Market Analysis

Explore Restaurant & Menu Data from RestaurantGuru UK to analyze restaurant listings, menus, pricing, ratings, and dining trends.

thumb
Report

Makeup Price Benchmark: Global Makeup Market Data Report 2026 for Sephora, Ulta, Amazon & Nykaa Insights

Global makeup price benchmark 2026: how L'Oreal, Estee Lauder, Maybelline and MAC products are priced across Sephora, Ulta, Amazon and Nykaa.

Start Where It Makes Sense for You

Whether you're a startup or a Fortune 500 — we have the right plan for your data needs.

icons
Enterprise
Book a Strategy Call
Custom solutions, dedicated support, volume pricing for large-scale needs.
icons
Growing Brand
Get Free Sample Data
Try before you buy — 500 rows of real data, delivered in 2 hours. No strings.
icons
Just Exploring
View Plans & Pricing
Transparent plans from $500/mo. Find the right fit for your budget and scale.

Request Free Sample Data

Our team will reach out within 2 hours with 500 rows of real data — no credit card required.

+1 ▼
✓ Free 500-row sample · No credit card · Response within 2 hours