Introduction
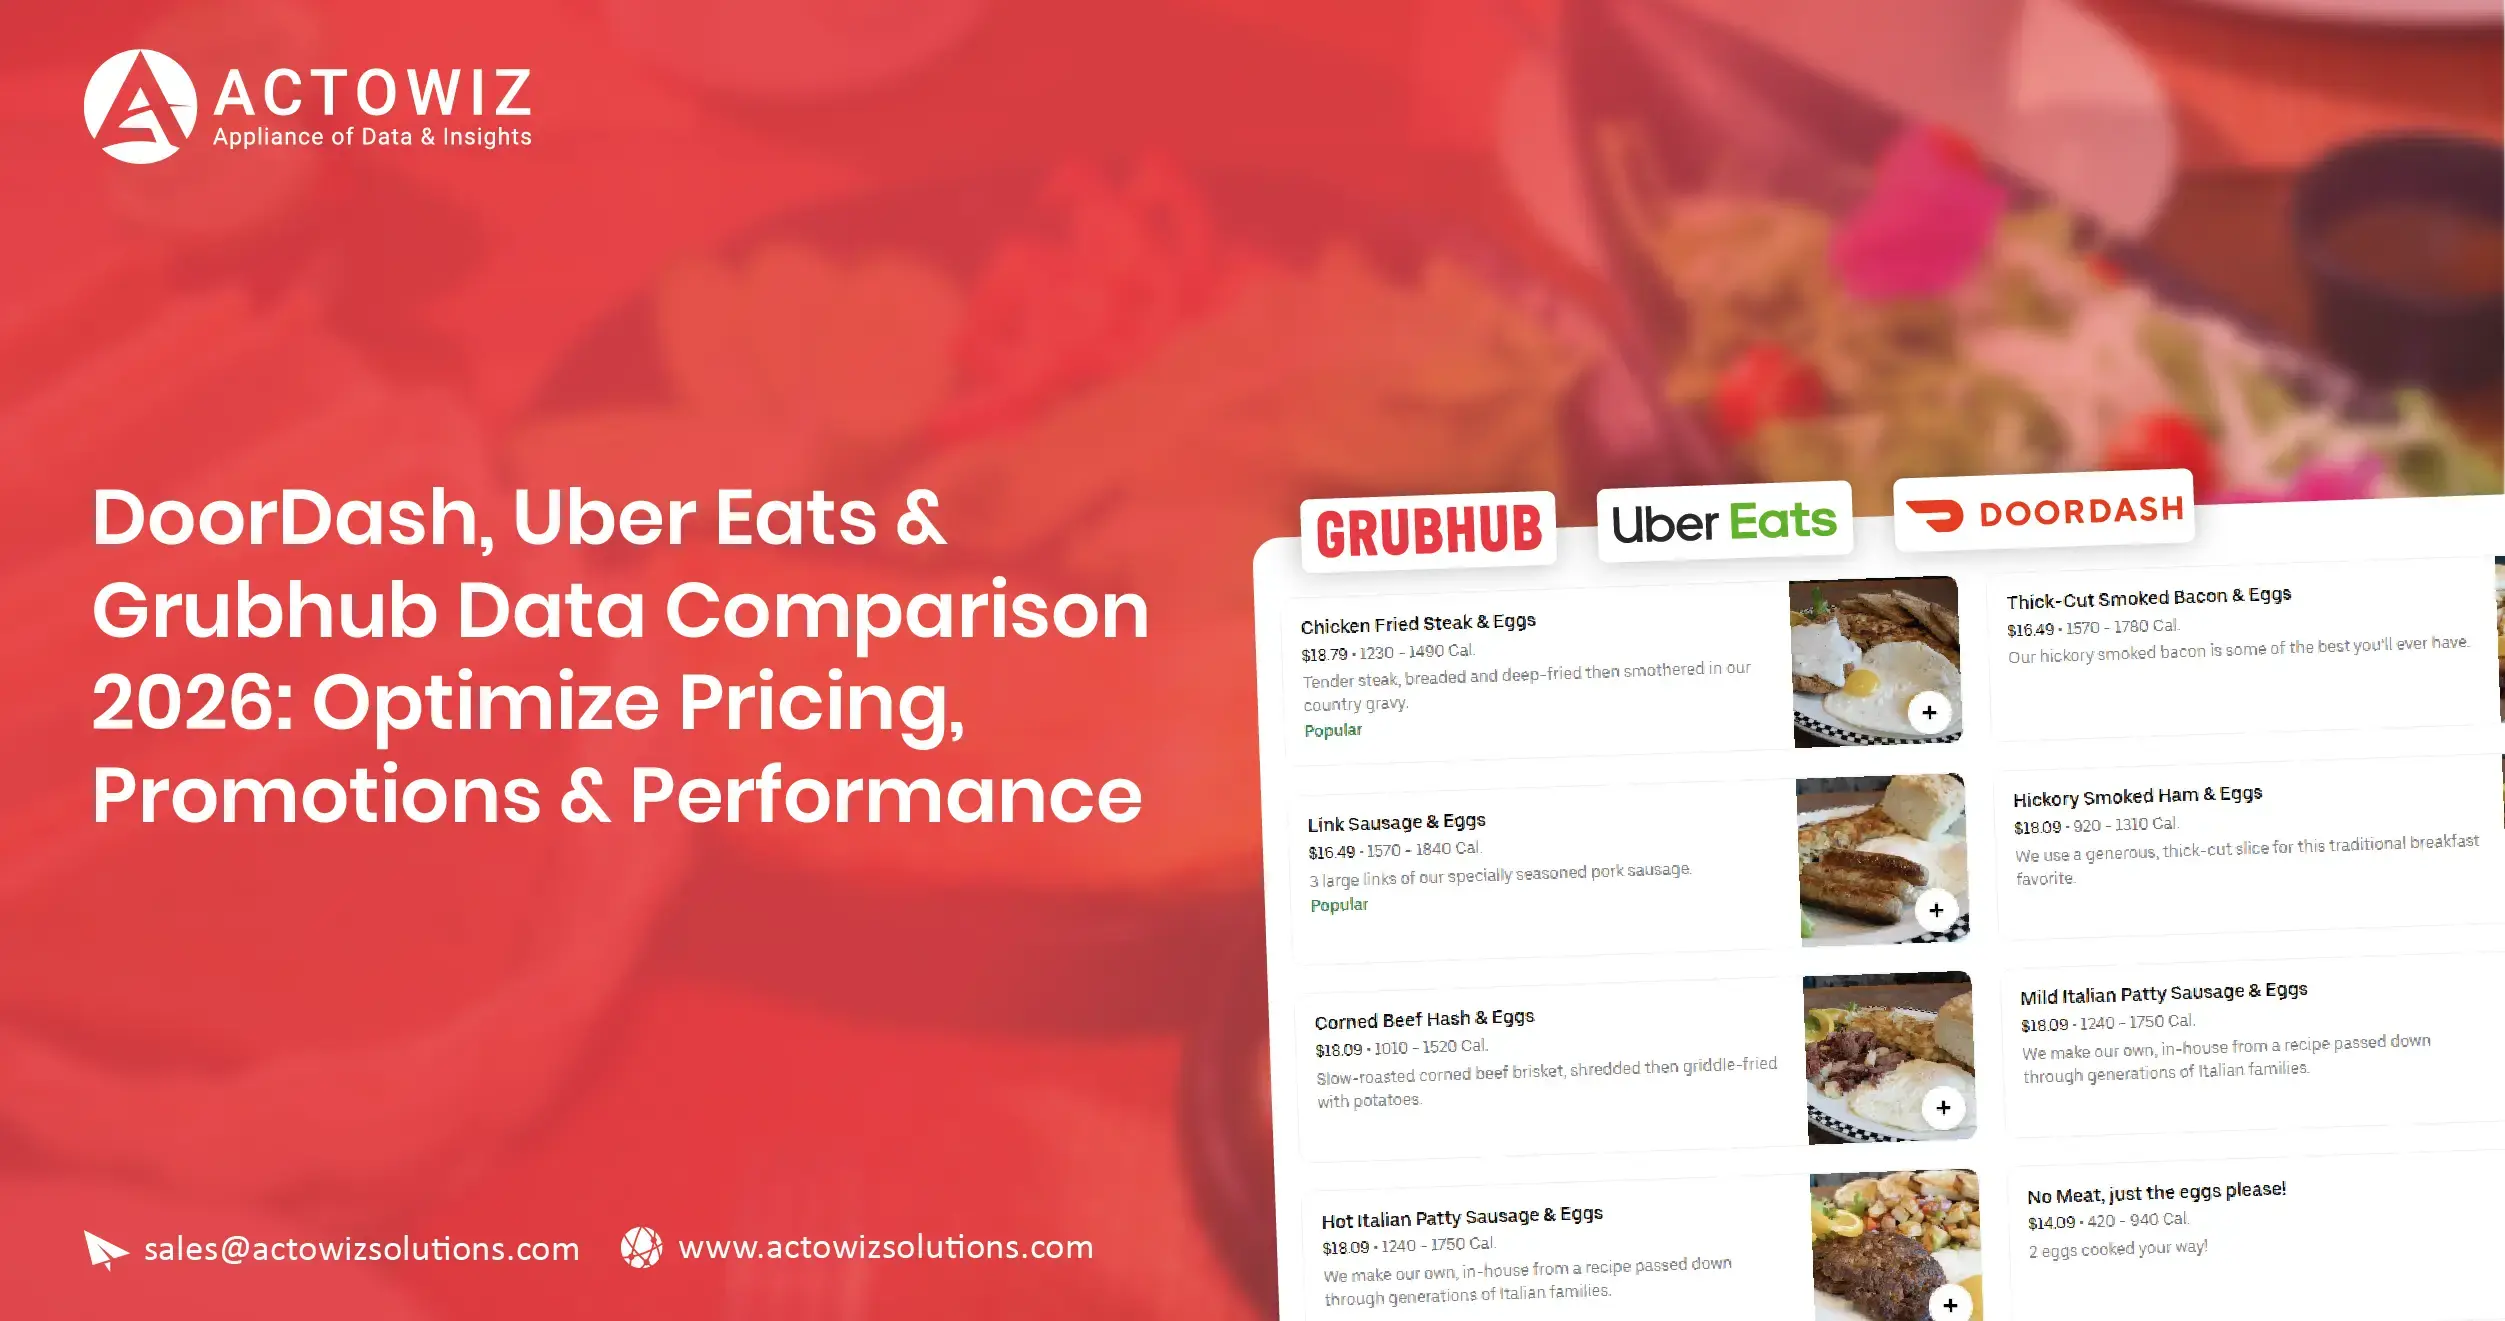
Food delivery marketplaces have become highly dynamic environments where menu prices, delivery fees, promotions, restaurant availability, ratings, and customer-facing offers can change frequently. For restaurants, food brands, aggregators, and marketplace teams, relying on occasional manual checks makes it difficult to understand these changes consistently across multiple platforms.
DoorDash, Uber Eats & Grubhub Data Comparison 2026 provides a structured way to compare restaurant and marketplace data across major food-delivery platforms. A cross-platform dataset can reveal differences in listed prices, discounts, delivery charges, menus, restaurant coverage, ratings, and availability for the same locations or products.
The scale of these marketplaces makes automated data collection increasingly valuable. DoorDash reported 970 million total orders and $33.1 billion in Marketplace GOV in Q2 2026, with orders up 27% year over year. (DoorDash) Uber reported $27.46 billion in Delivery Gross Bookings in Q2 2026, up 26% year over year. (Uber Investor Relations) These figures demonstrate the scale of delivery activity that businesses may need to monitor when building competitive intelligence programs.
Actowiz Solutions combines Food Data Scraping Services with structured extraction, normalization, validation, and recurring monitoring to transform marketplace information into analytics-ready datasets.
Understanding the Competitive Food Delivery Landscape
The first challenge for brands is not simply collecting data—it is making information from different platforms comparable. Each marketplace can display restaurants, menus, fees, promotions, delivery estimates, and product attributes differently.
Platform-Level Visibility
DoorDash vs Uber Eats vs Grubhub Data Analysis can help organizations create a common framework for comparing restaurant-level and item-level information. A standardized dataset may include restaurant name, cuisine, location, menu category, item name, listed price, discount, delivery fee, service fee, rating, review count, availability, and estimated delivery time.
For example, a restaurant might list the same entrée at different prices across marketplaces. One platform may offer a percentage discount, another may provide free delivery through a membership program, while another may show a different customer-facing fee structure.
This makes simple price comparison insufficient. Brands need to calculate the complete customer-facing proposition.
Example Data Comparison Framework
| Data Attribute |
Platform A |
Platform B |
Platform C |
| Listed Menu Price |
$18.99 |
$19.49 |
$18.99 |
| Promotional Discount |
15% |
$5 off |
None |
| Delivery Fee |
$0–$3.99 |
$0–$4.99 |
$1.99–$5.99 |
| Restaurant Rating |
4.6 |
4.5 |
4.4 |
| Review Volume |
2,850 |
2,420 |
1,960 |
| Availability |
Available |
Available |
Limited |
Illustrative comparison framework; actual values vary by restaurant, location, time, membership status, and promotion.
The value of this approach is consistency. Instead of reviewing isolated marketplace pages, businesses can create recurring datasets that support historical comparisons and operational analysis.
2020–2026 Market Evolution
From 2020 onward, digital food ordering experienced a major expansion as consumers became more accustomed to ordering meals through websites and mobile applications. During 2021 and 2022, restaurants increasingly treated digital marketplaces as important customer-acquisition and order channels. By 2023 and 2024, the focus expanded from basic availability to pricing, promotions, customer ratings, delivery speed, and marketplace visibility.
In 2025, platform scale continued to expand. DoorDash reported 903 million orders in Q4 2025, up 32% year over year, while Marketplace GOV reached $29.7 billion. (DoorDash) Uber's Q4 2025 Delivery Gross Bookings reached $25.43 billion, up 26% year over year. (Uber Investor Relations) These figures indicate why marketplace monitoring increasingly requires automated collection rather than periodic manual observation.
In 2026, delivery marketplaces are also expanding beyond traditional restaurant ordering into grocery and retail. Uber reported that its Grocery & Retail business had reached $15 billion in annualized Gross Bookings and continued growing at roughly 40% year over year for multiple quarters. (Uber Investor Relations) For brands, this broader marketplace environment increases the number of products, locations, promotions, and customer-facing variables that can be monitored.
Turning Marketplace Data Into Commercial Intelligence
A second challenge is transforming raw marketplace information into business intelligence. A large dataset has limited value if organizations cannot identify recurring patterns, price movements, promotional behavior, and restaurant-level changes.
DoorDash, Uber Eats & Grubhub Market Intelligence can be developed around several analytical dimensions:
- Price benchmarking
- Restaurant assortment comparison
- Promotional monitoring
- Delivery-fee tracking
- Rating and review analysis
- Menu assortment monitoring
- Location-level coverage
- Availability monitoring
- Delivery-time comparison
- Competitor restaurant tracking
Building a Comparable Dataset
The dataset can be structured around multiple dimensions so analysts can filter information by platform, city, restaurant, cuisine, menu category, product, date, and time.
| Intelligence Metric |
Business Use |
| Average Menu Price |
Price benchmarking |
| Discount Percentage |
Promotion analysis |
| Delivery Fee |
Customer cost comparison |
| Service Fee |
Checkout-cost analysis |
| Restaurant Count |
Marketplace coverage |
| Average Rating |
Reputation benchmarking |
| Review Count |
Customer engagement indicator |
| Availability |
Assortment monitoring |
| Delivery Estimate |
Service-level comparison |
| Menu Changes |
Assortment intelligence |
A standardized schema also makes it easier to combine data from multiple cities. A restaurant operating in New York, Chicago, Los Angeles, or another market can compare marketplace visibility by geography without manually rebuilding spreadsheets.
2020–2026 Market Evolution
Between 2020 and 2022, businesses primarily needed visibility into restaurant availability and digital ordering. As competition intensified, the focus moved toward promotional strategy, pricing consistency, and customer experience. By 2023, marketplace data became increasingly useful for benchmarking competitors across neighborhoods and cities.
During 2024 and 2025, broader marketplace ecosystems created additional monitoring requirements. DoorDash reported serving more than 50 million monthly active users and more than 1 million merchants following its Deliveroo acquisition in 2025, with annualized Marketplace GOV exceeding $100 billion across more than 40 countries. (DoorDash)
In 2026, the competitive intelligence opportunity extends beyond restaurants. Delivery platforms increasingly connect food, grocery, retail, memberships, advertising, and local commerce. Uber's Q2 2026 Delivery Gross Bookings reached $27.46 billion, representing 26% year-over-year growth. (Uber Investor Relations) This expansion means that businesses can use marketplace datasets not only to monitor restaurant competitors but also to understand broader local-commerce positioning.
Creating Reliable Restaurant-Level Data
Restaurants can change menus, prices, descriptions, images, operating hours, and promotions frequently. A manual process may capture one moment but miss changes that occur later in the day or week.
DoorDash, Uber Eats & Grubhub Restaurant Data Scraping enables recurring collection of restaurant-level information at scale. Depending on the project requirements and publicly accessible information, datasets can capture:
- Restaurant name
- Restaurant ID or listing identifier
- Cuisine type
- Address and location
- Menu categories
- Menu item names
- Item descriptions
- Item prices
- Discounts
- Ratings
- Review counts
- Availability
- Delivery estimates
- Restaurant operating status
- Promotional offers
- Product images
- Marketplace URL
Sample Restaurant Dataset
| Restaurant |
Cuisine |
Item |
Price |
Rating |
Reviews |
Availability |
| Restaurant A |
Italian |
Margherita Pizza |
$16.99 |
4.7 |
3,240 |
Available |
| Restaurant B |
Mexican |
Chicken Bowl |
$14.49 |
4.5 |
2,110 |
Available |
| Restaurant C |
Asian |
Pad Thai |
$15.99 |
4.6 |
1,870 |
Limited |
Illustrative dataset structure.
The data can then be normalized so that similar restaurants and menu items can be compared across platforms. For example, variations in restaurant names can be standardized, currencies can be normalized where applicable, and menu categories can be mapped into common taxonomies.
2020–2026 Market Evolution
The restaurant-data environment changed substantially between 2020 and 2026. During the early period, businesses often relied on marketplace listings mainly for digital presence and basic menu visibility. As ordering behavior matured, restaurant operators and brands began paying greater attention to price consistency, promotions, ratings, reviews, and availability.
From 2023 onward, marketplace competition became increasingly data-intensive. Restaurants needed to understand not just whether competitors were listed, but how competitors positioned similar products. This created demand for recurring collection across locations and platforms.
In 2025, DoorDash's quarterly order volumes reached 903 million in Q4, while Uber's Delivery Gross Bookings reached $25.43 billion in the same quarter. (DoorDash) These platform-scale metrics highlight why manual restaurant monitoring becomes difficult when organizations need to observe thousands of listings.
By 2026, automated restaurant data collection can support larger monitoring programs covering multiple cities, restaurant categories, menu groups, and competitor sets. Historical snapshots also allow businesses to distinguish temporary changes from persistent marketplace trends.
Tracking Price Changes and Promotional Behavior
Price is one of the most visible competitive variables on food-delivery marketplaces, but it is rarely static. Restaurants may adjust prices, create bundles, launch discounts, remove offers, or change item availability.
DoorDash, Uber Eats & Grubhub Menu price monitoring helps businesses establish a recurring process for identifying these changes.
What Can Be Monitored?
| Variable |
Monitoring Objective |
| Base Menu Price |
Detect price changes |
| Discount |
Track promotional intensity |
| Coupon |
Identify offer availability |
| Bundle Price |
Compare meal economics |
| Delivery Fee |
Track customer-facing costs |
| Service Fee |
Monitor checkout differences |
| Item Availability |
Identify assortment changes |
| New Items |
Detect menu expansion |
| Removed Items |
Identify assortment reduction |
| Time-Based Offers |
Track promotional timing |
A useful monitoring system should preserve historical records. If an item costs $15.99 today and $16.99 next month, the dataset should retain both observations rather than overwrite the original value.
This enables calculations such as:
Price Change % = ((New Price − Previous Price) / Previous Price) × 100
Businesses can apply this formula across thousands of products to identify systematic pricing movements.
2020–2026 Market Evolution
From 2020 to 2022, promotional activity became an important component of digital restaurant acquisition and customer retention. Restaurants experimented with free delivery, percentage discounts, bundled meals, first-order promotions, and platform-specific offers.
From 2023 to 2024, businesses increasingly needed to understand the relationship between base prices and promotional prices. A simple statement such as "20% off" does not provide complete insight without knowing the original price, minimum order value, eligible products, and other conditions.
In 2025, platform scale made promotional monitoring even more relevant. DoorDash reported Q4 Marketplace GOV of $29.68 billion, while Uber reported Q4 Delivery Gross Bookings of $25.43 billion. (DoorDash)
During 2026, recurring price monitoring can help brands identify changes faster. Instead of depending on monthly reviews, businesses can configure daily, weekly, or event-based collection schedules. Historical data can then reveal whether competitors are using persistent price changes, short-term discounts, seasonal campaigns, or location-specific offers.
Scaling Automated Marketplace Collection
Large marketplace datasets require scalable infrastructure. Collecting a small number of restaurant pages manually may be manageable, but monitoring thousands of restaurants across multiple cities creates challenges around frequency, data quality, duplicate records, and changing page structures.
DoorDash data scraping can be incorporated into a broader multi-platform collection workflow alongside other food-delivery sources. The same principle applies to menu, restaurant, location, promotion, availability, and rating datasets.
Example Scalable Architecture
| Layer |
Function |
| Source Discovery |
Identify restaurants and listings |
| Collection |
Capture publicly accessible marketplace data |
| Parsing |
Extract required fields |
| Normalization |
Standardize names, prices, categories |
| Validation |
Check missing or inconsistent values |
| Deduplication |
Remove repeated records |
| Storage |
Maintain historical datasets |
| Scheduling |
Run recurring collection |
| Delivery |
Provide structured output |
| Analytics |
Enable dashboards and reporting |
For large projects, the system can also use location grids, restaurant identifiers, category filters, and incremental collection logic to reduce unnecessary processing.
The objective is not merely to collect more records. It is to create a reliable pipeline that can repeatedly produce comparable datasets.
2020–2026 Market Evolution
The first phase of food-delivery data collection largely focused on extracting basic restaurant and menu information. Between 2020 and 2022, businesses were increasingly interested in establishing digital visibility as ordering behavior shifted online.
By 2023 and 2024, larger organizations needed scheduled extraction and historical storage. This allowed analysts to track menu changes, pricing movements, restaurant openings, closures, and promotional campaigns over time.
In 2025, DoorDash reported more than 56 million monthly active users at year-end and more than 35 million members across DashPass, Wolt+, and Deliveroo Plus. (DoorDash) Such scale reinforces the need for automated collection when organizations want broad marketplace coverage.
In 2026, automation becomes particularly relevant as food delivery overlaps with grocery and retail. Uber's Delivery segment generated $27.46 billion in Q2 2026 Gross Bookings, up 26% year over year. (Uber Investor Relations) For data teams, scalable pipelines provide a foundation for monitoring growing numbers of products, restaurants, locations, and marketplace variables.
Using Delivery Data to Understand Customer-Facing Differences
Delivery data provides another layer of competitive intelligence. Customers do not evaluate restaurants based only on menu prices. Their final decision can also depend on delivery fees, estimated arrival times, promotions, restaurant ratings, availability, and total checkout cost.
Uber Eats food delivery data can therefore be incorporated into a multi-platform dataset that evaluates customer-facing marketplace variables.
Delivery Intelligence Framework
| Metric |
Example Business Question |
| Delivery Fee |
How does the customer-facing fee vary? |
| Estimated Delivery Time |
Which listings provide faster estimates? |
| Restaurant Availability |
Is the restaurant available at the same time? |
| Menu Price |
Does the same item have a different listed price? |
| Promotions |
Which offers are active? |
| Rating |
How is the restaurant positioned? |
| Reviews |
How much customer feedback exists? |
| Service Fee |
How does the additional cost vary? |
It is important to distinguish platform-reported financial metrics from customer-facing marketplace observations. For example, Uber reported Delivery Gross Bookings of $27.46 billion in Q2 2026, while its definition of Gross Bookings includes the total dollar value of Delivery orders and applicable taxes, tolls, and fees, without adjustments for consumer discounts and refunds. (Uber Investor Relations) This is different from the price a specific customer sees for an individual restaurant order.
2020–2026 Market Evolution
Between 2020 and 2022, delivery speed and availability became increasingly important as consumers shifted toward online ordering. Restaurants began treating estimated delivery time, order reliability, and marketplace ratings as meaningful parts of their digital presence.
From 2023 to 2025, the competitive landscape expanded. Delivery marketplaces increasingly connected restaurant ordering with memberships, grocery, retail, advertising, and other services. Uber's Q4 2025 Delivery Gross Bookings were $25.43 billion, up 26% year over year. (Uber Investor Relations)
In Q2 2026, Uber reported Delivery Gross Bookings of $27.46 billion, with Delivery segment growth of 26% year over year. (Uber Investor Relations) At the same time, DoorDash reported 970 million total orders in Q2 2026. (DoorDash)
These figures illustrate the size of the delivery ecosystem. For businesses, structured delivery datasets can help separate menu-price differences from delivery-cost differences and provide a more complete view of marketplace positioning.
How Actowiz Solutions Can Help?
Actowiz Solutions helps businesses build structured, recurring datasets from publicly accessible web and mobile-app sources. The objective is to convert fragmented marketplace information into consistent data that can support competitive analysis, pricing intelligence, restaurant monitoring, and operational decision-making.
Our approach can combine Web Scraping, Mobile App Scraping, and Real-time dataset delivery based on project requirements.
1. Multi-Platform Data Collection
Actowiz Solutions can design collection workflows for multiple marketplace sources so businesses can compare restaurants, menu items, prices, promotions, availability, ratings, and delivery information within a consistent schema.
2. Restaurant and Menu Extraction
Required fields can be mapped into structured datasets covering restaurant information, menu categories, products, prices, descriptions, ratings, reviews, availability, and other publicly accessible attributes.
3. Price and Promotion Tracking
Recurring collection can preserve historical observations and identify changes in base prices, promotional prices, discounts, bundles, and other customer-facing offers.
4. Location-Based Monitoring
Data collection can be configured around cities, ZIP codes, neighborhoods, delivery zones, restaurant locations, or other geographic parameters relevant to the project.
5. Data Normalization and Validation
Raw marketplace information can contain inconsistent names, categories, formats, and duplicate listings. Actowiz Solutions can normalize and validate records before delivery.
6. Historical Data
Historical snapshots allow businesses to compare current observations against previous records. This can support trend analysis, price-change detection, menu-change monitoring, and promotional history.
7. Analytics-Ready Delivery
Datasets can be structured for integration with spreadsheets, databases, BI platforms, analytics systems, or internal applications. Depending on requirements, outputs can be provided through suitable structured formats and delivery mechanisms.
8. Scalable Monitoring
Whether the requirement involves a targeted competitor set or a large restaurant universe, the collection architecture can be designed around frequency, geography, fields, and historical retention requirements.
The broader value of DoorDash, Uber Eats & Grubhub Data Comparison 2026 is therefore not limited to collecting marketplace records. It is about establishing a repeatable data foundation that allows businesses to understand how marketplace conditions change and where commercial opportunities or visibility gaps may exist.
Conclusion
Food-delivery marketplaces are increasingly data-rich and highly dynamic. Restaurant prices, menus, promotions, delivery fees, ratings, availability, and delivery estimates can vary across platforms and locations. A structured monitoring strategy gives businesses a way to observe these variables systematically rather than relying on occasional manual checks.
DoorDash, Uber Eats & Grubhub Data Comparison 2026 can support cross-platform benchmarking, restaurant intelligence, menu monitoring, promotional analysis, and competitive research. The combination of automated collection, normalization, historical storage, and analytics-ready delivery can help businesses turn fragmented marketplace information into usable datasets.
The continued scale of these platforms reinforces the importance of structured data. DoorDash reported 970 million orders in Q2 2026, while Uber reported $27.46 billion in Delivery Gross Bookings during the same quarter. (DoorDash) These are company-reported platform metrics and should not be interpreted as directly comparable measures because the companies define their metrics differently.
For restaurants, food brands, aggregators, and data-driven businesses, the practical opportunity lies in consistently tracking the variables that matter to their specific market, competitors, products, and locations.
You can also reach us for all your mobile app scraping, data collection, web scraping , and instant data scraper service requirements!

 Pricing & Promotions
MAP Violations Brand Protection Counterfeit Detection Price Intelligence AI HOT Data Intelligence
Pricing & Promotions
MAP Violations Brand Protection Counterfeit Detection Price Intelligence AI HOT Data Intelligence Brand & Intelligence
Share of Search Content Audit & PDP Reviews & Ratings Retail Media Buy Box Monitoring Social Commerce HOT Live Commerce NEW Agentic Commerce NEW
Brand & Intelligence
Share of Search Content Audit & PDP Reviews & Ratings Retail Media Buy Box Monitoring Social Commerce HOT Live Commerce NEW Agentic Commerce NEW Digital Shelf & Search
Assortment Planning Competitive Benchmarking Product Availability Q-Commerce NEW
Digital Shelf & Search
Assortment Planning Competitive Benchmarking Product Availability Q-Commerce NEW AssortmentE-commerce Intelligence Hyperlocal Insights POI & Store Locator DTC Brand Analytics NEW
 For Retailers
 E-Commerce Dashboard
 Flipkart Insights (Live) #1
 Grocery Intelligence
.svg) Grocery Price (U.S.)
Grocery Price (U.S.)
.svg) Quick Commerce (India) HOT
Quick Commerce (India) HOT
 Food & Restaurant
 Fashion Intelligence
 Automotive
 Travel & Hospitality
 Real Estate
 Food Delivery Intelligence NEW
 OTT & Streaming NEW
 By Use Case
 Pricing Intelligence
 Digital Shelf Analytics
 MAP Monitoring HOT
 Cross-Border Price Parity NEW
 Share of Search
 Review Sentiment
 Kitchen Market Gaps NEW
 Dynamic Pricing / AI Repricing NEW
 Promotions & Deals Alerts NEW
 B2B / POI & Lead Data NEW
 By Region🇮🇳 India 🇺🇸 USA 🇦🇪 Middle East 🇬🇧 UK 🇦🇺 Australia 🌏 SE Asia 🇪🇺 Europe 🌎 LATAMIndia
 Flipkart Real-Time Insights
 Quick Commerce — Zepto · Blinkit
 Pincode Price Tracker
Middle East
Pincode Price Tracker
Middle East GCC Q-Commerce — Talabat · Noon NEW
UK & Australia
GCC Q-Commerce — Talabat · Noon NEW
UK & Australia UK Grocery — Tesco, Sainsbury's, Asda
 AU Grocery — Coles & Woolworths NEW
 Marketplace Scrapers
Amazon API TikTok Shop API HOT Uber Eats API Airbnb API Zepto / Blinkit API Instacart API NEW Talabat API NEW
Marketplace Scrapers
Amazon API TikTok Shop API HOT Uber Eats API Airbnb API Zepto / Blinkit API Instacart API NEW Talabat API NEW Developer APIsWeb Extract API Reviews API SERP API Pricing Webhook NEW
 Universal APIsStreaming Crawl API Scheduler Realtime Alerts Webhook Delivery 🐍 Python SDK 💚 Node.js SDK
 Delivery & SDKs
 Knowledge Center
Digital Shelf Playbook MAP Compliance Guide Pricing Intel Guide Scraping Compliance TikTok Shop Guide NEW Cross-Border Guide NEW
Knowledge Center
Digital Shelf Playbook MAP Compliance Guide Pricing Intel Guide Scraping Compliance TikTok Shop Guide NEW Cross-Border Guide NEW Guides & Playbooks
🎉 Seasonal & event tracking NEWBlack Friday pricing report Festive season, India Ramadan, GCC grocery All seasonal reportsSample Datasets HOT ROI Calculator NEW API Postman Collection Demo Dashboards Free API Playground NEW Press Kit
Guides & Playbooks
🎉 Seasonal & event tracking NEWBlack Friday pricing report Festive season, India Ramadan, GCC grocery All seasonal reportsSample Datasets HOT ROI Calculator NEW API Postman Collection Demo Dashboards Free API Playground NEW Press Kit Downloads & Tools
Trust Center About Us FAQs Careers
Downloads & Tools
Trust Center About Us FAQs Careers Trust & CompanyRetail shelf research NEWRetail shelf research






































 4.8/5 Average Rating
 50+ Video Testimonials
 92% Client Retention
 50+ Countries Served