Introduction
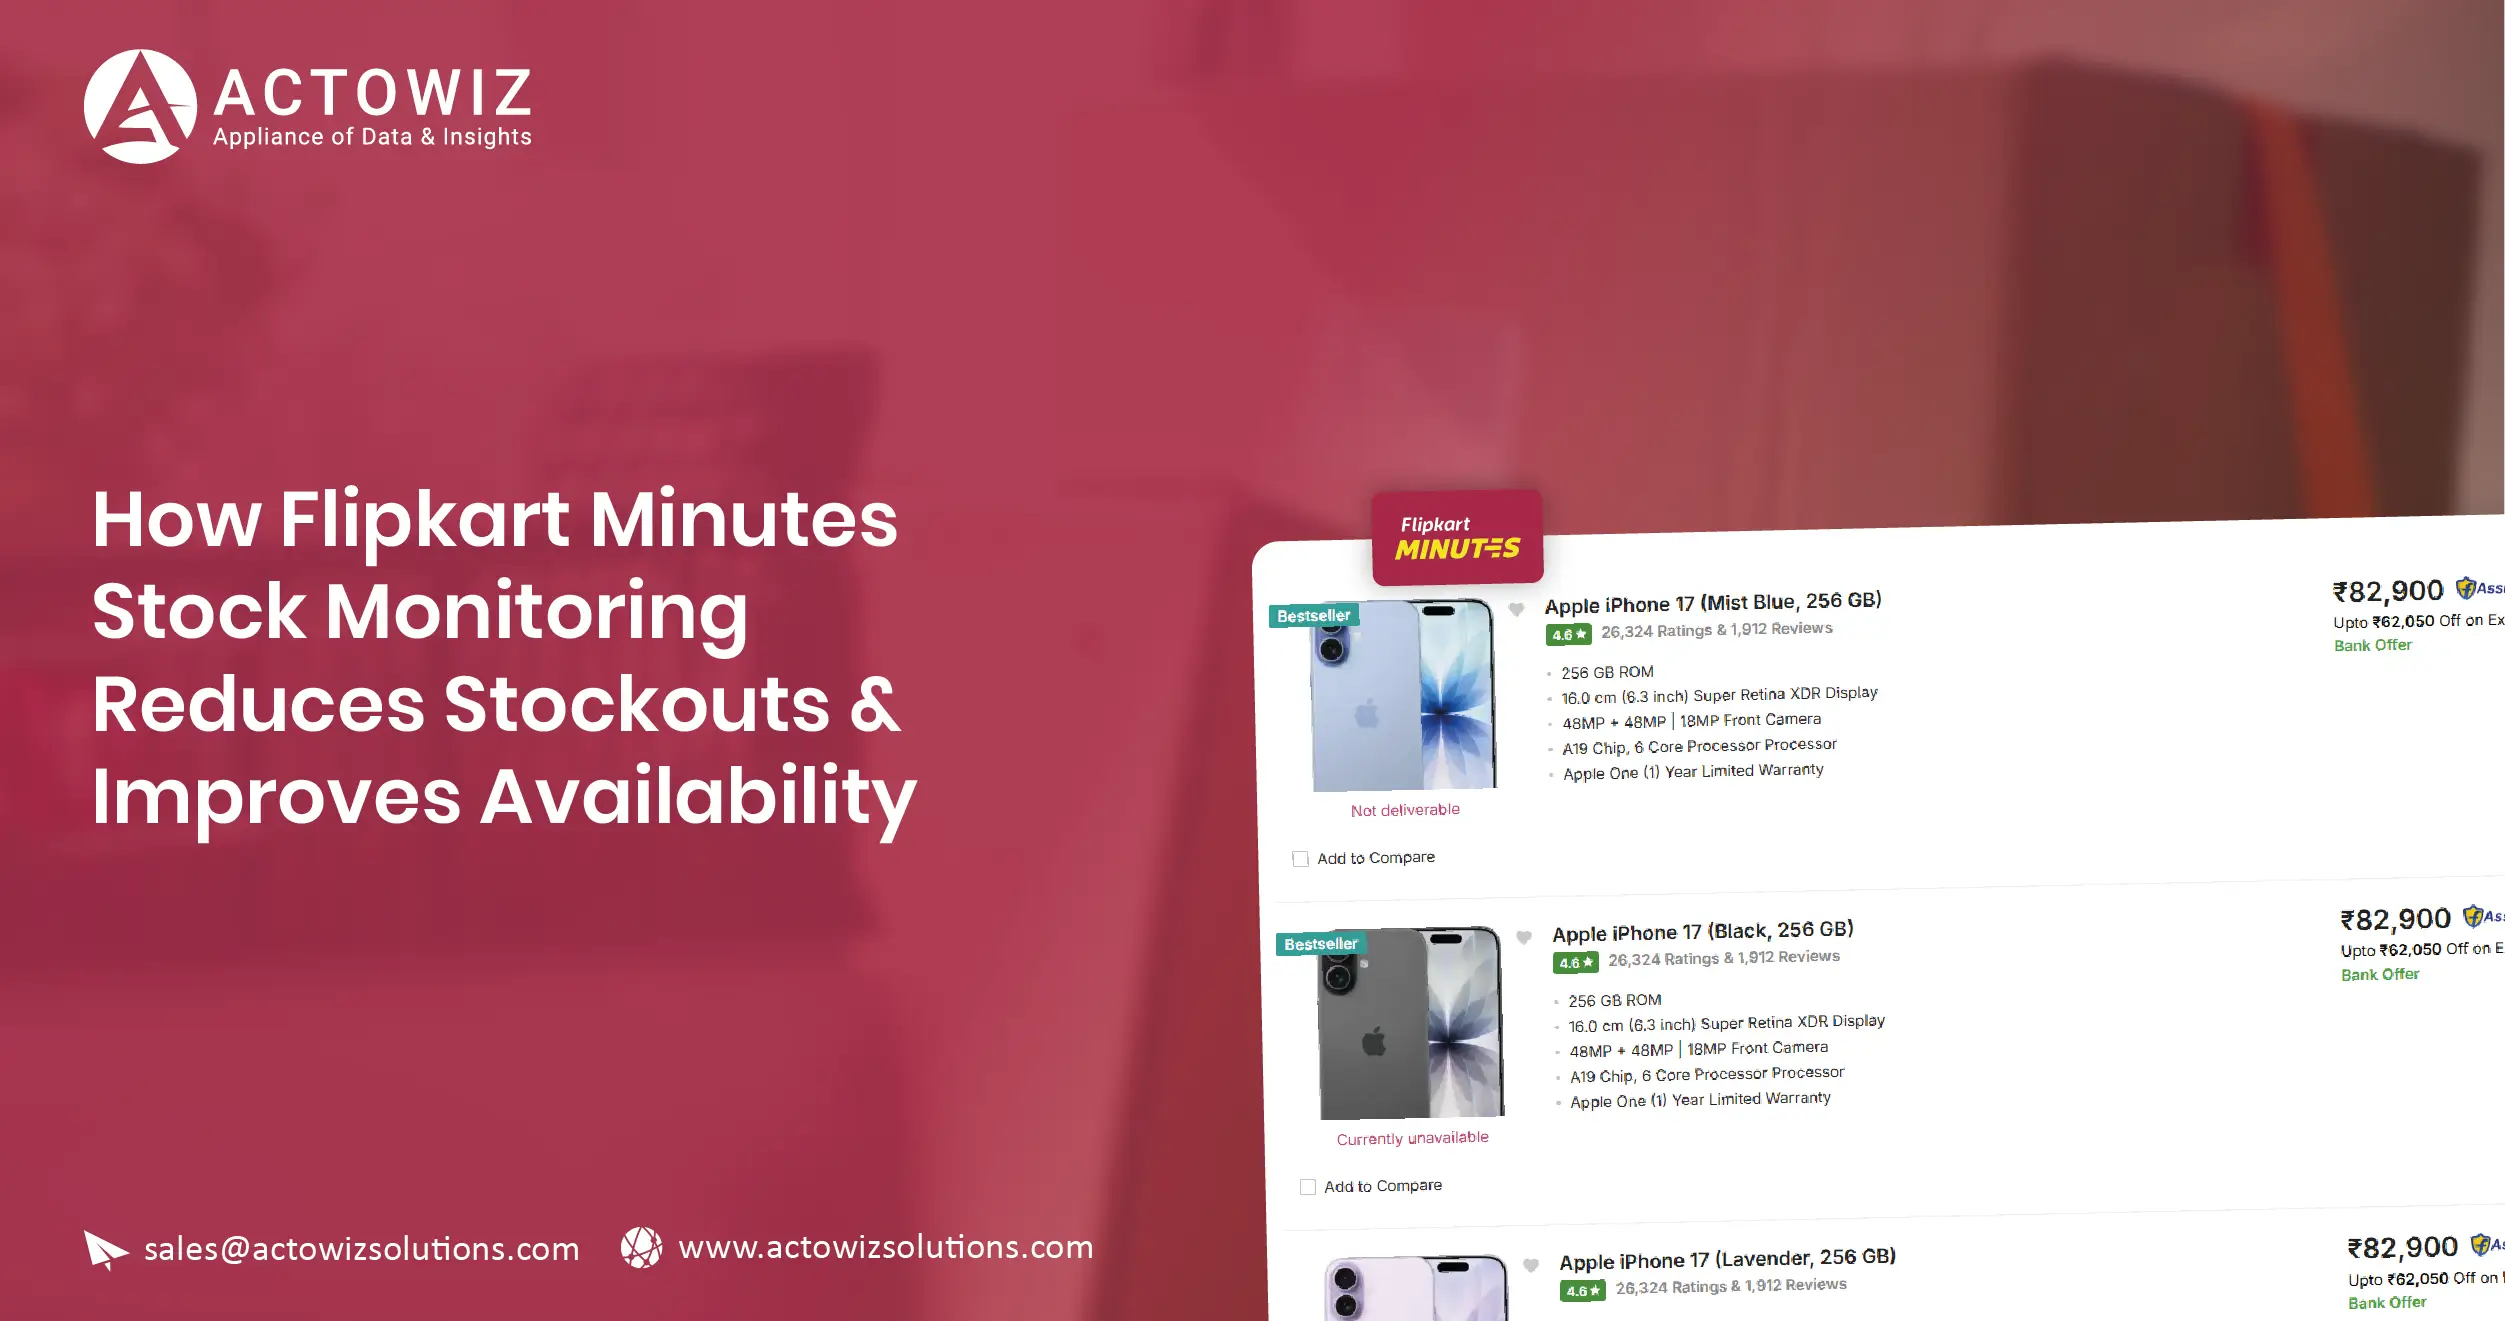
Flipkart Minutes Real-Time Stock Monitoring helps brands reduce stockouts by continuously observing product availability, inventory signals, pricing, and location-level changes across a rapidly expanding quick-commerce network. For brands selling fast-moving products, delayed availability data can lead to missed sales, poor replenishment decisions, and weaker digital shelf visibility. Flipkart Minutes crossed 1,000 micro-fulfillment centers across 130+ cities and 8,000+ PIN codes by June 2026, making location-level monitoring increasingly important. (Flipkart Stories)
Brands can use Quick Commerce Data Scraping Services to convert frequently changing product and availability information into structured datasets. This enables teams to identify unavailable SKUs, compare stock conditions between locations, understand pricing movements, prioritize replenishment, and evaluate competitor availability. For FMCG, grocery, personal care, electronics, and other fast-moving categories, the objective is simple: know what is available, where it is available, and when availability changes.
How Can Brands Build Better Visibility Into Product Stock?
Flipkart Minutes Product Stock Data Collection gives brands a structured way to observe product-level availability across cities, PIN codes, categories, and fulfillment locations. Instead of relying on occasional manual checks, businesses can establish recurring collection schedules and create historical records of stock status.
This is particularly important because the platform has expanded rapidly. Flipkart stated in June 2026 that its Minutes network had reached 1,000 micro-fulfillment centers across more than 130 cities and 8,000+ PIN codes. The company also reported that orders had grown fivefold over the previous year. (Flipkart Stories)
Real-World Growth Snapshot
| Metric |
2025 |
2026 |
| Cities |
19 |
130+ |
| PIN codes |
2,900+ |
8,000+ |
| Micro-fulfillment centers |
Not publicly stated at this milestone |
1,000 |
| Product categories |
900+ |
Expanded beyond daily essentials |
| Order growth |
— |
5X YoY reported by Flipkart |
Source: Flipkart corporate announcements, 2025–2026. (Flipkart Stories)
What Stock Collection Should Capture
A practical monitoring framework can capture:
- Product name and brand
- SKU or product identifier where available
- Category and subcategory
- Listed price
- Discount or offer
- Availability status
- Location or PIN code
- Product URL
- Collection timestamp
- Pack size or variant
- Seller or fulfillment information where available
2020–2026 Market Evolution
Between 2020 and 2026, Indian digital retail moved from conventional e-commerce fulfillment toward increasingly localized and rapid delivery models. The quick-commerce category accelerated this transition by placing inventory closer to consumers through dark stores and micro-fulfillment centers. Flipkart Minutes launched in August 2024, initially operating across 19 cities and more than 2,900 PIN codes by its first anniversary in 2025. By June 2026, its footprint had expanded to more than 130 cities and 8,000+ PIN codes. Flipkart also reported 900+ product categories in 2025 and said Tier-II and Tier-III markets were becoming important growth contributors. (Flipkart Stories) This expansion changes the data problem for brands: availability is no longer a single marketplace-level attribute. The same product can be available in one location and unavailable in another. Consequently, businesses need historical, location-aware observations rather than isolated product-page checks.
How Can Brands Monitor SKU-Level Availability?
Flipkart Minutes SKU Availability Monitoring allows brands to move from broad marketplace visibility to individual-product analysis. A product catalog may contain hundreds or thousands of SKUs, while each SKU can behave differently depending on demand, location, replenishment cycles, and fulfillment capacity.
For category managers and supply-chain teams, the important question is not simply whether a brand is listed. It is whether the right SKU is available to the customer at the right location.
Availability Metrics
Monitoring Metric
| Monitoring Metric |
Business Question |
| In-stock status |
Can customers purchase the SKU? |
| Out-of-stock status |
Which products are currently unavailable? |
| Location coverage |
Where is the SKU available? |
| Variant availability |
Which pack sizes or variants are missing? |
| Price |
Has the selling price changed? |
| Promotion |
Is an offer affecting demand? |
| Timestamp |
When was the availability state observed? |
This structure enables businesses to create an SKU availability history rather than relying on a current snapshot.
Why SKU-Level Tracking Matters
Suppose a brand has ten variants of a product. If three variants become unavailable in a high-demand location, overall catalog availability may still appear healthy. A SKU-level system reveals the underlying gap.
It can also help identify:
- Repeatedly unavailable SKUs
- Location-specific stockouts
- Popular variants with frequent shortages
- Products that remain available while competitors disappear
- Availability changes following promotions
- Seasonal stock pressure
2020–2026 Market Evolution
SKU-level monitoring became increasingly valuable as online assortment expanded and retailers moved toward faster fulfillment. During the early 2020s, brands primarily focused on product listings, prices, ratings, and marketplace positioning. The growth of quick commerce added a new dimension: localized availability. Flipkart Minutes' 2025 disclosure showed more than 900 categories, while its 2026 network had expanded across 130+ cities and 8,000+ PIN codes. (Flipkart Stories) In September 2026, reports citing UBS research indicated that Minutes had surpassed 1,000 dark stores across roughly 120–130 cities, with network-wide stores handling around 800–1,000 orders per day and mature stores reaching approximately 1,000–1,500 orders daily. (ETRetail.com) As transaction density increases, SKU-level visibility becomes more important because even short periods of unavailability can occur within highly localized demand environments.
How Does Inventory Tracking Help Reduce Stockouts?
Flipkart Minutes Inventory & Stock Tracking helps businesses identify recurring availability problems and connect them with product, location, and timing patterns.
A simple historical dataset can answer questions such as:
- Which products experience the most stockouts?
- Which locations have persistent availability gaps?
- How frequently does a product move from available to unavailable?
- Are stockouts concentrated around promotional periods?
- Which products recover quickly after becoming unavailable?
- Which SKUs require closer replenishment attention?
Example Monitoring Framework
| Dimension |
Tracking Frequency |
Business Use |
| Product availability |
Recurring |
Detect stockouts |
| Price |
Recurring |
Identify pricing changes |
| Location |
Recurring |
Compare geographic availability |
| Category |
Daily/recurring |
Detect assortment gaps |
| Promotions |
Recurring |
Link offers with availability |
| Historical status |
Continuous dataset |
Identify recurring patterns |
The important principle is trend visibility rather than one-time observation. A single unavailable result tells a business that a product is unavailable at that moment. Historical observations can reveal whether the issue is temporary, recurring, location-specific, or widespread.
From Stockout Detection to Action
A structured workflow can assign priority levels:
High priority: high-demand SKU + multiple locations unavailable
Medium priority: recurring stockout in selected locations
Low priority: isolated or short-duration availability interruption
This helps category and supply-chain teams focus on the inventory problems most likely to affect customer experience and sales.
2020–2026 Market Evolution
The quick-commerce model has increased the operational importance of inventory accuracy because customers expect products to be available immediately rather than waiting for conventional fulfillment windows. Flipkart's 2025 description of Minutes specifically highlighted real-time inventory synchronization, AI-led demand forecasting, dynamic routing, and smart substitutions as components supporting order fulfillment. (Flipkart Stories) By 2026, the network had reached 1,000 micro-fulfillment centers and 8,000+ PIN codes, while the company said it planned further expansion. (Flipkart Stories) This means brands increasingly need to distinguish between catalog presence and actual purchasability. Historical availability data can provide an external market perspective that complements internal sales and inventory systems. It can also help brands identify where competitor products remain available while their own products are absent.
How Can Brands Capture Product Availability Across Locations?
Scrape Flipkart Minutes Product Availability Data to build a location-aware view of assortment and inventory conditions. For quick-commerce businesses, availability can change according to geography because fulfillment is tied to nearby micro-fulfillment infrastructure.
This makes PIN-code-level monitoring particularly useful.
Location-Level Dataset Structure
| Data Field |
Example Purpose |
| PIN code |
Identify service location |
| City |
Geographic aggregation |
| Product |
Identify monitored SKU |
| Brand |
Brand-level analysis |
| Availability |
In-stock/out-of-stock status |
| Price |
Competitive comparison |
| Discount |
Promotion tracking |
| Timestamp |
Historical comparison |
| Product URL |
Verification |
| Category |
Assortment analysis |
Flipkart reported 8,000+ PIN codes in its June 2026 network milestone. (Flipkart Stories) That scale demonstrates why manually checking individual locations is impractical for organizations managing large product catalogs.
Availability Heatmaps
A structured dataset can support dashboards showing:
- High-availability locations
- Low-availability locations
- Repeated stockout zones
- Category-level gaps
- Brand availability by city
- Competitor availability differences
This gives commercial teams a geographic view of digital shelf performance.
2020–2026 Market Evolution
The geographic footprint of quick commerce has changed significantly since the beginning of the decade. The pandemic accelerated online grocery adoption, while the following years saw delivery networks increasingly organized around localized fulfillment. Flipkart Minutes entered the market in August 2024 and reported 19 cities and more than 2,900 PIN codes by August 2025. (Flipkart Stories) By June 2026, Flipkart reported 130+ cities and 8,000+ PIN codes, demonstrating how quickly the service expanded beyond its initial urban footprint. (Flipkart Stories) Flipkart also reported particularly strong growth in Tier-II and Tier-III markets, including a 42X year-on-year scale increase for those markets at the June 2026 milestone. (Flipkart Stories) For brands, this geographic expansion means national availability cannot be assumed from a single city or service area. Location-specific observations provide a more accurate basis for identifying distribution gaps and prioritizing market opportunities.
How Can Brands Connect Stock With Pricing Intelligence?
Flipkart Minutes Stock & Pricing Intelligence combines availability observations with price and promotional information. This is important because stock and pricing often influence each other.
A product that is heavily promoted may experience faster demand. Conversely, a product with limited availability may disappear from the digital shelf while competitors remain visible.
Stock and Price Monitoring Framework
| Signal |
What Brands Can Learn |
| Price movement |
Changes in market positioning |
| Discount |
Promotional intensity |
| Availability |
Supply visibility |
| Competitor price |
Relative competitiveness |
| Variant availability |
Assortment strength |
| Location |
Geographic pricing/availability differences |
| Timestamp |
Timing of changes |
Recent market reporting provides useful context. In September 2026, UBS research cited by ET Retail indicated that Minutes' net order value excluding mobile phones was around ₹500–₹530, compared with ₹518 for Blinkit. Including mobile purchases, Minutes' order value was higher, reflecting Flipkart's strength in electronics and mobile categories. (ETRetail.com)
These figures do not measure stock availability directly. They demonstrate, however, how the platform's category mix has expanded beyond traditional grocery and daily essentials.
Actionable Insight
Brands should analyze price and stock together rather than independently.
For example:
Price decreases + availability falls → investigate promotion-driven demand.
Price unchanged + repeated stockouts → investigate replenishment or distribution.
Competitor available + own SKU unavailable → prioritize availability recovery.
Own SKU available + competitor unavailable → evaluate potential competitive advantage.
2020–2026 Market Evolution
Quick commerce initially developed around groceries and daily essentials, but its assortment has expanded substantially. Flipkart reported 900+ categories in 2025, including daily essentials, beverages, personal care, and electronics, and highlighted nearly five lakh mobile units sold during its first year. (Flipkart Stories) By 2026, external reporting showed that Minutes was increasingly competing on order value while continuing to expand categories such as fresh produce, beauty, personal care, electronics, and other immediate-use products. (The Financial Express) This broader assortment increases the value of combining stock and pricing observations. A pricing dashboard without availability context can miss why a competitor's product is winning visibility. Similarly, stock monitoring without price context cannot fully explain changes in competitive positioning. Combining both signals creates a stronger framework for assortment, pricing, and market intelligence.
How Can Automated Data Collection Scale With Network Expansion?
Flipkart Minutes Data Scraping enables businesses to automate the collection of frequently changing marketplace information across products and locations. When combined with Flipkart Minutes Real-Time Stock Monitoring, the resulting workflow can turn marketplace observations into structured, analysis-ready datasets.
The objective is not simply to collect more data. It is to collect the right data consistently, validate it, timestamp it, and make it usable for business teams.
Recommended Data Pipeline
| Stage |
Activity |
Output |
| Discovery |
Identify products, categories, locations |
Monitoring universe |
| Collection |
Capture marketplace observations |
Raw data |
| Validation |
Check missing or inconsistent fields |
Clean data |
| Normalization |
Standardize products and attributes |
Structured dataset |
| Historical storage |
Preserve timestamped records |
Trend database |
| Analytics |
Identify stock and pricing patterns |
Business insights |
| Reporting |
Deliver dashboards/alerts |
Actionable intelligence |
Technology Layer
A scalable implementation can include:
Automated collection: Scheduled extraction reduces manual marketplace checks.
Data normalization: Product names, categories, pack sizes, prices, and availability statuses can be standardized.
Historical storage: Timestamped records preserve changes instead of overwriting previous observations.
Dashboards: Teams can monitor availability, stockout frequency, prices, and locations.
Alerts: Defined thresholds can trigger notifications for important availability changes.
API-ready delivery: Structured outputs can feed internal analytics systems, BI platforms, or data warehouses.
2020–2026 Market Evolution
Data collection requirements have evolved alongside India's digital commerce infrastructure. Earlier marketplace monitoring typically centered on catalog, price, seller, and review information. Quick commerce introduced a faster-moving layer where availability can vary by location and change repeatedly throughout the day. Flipkart Minutes' growth illustrates this transition: from 19 cities and 2,900+ PIN codes in 2025 to 1,000 micro-fulfillment centers, 130+ cities, and 8,000+ PIN codes by June 2026. (Flipkart Stories) By September 2026, industry reporting citing UBS placed the network above 1,000 dark stores across approximately 120–130 cities, with network-wide stores averaging 800–1,000 daily orders. (ETRetail.com) As the network grows, manual monitoring becomes increasingly difficult to maintain consistently. Automated data pipelines therefore become valuable for organizations that need historical, location-specific, and repeatable observations for commercial decision-making.
How Can Actowiz Solutions Help?
Actowiz Solutions can help brands build structured Flipkart Minutes Quick Commerce Intelligence workflows that transform frequently changing marketplace information into usable business datasets.
The approach can be designed around the buyer's specific monitoring universe—such as selected brands, categories, SKUs, cities, PIN codes, or competitor products.
Product and SKU Monitoring
Actowiz Solutions can help establish recurring monitoring for selected product catalogs, allowing businesses to identify availability changes and recurring stockouts.
Location-Level Intelligence
Monitoring can be organized by city and PIN code to help businesses understand geographic availability patterns rather than relying on national-level assumptions.
Price and Promotion Tracking
Price, discounts, offers, and availability can be analyzed together to help commercial teams understand changes in competitive positioning.
Historical Dataset Creation
Timestamped records enable businesses to compare current observations with previous collection cycles and identify recurring patterns.
Data Quality and Normalization
Collected information can be cleaned and standardized so that product-level datasets are suitable for analytics, reporting, and downstream integration.
Dashboard and Analytics Readiness
Structured datasets can support BI dashboards and internal reporting systems for category managers, retailers, FMCG brands, consumer-electronics companies, and market intelligence teams.
For organizations seeking Flipkart Minutes Real-Time Stock Monitoring, the strongest approach is to connect data collection with clear business actions: detect stockouts, prioritize affected SKUs, compare locations, monitor competitors, and identify availability opportunities.
Conclusion
Flipkart Minutes Real-Time Stock Monitoring gives brands a practical framework for understanding product availability in India's rapidly expanding quick-commerce environment. With the platform reaching 1,000 micro-fulfillment centers, 130+ cities, and 8,000+ PIN codes by June 2026, location-level product visibility has become increasingly important. (Flipkart Stories)
Brands can combine Web Scraping, Mobile App Scraping, and a structured Real-time dataset to track product availability, prices, promotions, locations, and SKU-level changes. The result is a more complete view of digital shelf performance and inventory-related market signals.
For category managers, e-commerce teams, FMCG brands, retailers, and market intelligence professionals, the actionable goal is clear: identify where products are unavailable, understand when availability changes, compare competitor conditions, and turn those observations into faster commercial decisions.
You can also reach us for all your mobile app scraping, data collection, web scraping , and instant data scraper service requirements!

 Pricing & Promotions
MAP Violations Brand Protection Counterfeit Detection Price Intelligence AI HOT Data Intelligence
Pricing & Promotions
MAP Violations Brand Protection Counterfeit Detection Price Intelligence AI HOT Data Intelligence Brand & Intelligence
Share of Search Content Audit & PDP Reviews & Ratings Retail Media Buy Box Monitoring Social Commerce HOT Live Commerce NEW Agentic Commerce NEW
Brand & Intelligence
Share of Search Content Audit & PDP Reviews & Ratings Retail Media Buy Box Monitoring Social Commerce HOT Live Commerce NEW Agentic Commerce NEW Digital Shelf & Search
Assortment Planning Competitive Benchmarking Product Availability Q-Commerce NEW
Digital Shelf & Search
Assortment Planning Competitive Benchmarking Product Availability Q-Commerce NEW AssortmentE-commerce Intelligence Hyperlocal Insights POI & Store Locator DTC Brand Analytics NEW
 For Retailers
 E-Commerce Dashboard
 Flipkart Insights (Live) #1
 Grocery Intelligence
.svg) Grocery Price (U.S.)
Grocery Price (U.S.)
.svg) Quick Commerce (India) HOT
Quick Commerce (India) HOT
 Food & Restaurant
 Fashion Intelligence
 Automotive
 Travel & Hospitality
 Real Estate
 Food Delivery Intelligence NEW
 OTT & Streaming NEW
 By Use Case
 Pricing Intelligence
 Digital Shelf Analytics
 MAP Monitoring HOT
 Cross-Border Price Parity NEW
 Share of Search
 Review Sentiment
 Kitchen Market Gaps NEW
 Dynamic Pricing / AI Repricing NEW
 Promotions & Deals Alerts NEW
 B2B / POI & Lead Data NEW
 By Region🇮🇳 India 🇺🇸 USA 🇦🇪 Middle East 🇬🇧 UK 🇦🇺 Australia 🌏 SE Asia 🇪🇺 Europe 🌎 LATAMIndia
 Flipkart Real-Time Insights
 Quick Commerce — Zepto · Blinkit
 Pincode Price Tracker
Middle East
Pincode Price Tracker
Middle East GCC Q-Commerce — Talabat · Noon NEW
UK & Australia
GCC Q-Commerce — Talabat · Noon NEW
UK & Australia UK Grocery — Tesco, Sainsbury's, Asda
 AU Grocery — Coles & Woolworths NEW
 Marketplace Scrapers
Amazon API TikTok Shop API HOT Uber Eats API Airbnb API Zepto / Blinkit API Instacart API NEW Talabat API NEW
Marketplace Scrapers
Amazon API TikTok Shop API HOT Uber Eats API Airbnb API Zepto / Blinkit API Instacart API NEW Talabat API NEW Developer APIsWeb Extract API Reviews API SERP API Pricing Webhook NEW
 Universal APIsStreaming Crawl API Scheduler Realtime Alerts Webhook Delivery 🐍 Python SDK 💚 Node.js SDK
 Delivery & SDKs
 Knowledge Center
Digital Shelf Playbook MAP Compliance Guide Pricing Intel Guide Scraping Compliance TikTok Shop Guide NEW Cross-Border Guide NEW
Knowledge Center
Digital Shelf Playbook MAP Compliance Guide Pricing Intel Guide Scraping Compliance TikTok Shop Guide NEW Cross-Border Guide NEW Guides & Playbooks
🎉 Seasonal & event tracking NEWBlack Friday pricing report Festive season, India Ramadan, GCC grocery All seasonal reportsSample Datasets HOT ROI Calculator NEW API Postman Collection Demo Dashboards Free API Playground NEW Press Kit
Guides & Playbooks
🎉 Seasonal & event tracking NEWBlack Friday pricing report Festive season, India Ramadan, GCC grocery All seasonal reportsSample Datasets HOT ROI Calculator NEW API Postman Collection Demo Dashboards Free API Playground NEW Press Kit Downloads & Tools
Trust Center About Us FAQs Careers
Downloads & Tools
Trust Center About Us FAQs Careers Trust & CompanyRetail shelf research NEWRetail shelf research






































 4.8/5 Average Rating
 50+ Video Testimonials
 92% Client Retention
 50+ Countries Served