Core business attributes
The identity of the place.
- Business name and known variants
- Primary and secondary categories
- Website and public phone where listed
- Price level indicator
- Chain and brand attribution

Scalable web, app and AI-powered collection across 40+ countries.
All services →Repricing driven by competitor moves rather than a weekly review.
Explore → Pricing & Promotions
 Brand & Intelligence
 Digital Shelf & Search
 Assortment
 For Retailers
Which solution fits?
Talk to ExpertTalabat, Careem Quik and Noon Minutes across 18 GCC cities.
Launch Demo →Tesco, Sainsbury's, Asda, Morrisons and Aldi, daily.
Get Early Access → E-Commerce Dashboard
 Flipkart Insights (Live) #1
 Grocery Intelligence
.svg) Grocery Price (U.S.)
Grocery Price (U.S.)
.svg) Quick Commerce (India) HOT
Quick Commerce (India) HOT
 Food & Restaurant
 Fashion Intelligence
 Automotive
 Travel & Hospitality
 Real Estate
 Food Delivery Intelligence NEW
 OTT & Streaming NEW
 By Use Case
 Pricing Intelligence
 Digital Shelf Analytics
 MAP Monitoring HOT
 Cross-Border Price Parity NEW
 Share of Search
 Review Sentiment
 Kitchen Market Gaps NEW
 Dynamic Pricing / AI Repricing NEW
 Promotions & Deals Alerts NEW
 B2B / POI & Lead Data NEW
 By Region
 Flipkart Real-Time Insights
 Quick Commerce — Zepto · Blinkit
 Pincode Price Tracker
 GCC Q-Commerce — Talabat · Noon NEW
 UK Grocery — Tesco, Sainsbury's, Asda
 AU Grocery — Coles & Woolworths NEW
Sources we already run pipelines against. Download a real sample from any of them.
Browse coverage → Marketplace Scrapers
 Developer APIs
 Universal APIs
 Delivery & SDKs
Fixed monthly retainer, named engineer, no per-request metering.
Managed Data API → Knowledge Center
 Guides & Playbooks
 Downloads & Tools
 Trust & Company
Scalable web, app and AI-powered collection across 40+ countries.
All 58 services →Repricing driven by competitor moves rather than a weekly review.
Explore → Pricing & Promotions
Brand & Intelligence
Digital Shelf & Search
Assortment For RetailersWhich solution fits?
Talk to ExpertSources we already run pipelines against. Download a real sample from any of them.
Browse coverage →Talabat, Careem Quik and Noon Minutes across 18 GCC cities.
Launch Demo →Tesco, Sainsbury's, Asda, Morrisons and Aldi, daily.
Get Early Access → E-Commerce Dashboard
Flipkart Insights (Live) #1
Grocery Intelligence
Grocery Price (U.S.)
Quick Commerce (India) HOT
Food & Restaurant
Fashion Intelligence
Automotive
Travel & Hospitality
Real Estate
Food Delivery Intelligence NEW
OTT & Streaming NEW
By Use Case
Pricing Intelligence
Digital Shelf Analytics
MAP Monitoring HOT
Cross-Border Price Parity NEW
Share of Search
Review Sentiment
Kitchen Market Gaps NEW
Dynamic Pricing / AI Repricing NEW
Promotions & Deals Alerts NEW
B2B / POI & Lead Data NEW
By Region Flipkart Real-Time Insights
Quick Commerce — Zepto · Blinkit
Pincode Price Tracker
GCC Q-Commerce — Talabat · Noon NEW
UK Grocery — Tesco, Sainsbury's, Asda
AU Grocery — Coles & Woolworths NEW
Marketplace Scrapers
Developer APIs Universal APIs Delivery & SDKsFixed monthly retainer, named engineer, no per-request metering.
Managed Data API → Knowledge Center
Guides & Playbooks
Downloads & Tools
Trust & CompanyLocal business and POI data, deduplicated across sources.
Location data is the one category where a single source is never enough. The same restaurant exists on Maps, on two directories, on an aggregator and on its own website, with a different address format on each. The work is reconciliation, not collection.
Free pilot on your own sources, returned in 48 hours. No card, no trial clock — and you keep the sample data either way.
Last verified 5 August 2026 by the Actowiz Solutions Data Engineering team.
Local business and POI data collection is the assembly of a structured record for each physical business location: what it is called, what category it belongs to, exactly where it is, when it is open, how it is rated, and whether it is still trading.
People describe this as "scraping Google Maps", and Maps is one important source. But treating any single source as the answer produces a dataset with known, systematic gaps — which is why we approach it as a reconciliation problem.
Records from every source are matched on name similarity, address
normalisation, geographic proximity and website domain, then
resolved into one place with a stable place_key. We
keep sources_matched as a field, because a place
confirmed by four independent sources is stronger evidence than
one appearing on a single directory.
Closure is never inferred from a single absence. It requires either an explicit closure signal or confirmation across sources, and the record carries which. Geocoding gets a confidence score rather than a bare coordinate, so downstream catchment analysis can filter on precision instead of assuming it.
Most engagements start with a competitor or category footprint in defined geographies, then extend into ratings and lifecycle tracking.
The identity of the place.
Exactly where it is, with precision stated.
When it is actually open.
Public reputation signal at place level.
The competitive geography.
How a place changes over time.
A managed engagement, not a tool licence. We own the pipeline and everything that breaks in it.
Every engagement delivers a documented schema. These are the core fields; the full dictionary runs to 90+ and is agreed during scoping.
| Field | Type | What it captures | Refresh |
|---|---|---|---|
place_key |
string | Stable resolved place identity, persistent across runs and source changes | Every run |
name / name_variants |
string / array | Resolved business name plus variants observed across sources | Per cadence |
primary_category / categories |
string / array | Normalised primary category and all observed categories | Per cadence |
address components |
object | Street, unit, locality, region, postcode and country, normalised | Per cadence |
lat / lon / geocode_confidence |
decimal | Coordinates with a confidence score so precision is filterable | Per cadence |
hours |
object | Structured weekly opening hours with change detection | Per cadence |
rating / review_count |
decimal / int | Average rating and review volume as public reputation signals | Per cadence |
website / brand |
string | Public website domain and resolved chain or brand attribution | Per cadence |
sources_matched |
int | How many independent sources confirm this place, as a confidence signal | Every run |
status / closed_detected |
enum / date | Operational, temporarily closed or permanently closed, with detection date | Per cadence |
confidence_basis |
enum | Whether closure or attributes were confirmed by one source or several | Every run |
Reviewer names, reviewer profiles and individual review text authored by identifiable people are not part of the deliverable. We supply rating and review volume as reputation metrics, which is business information rather than personal data.
Source mix is chosen per market and per category, since coverage strength varies sharply between them.
Where a platform's terms require API access rather than page collection, we use the official API and price that through transparently. We do not present API-sourced data as scraped or vice versa — provenance is recorded per field. Request a source we don't list →
We deliver into 40+ countries. These are the markets where this particular service is requested most, and the reason demand concentrates there.
| Market | Why demand concentrates here |
|---|---|
| United States & Canada | Dense directory ecosystems and strong registry data, which makes multi-source reconciliation unusually accurate. |
| United Kingdom & Western Europe | Excellent registry coverage plus mature directories, heavily used for retail expansion and catchment work. |
| India | Very strong metro coverage across both mapping platforms and local directories, with high business churn making closure detection critical. |
| United Arab Emirates & Saudi Arabia | Rapid retail and F&B expansion in dense cities, with high demand for competitor footprint tracking. |
We run production collection across 40+ countries. Coverage depth varies by market and by source, so we confirm what is actually available for your specific markets during scoping rather than claiming uniform global coverage. Ask about a market we don't list →
Retail expansion and FMCG field teams dominate, with location intelligence and research close behind.
Site selection needs competitor and complementary footprint data by catchment, which no internal system holds.
Reconciled competitor and category footprints with coordinates and confidence scores, plus opening and closure detection by area.
New site performance
Territory planning and outlet universe definition rely on lists that are stale and full of closed businesses.
A resolved outlet universe by category and geography with closure confirmation, so territories are built on trading locations.
Coverage per rep
Catchment and cannibalisation models need POI density and category mix at fine granularity with reliable geocoding.
Geocoded place data with confidence scores and category normalisation, delivered ready for spatial analysis.
Model accuracy
Identifying white space requires knowing exactly where you and competitors already are, including recent openings.
Brand-attributed footprints with new opening detection and density per catchment, revealing genuine white space.
Territories awarded
Market sizing by outlet count needs a defensible universe rather than a directory export of unknown vintage.
Reconciled place counts by category and area with source confirmation counts, so the universe is defensible.
Estimate confidence
Store footprint growth and closure rates are observable ahead of reporting, if the data is reconciled properly.
Longitudinal footprint panels by brand and market with confirmed openings and closures over time.
Signal lead time
Four patterns, with the outcome each is judged on.
Competitor and complementary category locations are reconciled across sources, geocoded with confidence scores, and delivered ready for catchment analysis. New openings and confirmed closures are tracked, so the footprint reflects current trading reality.
Outcome: Site decisions made against a verified current footprint rather than a directory export.
The trading outlet universe for a category and geography is resolved from multiple sources with closures confirmed, removing the closed and duplicate entries that inflate most territory lists.
Outcome: Territories built on locations that actually exist, with rep coverage measurable against a real denominator.
Brand-attributed location counts and category density are computed per catchment, identifying areas underserved relative to demographic or competitive benchmarks.
Outcome: Expansion pipelines built from measured density gaps rather than intuition.
Location counts by brand and market are tracked over time with confirmed openings and closures, producing a growth signal observable well before reported store counts.
Outcome: Footprint trends visible ahead of corporate reporting cycles.
Clients rarely permit naming. These are real engagement shapes with identifying detail removed, so you can judge whether the work resembles your situation.
The outlet universe came from a directory export of unknown vintage, and a meaningful share of listed premises were no longer trading.
Multi-source reconciliation with closure confirmed across independent sources, duplicates collapsed, and confirmation basis recorded per record.
The trading universe was corrected and territory coverage became measurable against a real denominator.
Catchment models overstated competition because competitor footprints were built from a single source that lagged closures badly.
Reconciled competitor footprints with geocode confidence scores, confirmed closures excluded, and new openings detected by first-seen date.
Competitive density figures fell to realistic levels, unblocking locations the old model had vetoed.
Examples are anonymised at client request. Named references are available on request under NDA. See published case studies →
Before you commit to anything, we run this service against your own sources and send you the output. If the coverage isn't there, the sample will show you that too — which is the point. We would rather lose the deal at the pilot than at month three.
Same collection pipeline and same QA underneath. The difference is who holds the schedule and how the data reaches you.
We own the collection, the QA and the delivery. You receive clean data on a schedule and never touch a scraper.
Best fit: Teams who need the data, not the infrastructure.
The same collection pipeline exposed as an authenticated REST endpoint your systems query directly.
Best fit: Product and engineering teams building on live data.
A defined pull for a specific question — market sizing, diligence, a pitch, a one-off audit.
Best fit: Research, strategy and diligence work with a deadline.
Every engagement is quoted individually, because the honest answer depends on your scope: how many sources, how many records, how often, and how the data reaches you. We scope it with you, run a free pilot on your own sources, and then quote a fixed monthly figure — no per-request metering and no overage billing when volumes move. Request a quote and you will have a number after one call.
Cross-source reconciliation and closure confirmation are the parts that make this a data engineering problem rather than a scraping one.
| Consideration | In-house scraping team | Generic proxy / DIY tool | Actowiz managed feed |
|---|---|---|---|
| Time to first usable data | 6–12 weeks of engineering before anything is trustworthy | Days, but output needs manual cleanup before use | Free pilot in 48 hours, production in 5–10 business days |
| Who fixes it when a source changes | Your engineers, at the cost of their roadmap | You do — tools report failures, they don't resolve them | We do, same business day, inside the retainer |
| Data quality assurance | Whatever your team has time to build | None beyond HTTP success | Schema validation plus sampled human QA on every run |
| Compliance documentation | Rarely produced, then requested urgently by legal | Not provided; terms risk sits with you | Sources, method and lawful basis documented for review |
| Accountability | Distributed across a team with other priorities | A support ticket queue | A named engineer and an account owner |
| True annual cost | Engineer salaries, proxies, hosting, ongoing maintenance | Low licence fee plus significant hidden analyst time | One fixed monthly retainer, quoted after scoping |
Every location dataset contains businesses that no longer exist. The question is what proportion, and whether you know which ones. Get this wrong and the consequences are concrete rather than academic.
Closure is never inferred from a single source no longer listing a
place. Sources drop listings for many reasons, including their own
data errors. We require either an explicit closure signal or
agreement across independent sources, and the record carries
confidence_basis stating which applied.
Temporary and permanent closure are separate states, because they mean different things for a field team and for market sizing. And where evidence is genuinely mixed — one source says closed, two still list it as trading — the record says so rather than resolving the ambiguity on your behalf.
This is unglamorous work, and it is the main reason a reconciled dataset outperforms any single-source export. For teams also tracking delivery presence, this pairs with our food data service, where store coverage per platform is a related question.
Location data is an area where vendors are often vague about sourcing, and the vagueness usually hides one of two things: terms violations, or personal data in the deliverable. Both are worth being explicit about.
Where a platform's terms require API access rather than page collection, we use the official API and pass that cost through transparently. Where public directories, registries and business websites can be collected directly, we do that. Every field carries provenance, so you can see which source and which method produced it — and we never present API-sourced data as scraped or the reverse.
Practically, this means some attributes on some platforms are available only through paid API access, and we tell you that during scoping rather than promising blanket coverage and then quietly substituting a weaker source.
This boundary occasionally costs us work, because some buyers want reviewer-level data for sentiment analysis. Aggregate review sentiment is available through our social media data service on public content with the same personal-data boundary applied. Reviewer-level personal profiles are not something we will assemble, in any category.
Categories, geographies and source mix are scoped first, including which platforms require paid API access in your markets.
You send us target sites, regions, SKUs or keywords. We return a field-level schema proposal, coverage estimate and refresh recommendation — usually within two working days.
We extract a real sample from your actual targets so you can inspect field fill rates, edge cases and match quality before any commitment.
Our engineers build extractors, then wire validation rules: type checks, range checks, duplicate detection and golden-record comparison against a manually verified subset.
Feeds run at your chosen cadence and land in the warehouse or bucket you already use. Schema changes are versioned and announced before they ship.
We watch coverage drift, fill rates and source changes daily. A named engineer owns your account, and layout breaks are fixed by us — not queued for you.
JSON, JSONL, CSV, Parquet or XLSX, delivered to Amazon S3, Google Cloud Storage, Azure Blob, SFTP, Snowflake, BigQuery, Databricks or a REST/GraphQL endpoint. Webhooks fire on completion, and every batch ships with a manifest containing row counts, schema version and QA results so your pipeline can fail loudly instead of silently ingesting a bad file. Geocoded place data loads directly into PostGIS, BigQuery GIS or your GIS tooling.
We use official Places APIs where platform terms require it, and collect publicly accessible directory, registry and business website data otherwise, with provenance recorded per field. Reviewer names, reviewer profiles and individual attributable review text are not part of the deliverable, nor are personal contact details for named individuals.
These are contractual, not marketing copy. They appear in the engagement document.
| Commitment | What we hold ourselves to |
|---|---|
| Pilot turnaround | A real sample from your own sources within 48 hours of scoping, at no cost. |
| Go-live | Production collection running within 5–10 business days of sign-off. |
| Delivery punctuality | 99.5% on-schedule delivery, measured monthly and reported to you. |
| Breakage response | Source layout changes triaged same business day; critical sources inside 4 hours. |
| Data quality | Schema validation on every run plus sampled human QA before any delivery leaves us. |
| Escalation | A named engineer and an account owner, not a shared ticket queue. |
| Change requests | Field additions and source changes handled inside the retainer, not re-quoted. |
| Exit | Your historical data exported in full on request. No lock-in, no export fee. |
Plain definitions of the terms used on this page, so procurement and legal reviewers are working from the same vocabulary as your data team.
What expansion, field sales and location intelligence teams ask during evaluation.
We use the official Places API where Google's terms require it, and pass that cost through transparently rather than burying it. Alongside that we collect publicly accessible directories, registries, brand store locators and business websites, then reconcile everything into one resolved place.
Every field carries provenance, so you can see which source and method produced it. We do not present API-sourced data as scraped or vice versa — and if an attribute is only available through paid API access in your market, we tell you during scoping rather than substituting a weaker source silently.
Because every single source has systematic gaps. Coverage differs by category — independent trades, clinics and B2B premises are frequently thin on mapping platforms and better in directories or registries. Attribute freshness differs too: hours on one source can be two years stale while another is current.
Reconciliation lets us prefer the fresher observation per
field and confirm existence across independent sources. We
keep sources_matched on every record, because a
place confirmed by four sources is stronger evidence than one
appearing on a single directory.
Either an explicit closure signal, or agreement across independent sources — never a single source dropping the listing, because sources drop listings for their own data reasons all the time.
Every record carries confidence_basis stating
which applied, and temporary and permanent closure are
separate states. Where evidence is genuinely mixed, the record
says so rather than us resolving the ambiguity for you. Stale
closures are the most expensive error in this category —
they waste field visits and inflate market sizing unevenly.
Rating, review count, rating movement and review velocity, yes — these are reputation metrics about a business. Reviewer names, reviewer profiles, reviewer history and individual attributable review text are not part of the deliverable.
This occasionally costs us work, since some buyers want reviewer-level data for sentiment analysis. We would rather decline than assemble profiles of identifiable individuals. Aggregate sentiment on public content is available through our social media data service with the same boundary applied.
We deliver a confidence score on every record rather than a single headline accuracy figure, because precision varies by market and by how the address was published. Our standard threshold is 0.94, and records below your chosen threshold arrive flagged rather than dropped.
This matters for catchment work: a place geocoded from a full verified address and one geocoded from a partial address are not equivalent inputs to a distance calculation. With a confidence score you can filter, rather than inheriting false precision.
Partially, and we are honest about the limits. Independent trades, small clinics, B2B premises and rural businesses are genuinely thin on consumer mapping platforms. Multi-source reconciliation helps — registries and sector directories often cover what mapping platforms miss — but some categories will remain incomplete.
We assess this per category and per market during scoping and give you an expected coverage estimate, rather than promising a complete universe that does not exist in any public source.
Yes, with first-seen dates on every place. New openings are a strong expansion signal, particularly for tracking competitor or franchise growth ahead of any announcement.
One caveat worth knowing: a place appearing for the first time can mean a genuine new opening or simply that a source has newly listed an existing business. We flag which pattern the evidence supports, and confirmation across sources raises confidence that it is a real opening rather than a listing artefact.
North America and Western Europe are strongest, with dense directory ecosystems and good registry data. India has excellent coverage in metros through both mapping platforms and local directories. GCC markets are good in cities. Coverage thins in rural areas globally and in markets where informal business is common.
We give a per-market, per-category coverage estimate during scoping. In some markets a registry-based approach outperforms mapping platforms entirely, and we will recommend that rather than defaulting to the source everyone expects.
We quote individually. The drivers are geographic scope, category breadth, refresh frequency, and critically whether your markets require paid API access for key attributes — that cost is passed through and can dominate for large geographies.
A defined competitor footprint in specific metros refreshed monthly sits at the lighter end. National multi-category universes with frequent refresh and heavy API dependence sit considerably higher. One scoping call, a free pilot on your own geography and categories within 48 hours, then a fixed monthly quote. Request a quote.
Send us a category and a geography. We return reconciled places with geocode confidence, hours and closure status within 48 hours.
Free pilot, no card, no obligation. We'll tell you the expected coverage for your category before you commit.Our web scraping expertise is relied on by 4,000+ global enterprises including Zomato, Tata Consumer, Subway, and Expedia — helping them turn web data into growth.
Watch how businesses like yours are using Actowiz data to drive growth.
 4.8/5 Average Rating
 50+ Video Testimonials
 92% Client Retention
 50+ Countries Served
From Zomato to Expedia — see why global leaders trust us with their data.
Backed by automation, data volume, and enterprise-grade scale — we help businesses from startups to Fortune 500s extract competitive insights across the USA, UK, UAE, and beyond.


 Product Matching
 Attribute Tagging
 Content Optimization
 Sentiment Analysis
 Prompt-Based Reporting
We partner with agencies, system integrators, and technology platforms to deliver end-to-end solutions across the retail and digital shelf ecosystem.


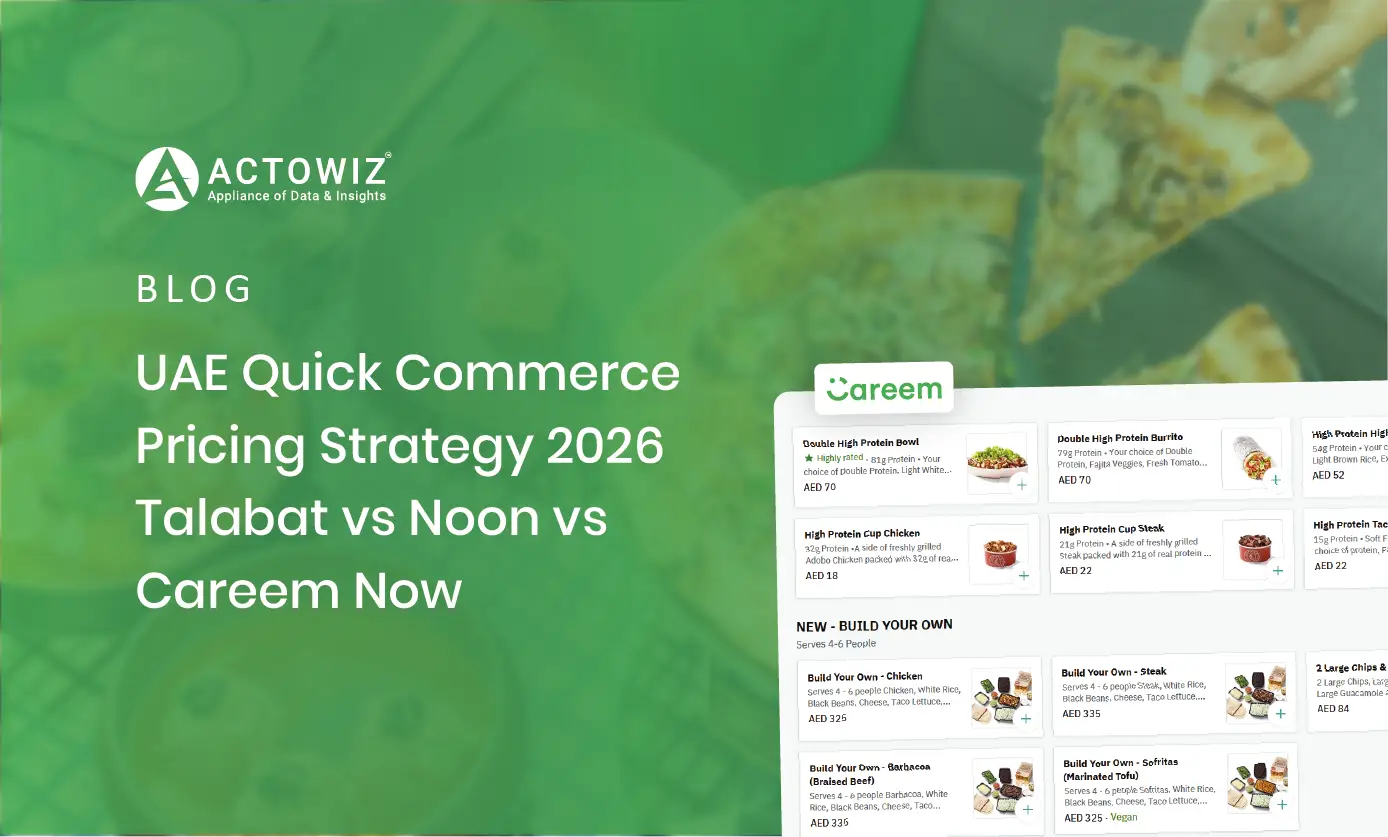
Explore the UAE Quick Commerce Pricing Strategy Report 2026 to compare Talabat, Noon, and Careem Now and improve pricing intelligence.
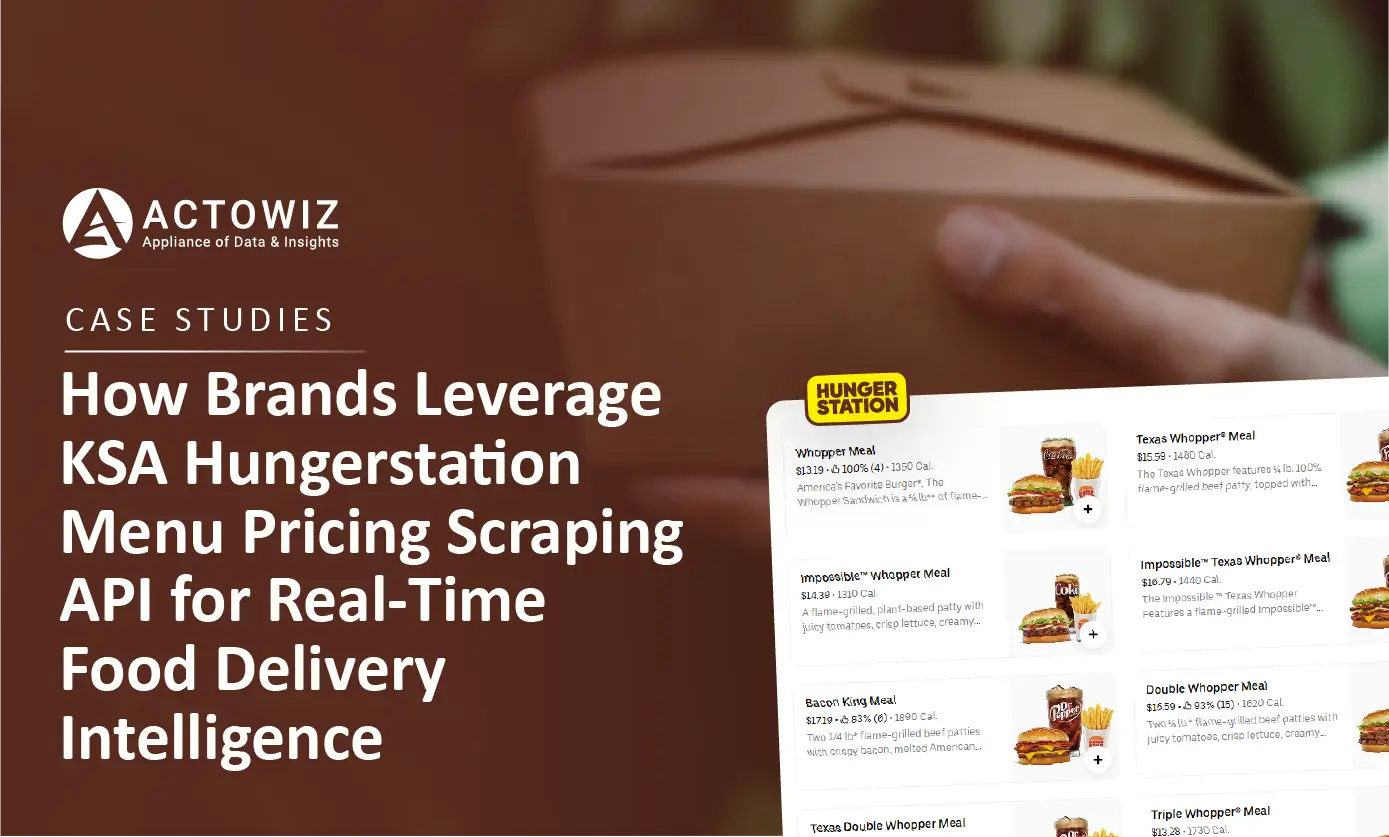
Explore KSA Hungerstation Menu Pricing Scraping API to track menu prices, competitor changes, and food delivery market trends in Saudi Arabia.

Namshi Fashion & Beauty Data Intelligence helps brands track prices, products, availability, assortment, and trends for smarter MENA market decisions.
Whether you're a startup or a Fortune 500 — we have the right plan for your data needs.











































