Core services
Enterprise Data Extraction

Scalable web, app and AI-powered collection across 40+ countries.

All 58 services →
New 2026
AI Training Data

Corpus building with provenance and opt-out compliance.

Learn more →
Free pilot
24-hour sample

We run collection on your own sources before you commit.

Get a sample →
58Services
40+Countries
DEVELOPER

Ready-Made Scrapers

Pre-built for top platforms. Self-serve, no setup.

View All →
TRY FREE

API Playground

Test endpoints instantly. No credit card.

Start Free →
28Tools
2SDKs
icons Delivery & SDKs
Streaming Crawl API Scheduler Realtime Alerts Webhook Delivery 🐍 Python SDK 💚 Node.js SDK

Need it managed instead?

Fixed monthly retainer, named engineer, no per-request metering.

Managed Data API →
HOT

Case Studies

How brands use Actowiz, with named outcomes.

Read →
FREE

Sample Datasets

Real output, no signup.

Download →
NEW

ROI Calculator

Model the return on a data engagement.

Calculate →

Introduction

The US real estate market has become increasingly dependent on timely, structured, and comparable property information. Investors, brokers, developers, property managers, lenders, and research firms need to monitor listing activity, asking prices, rental rates, property characteristics, availability, locations, and market movements across thousands of properties. The US Real Estate Data Intelligence Report 2026 examines how data from major real estate platforms can be transformed into actionable intelligence for property and market analysis.

The research focuses on three important sources: LoopNet for commercial property intelligence, Redfin for residential sales and listing information, and Apartments.com for rental-market signals. LoopNet provides market-trend pages covering commercial real estate markets by location, while Apartments.com tracks rental trends across more than 2,400 cities.

Historical analysis from 2020 through 2026 shows how the pandemic, changing interest rates, limited housing supply, construction cycles, and shifting renter preferences have influenced property markets. Structured LoopNet property data extraction can help businesses consolidate listing attributes, prices, property types, locations, and availability into datasets suitable for competitive benchmarking and investment research.

Comparing Property Signals Across Major Platforms

A modern real estate intelligence strategy benefits from combining residential, rental, and commercial datasets rather than examining each market independently. LoopNet, Redfin & Apartments Data Comparison highlights the complementary nature of these platforms. LoopNet is primarily useful for commercial property discovery and market-level information, Redfin provides extensive residential property and transaction-oriented signals, while Apartments.com provides rental pricing and availability intelligence.

Between 2020 and 2021, the US market experienced substantial changes in housing demand as remote work altered location preferences. During 2022, rising mortgage rates began reducing affordability and transaction activity, while rental markets experienced strong price growth. By 2023, buyers and sellers were increasingly constrained by affordability and limited inventory. Redfin's review of 2024 reported that the annual US median sale price reached $428,200, while the median reached an all-time monthly high of $442,000 in July.

The rental side showed a different trajectory. Apartments.com reported that rental growth slowed considerably from the rapid increases seen in early 2022. By 2025, the market was characterized by relatively moderate rent growth and elevated vacancy.

Year Major Market Signal Data Intelligence Opportunity
2020 Pandemic disrupted property activity Establish baseline datasets
2021 Strong housing demand Track listing and price changes
2022 Mortgage rates increased Monitor affordability
2023 Transactions remained constrained Compare inventory and prices
2024 Median home prices reached new highs Benchmark residential markets
2025 Rental growth moderated Analyze rent and vacancy
2026 Market remains regionally diverse Build real-time monitoring

For businesses, the value lies in connecting these datasets. A commercial investor can compare property availability with residential and rental trends in the same geography, while a broker can identify pricing gaps across neighborhoods.

Turning Residential Listings into Market Signals

Residential property data can reveal changes in buyer demand, inventory, pricing, property characteristics, and neighborhood-level competitiveness. Redfin US Property Listing Data Intelligence enables analysts to organize these signals into standardized datasets for market research.

From 2020 to 2021, residential demand accelerated as buyers responded to low borrowing costs and changing housing preferences. In 2022, rising rates shifted the market, creating affordability pressure. During 2023, the combination of high borrowing costs and limited existing-home inventory restricted transaction volumes. In 2024, prices nevertheless continued climbing because supply remained constrained. Redfin reported a 2024 annual median sale price of $428,200, exceeding the previous year's level by approximately $20,000.

The 2025-2026 period introduced another layer of complexity. Buyers became more sensitive to mortgage costs, local employment conditions, property taxes, insurance expenses, and inventory. National statistics can therefore hide significant regional differences. NAR's latest data, for example, shows that July 2026 existing-home sales declined 1.7% month over month, while year-to-date sales were still up 2.4%.

Year Residential Intelligence Focus Business Application
2020 Listing disruption Historical benchmarking
2021 Demand acceleration Price comparison
2022 Rate-driven affordability pressure Buyer segmentation
2023 Limited transactions Inventory monitoring
2024 Record-level pricing Competitive analysis
2025 Affordability and inventory Market forecasting
2026 Regional divergence Location-level intelligence

A structured dataset can capture address, listing price, property type, bedrooms, bathrooms, square footage, listing status, days on market, and other available attributes. Analysts can then compare properties across ZIP codes, cities, metropolitan areas, and states.

Understanding Rental Market Movements

Rental markets provide an essential counterpart to home-sale intelligence because housing affordability can push households between renting and owning. Apartments Property Market Intelligence, US Real Estate Data Intelligence Report 2026 focuses on rental pricing, vacancies, apartment characteristics, and geographic differences.

The period from 2020 to 2021 saw major changes in renter preferences, particularly around urban versus suburban locations. In 2022, rental prices increased rapidly in many markets. Apartments.com noted in its January 2025 report that rent growth in early 2022 was approaching 10% year over year, highlighting how dramatically the market had shifted from later periods.

By 2024 and 2025, new apartment supply helped moderate rent growth in several markets. Apartments.com reported a national average one-bedroom rent of $1,556 in January 2025, up 0.9% year over year. By June, the figure had increased to $1,636, while the vacancy rate remained 8.1%.

The market continued evolving in 2026. Apartments.com reported an average one-bedroom rent of $1,643 in May 2026, with national vacancy at 8.4%. In June, average one-bedroom rent reached $1,645, while vacancy declined slightly to 8.3%.

Period Rental Indicator Intelligence Implication
2020 Major renter-location shifts Track migration
2021 Demand normalization Compare neighborhoods
2022 Rapid rent growth Identify pricing pressure
2023 Supply begins influencing growth Monitor new inventory
2024 Market stabilization Benchmark rent changes
2025 Moderate rent growth Analyze concessions and vacancies
2026 Regional divergence Forecast local rental demand

Rental datasets can therefore support property acquisition decisions, rent benchmarking, occupancy analysis, tenant-market research, and location selection.

Evaluating Commercial Property Opportunities

Commercial real estate requires different variables from residential housing. Property type, building size, asking price, lease structure, location, zoning, tenant characteristics, parking, and market accessibility can influence investment decisions. Loopnet US Property Data Analysis can help businesses organize commercial listing information for comparative research.

From 2020 through 2021, commercial real estate experienced substantial disruption as offices, retail locations, and other commercial properties responded to pandemic-related changes. In 2022, reopening supported activity in several commercial segments, while higher financing costs subsequently became an important consideration. During 2023 and 2024, office-market challenges, logistics demand, and changing tenant requirements produced highly divergent outcomes across property types.

LoopNet's market-trend infrastructure demonstrates the geographic depth available for commercial research, with market-trend pages organized across numerous US locations.

Year Commercial Market Development Data Requirement
2020 Pandemic disruption Property status tracking
2021 Reopening and repositioning Location comparison
2022 Financing costs rise Asking-price analysis
2023 Office-market pressure Property-type segmentation
2024 Uneven commercial recovery Market benchmarking
2025 Repricing and selective demand Competitive monitoring
2026 Localized opportunity Investment screening

Commercial datasets become more valuable when historical records are retained. Analysts can determine whether asking prices are increasing, whether properties remain listed longer, and where commercial inventory is expanding or contracting.

For brokers, this can support prospecting and market reports. For investors, it can help identify properties that meet specific price, location, size, and asset-class requirements.

Building a Structured Property Data Pipeline

Real estate intelligence depends not only on the volume of information collected but also on how consistently it is structured. Scraping US Real Estate Data can involve collecting publicly available listing information, normalizing property attributes, removing duplicates, monitoring changes, and creating historical records.

The 2020-2021 period provides an important baseline for understanding pandemic-driven changes. The 2022-2023 period can then be used to analyze the impact of financing conditions and changing demand. The 2024-2025 period provides evidence of price resilience in residential markets and slower rental growth. By 2026, businesses can compare multiple years of property records to identify recurring patterns.

The US Census Bureau now provides national, state, and county housing-unit estimates for 2020-2025, giving analysts a useful official benchmark for housing supply analysis.

Data Layer Example Fields 2020-2026 Use
Property Type, size, bedrooms Asset classification
Pricing Sale/rent/asking price Price tracking
Location City, ZIP, state Geographic analysis
Availability Active, sold, leased Supply monitoring
Time Listed/updated dates Historical trends
Features Amenities, parking Property comparison
Market Rent, inventory, vacancy Market forecasting

A mature pipeline should also include validation rules. Prices should be standardized, addresses normalized, property types mapped to consistent categories, and duplicate listings identified. Historical snapshots can preserve changes that would otherwise disappear when a listing is updated or removed.

This approach transforms individual listings into a longitudinal dataset. Instead of asking what a property looks like today, analysts can examine how its price, status, availability, and characteristics changed over time.

Converting Property Records into Investment Intelligence

The final stage is turning property records into decisions. Redfin Real Estate Data Scraper, US Real Estate Data Intelligence Report 2026 reflects a broader requirement for scalable residential data collection and analysis.

From 2020 through 2022, historical listing data can help identify the rapid transition from high demand to affordability pressure. From 2023 onward, datasets become particularly useful for tracking the relationship between inventory, prices, mortgage conditions, and transaction activity. In 2024, Redfin's reported annual median sale price of $428,200 demonstrated the persistence of high home values despite constrained transaction activity.

By 2025 and 2026, market intelligence increasingly needs to operate at the local level. A national median may not accurately represent conditions in a specific metro, county, ZIP code, or neighborhood. Apartments.com's 2026 data illustrates this divergence: national rent growth remained modest while certain locations experienced substantially different outcomes.

Intelligence Metric Strategic Use
Median asking price Pricing benchmark
Price per sq. ft. Property valuation comparison
Days on market Demand assessment
Inventory count Supply monitoring
Rent level Rental benchmarking
Vacancy Occupancy assessment
Property status Opportunity identification
Historical price changes Trend analysis

Real estate companies can combine these metrics to develop automated dashboards, competitor monitoring systems, investment-screening models, and market alerts. Investors can identify markets where prices and rents are moving differently. Developers can identify areas where rental demand is rising faster than supply. Brokers can benchmark listings against comparable properties.

The objective is not simply to collect more listings. It is to create a consistent information layer that enables faster comparison, historical analysis, and evidence-based decision-making.

Real estate organizations often need more than a one-time dataset. They require recurring collection, structured output, historical tracking, data cleaning, and monitoring workflows that can accommodate changing listing environments. Web Scraping Apartments Listings, US Real Estate Data Intelligence Report 2026 can support the development of property datasets across rental, residential, and commercial markets.

Actowiz Solutions can help businesses design customized data workflows around their research requirements. Data can be organized around property URLs, addresses, prices, property types, sizes, amenities, availability, listing status, and other relevant attributes.

A structured approach can help organizations:

  • Build historical property datasets.
  • Monitor listing and price changes.
  • Compare rental markets across locations.
  • Track commercial property opportunities.
  • Standardize information from multiple sources.
  • Identify duplicate or changed listings.
  • Create datasets for dashboards and analytics.
  • Support competitive and investment research.

The value of a professional data pipeline is particularly important when businesses need recurring information rather than a static spreadsheet. Automated collection and normalization can reduce manual research while creating a repeatable framework for ongoing market intelligence.

Conclusion

The US real estate landscape from 2020 through 2026 demonstrates why property intelligence must combine historical context with current market signals. Residential prices, rental rates, vacancy levels, commercial availability, and local supply conditions have changed significantly across the period. Redfin's 2024 data showed record-level median home pricing, while Apartments.com's 2025-2026 reports demonstrated slower national rent growth alongside substantial regional variation.

For organizations analyzing these markets, Real Estate Data Scraping Services can provide a scalable foundation for collecting and organizing property information. A reliable Web Crawling service can support recurring monitoring across relevant public web pages, while Web Data Mining can transform collected records into structured datasets for market comparison and research.

The next generation of real estate intelligence will depend increasingly on granular, historical, and frequently refreshed data. Companies that can connect listing information with pricing, availability, rental, geographic, and market-level signals will be better positioned to identify opportunities and respond to changing conditions.

Ready to turn property listings into actionable market intelligence? Connect with Actowiz Solutions to build a customized real estate data collection and analytics solution for your business!

Social Proof That Converts

Trusted by Global Leaders Across Q-Commerce, Travel, Retail, and FoodTech

Our web scraping expertise is relied on by 4,000+ global enterprises including Zomato, Tata Consumer, Subway, and Expedia — helping them turn web data into growth.

4,000+ Enterprises Worldwide
50+ Countries Served
20+ Industries
Join 4,000+ companies growing with Actowiz →
Real Results from Real Clients

Hear It Directly from Our Clients

Watch how businesses like yours are using Actowiz data to drive growth.

▶
1 min
★★★★★
"Actowiz Solutions offered exceptional support with transparency and guidance throughout. Anna and Saga made the process easy for a non-technical user like me. Great service, fair pricing!"
TG
Thomas Galido
Co-Founder / Head of Product at Upright Data Inc.
▶
2 min
★★★★★
"Actowiz delivered impeccable results for our company. Their team ensured data accuracy and on-time delivery. The competitive intelligence completely transformed our pricing strategy."
II
Iulen Ibanez
CEO / Datacy.es
▶
1:30
★★★★★
"What impressed me most was the speed — we went from requirement to production data in under 48 hours. The API integration was seamless and the support team is always responsive."
FC
Febbin Chacko
-Fin, Small Business Owner
icons 4.8/5 Average Rating
icons 50+ Video Testimonials
icons 92% Client Retention
icons 50+ Countries Served

Join 4,000+ Companies Growing with Actowiz

From Zomato to Expedia — see why global leaders trust us with their data.

Why Global Leaders Trust Actowiz

Backed by automation, data volume, and enterprise-grade scale — we help businesses from startups to Fortune 500s extract competitive insights across the USA, UK, UAE, and beyond.

icons
7+
Years of Experience
Proven track record delivering enterprise-grade web scraping and data intelligence solutions.
icons
4,000+
Projects Delivered
Serving startups to Fortune 500 companies across 50+ countries worldwide.
icons
200+
In-House Experts
Dedicated engineers across scrapers, AI/ML models, APIs, and data quality assurance.
icons
9.2M
Automated Workflows
Running weekly across eCommerce, Quick Commerce, Travel, Real Estate, and Food industries.
icons
270+ TB
Data Transferred
Real-time and batch data scraping at massive scale, across industries globally.
icons
380M+
Pages Crawled Weekly
Scaled infrastructure for comprehensive global data coverage with 99% accuracy.

AI Solutions Engineered
for Your Needs

→
LLM-Powered Attribute Extraction: High-precision product matching using large language models for accurate data classification.
→
Advanced Computer Vision: Fine-grained object detection for precise product classification using text and image embeddings.
→
GPT-Based Analytics Layer: Natural language query-based reporting and visualization for business intelligence.
→
Human-in-the-Loop AI: Continuous feedback loop to improve AI model accuracy over time.
icons Product Matching icons Attribute Tagging icons Content Optimization icons Sentiment Analysis icons Prompt-Based Reporting

Connect the Dots Across
Your Retail Ecosystem

We partner with agencies, system integrators, and technology platforms to deliver end-to-end solutions across the retail and digital shelf ecosystem.

icons
Analytics Services
icons
Ad Tech
icons
Price Optimization
icons
Business Consulting
icons
System Integration
icons
Market Research
Become a Partner →

Popular Datasets — Ready to Download

Browse All Datasets →
icons
Amazon
eCommerce
Free 100 rows
icons
Zillow
Real Estate
Free 100 rows
icons
DoorDash
Food Delivery
Free 100 rows
icons
Walmart
Retail
Free 100 rows
icons
Booking.com
Travel
Free 100 rows
icons
Indeed
Jobs
Free 100 rows

Latest Insights & Resources

View All Resources →
thumb
Blog

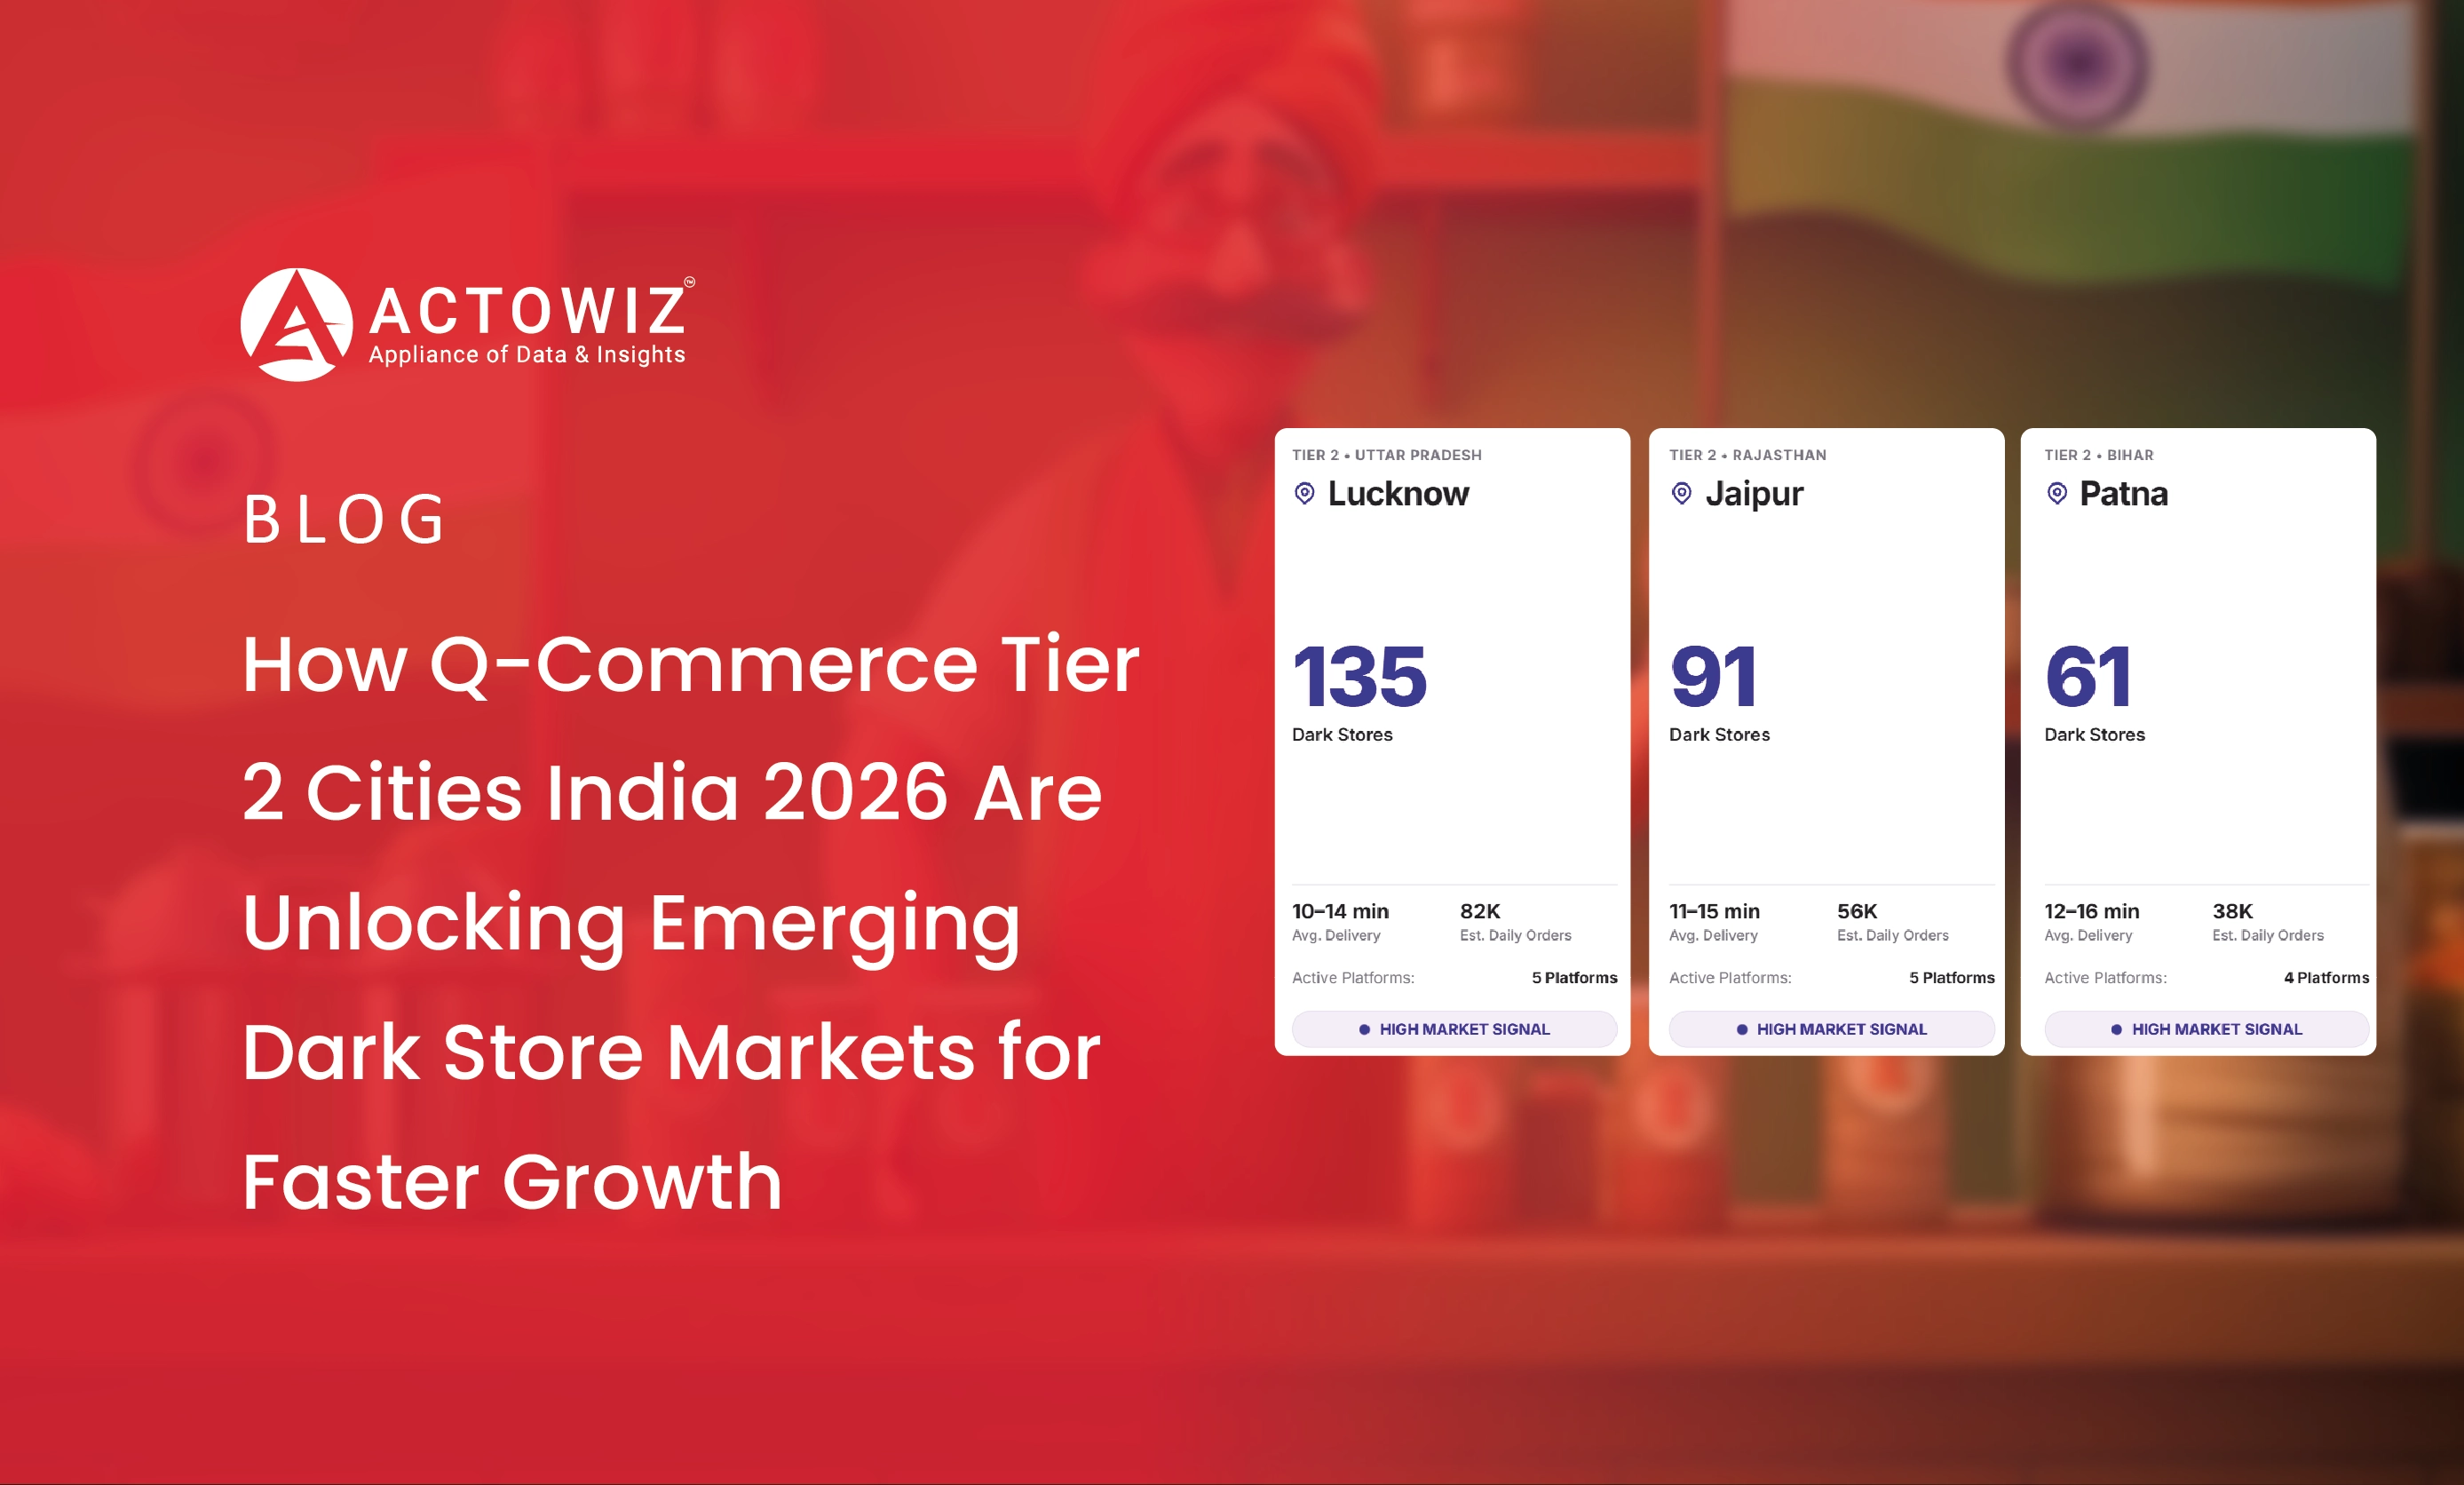
How Q-Commerce Tier 2 Cities India 2026 Are Unlocking Emerging Dark Store Markets for Faster Growth

Explore Q-Commerce Tier 2 Cities India 2026, uncovering emerging dark store markets, consumer demand, delivery trends, and expansion opportunities.

thumb
Case Study

How We Help Brands with Wine Data Collection from Tabelog

Discover Wine Data Collection from Tabelog to analyze wine listings, prices, ratings, restaurant trends, menus, and competitive market insights.

thumb
Report

E-Com & Q-Com Review Intelligence Report 2026

Discover how E-Com & Q-Com Review Intelligence Report 2026 helps brands analyze reviews, sentiment, product issues, and customer trends across major platforms.

Start Where It Makes Sense for You

Whether you're a startup or a Fortune 500 — we have the right plan for your data needs.

icons
Enterprise
Book a Strategy Call
Custom solutions, dedicated support, volume pricing for large-scale needs.
icons
Growing Brand
Get Free Sample Data
Try before you buy — 500 rows of real data, delivered in 2 hours. No strings.
icons
Just Exploring
View Plans & Pricing
Transparent plans from $500/mo. Find the right fit for your budget and scale.

Request Free Sample Data

Our team will reach out within 2 hours with 500 rows of real data — no credit card required.

+1 ▼
✓ Free 500-row sample · No credit card · Response within 2 hours