Introduction
The retailer in this story sold roughly 14,000 SKUs across five channels: their own D2C site, a marketplace storefront, two regional retail partners, and a quick-commerce app. Same products. Same brand. Five different prices — and nobody inside the company could tell you what those five prices were on any given morning without opening five browser tabs and taking notes.
That is not an unusual situation. It is the default one. Retail pricing did not become fragmented on purpose; it became fragmented because each channel was added at a different time, by a different team, with a different pricing owner, and the systems never got stitched together. The result is a familiar set of symptoms:
- A customer screenshots your own product cheaper on a marketplace than on your D2C site and posts it.
- A competitor drops price on your top-20 SKUs on a Thursday, and your category manager finds out the following Wednesday.
- Your "everyday low price" hero SKU is quietly 12% above the market on the only channel where it actually sells volume.
- Your promotional calendar collides with a partner's clearance, and you spend a month arguing about who cannibalised whom.
Every one of those is a data problem before it is a pricing problem. And every one of them is solvable with the same underlying system: Automated Cross-Channel Price Matching & Alerts.
This is how that retailer built it — the architecture, the matching layer that makes or breaks the whole thing, the rules engine, the alerting design, the sample data, the mistakes, and the numbers at the end. The program was implemented with data infrastructure from Actowiz Solutions, and the design below is the one that survived contact with reality.
Why Manual Price Checking Always Fails
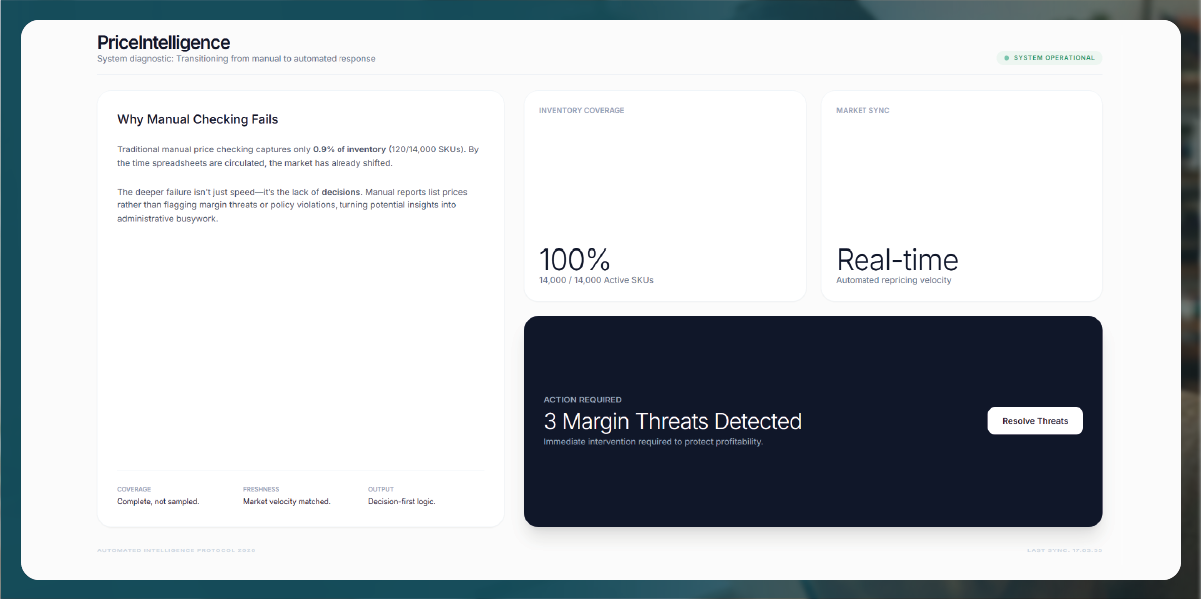
Before the build, the retailer had a process. An analyst spent roughly six hours a week checking prices — about 120 SKUs across four competitors, recorded in a spreadsheet, circulated on Fridays.
Do the arithmetic and the problem is obvious. 120 SKUs out of 14,000 is 0.9% coverage. Checked once a week, in a category where competitors reprice several times a day. By the time the spreadsheet landed, most of it described a market that no longer existed.
But the deeper failure was not coverage or freshness. It was that the spreadsheet contained no decisions. It listed prices. It did not say which prices mattered, which were violations of policy, which threatened margin, or which required someone to do something before lunch. It generated work rather than removing it.
The three requirements that fell out of that realisation shaped everything afterwards:
- Coverage must be complete, not sampled. Every SKU, every channel, every competitor that matters.
- Freshness must match the market's repricing velocity, not the analyst's calendar.
- The output must be a decision, not a dataset. If a human has to scan a table to find what changed, the system has failed.
The Architecture: Six Components
1. The SKU spine
Everything begins with a canonical internal product identity. Every product gets one master SKU, and every channel listing — your D2C page, your marketplace listing, your partner's listing, each competitor's equivalent product — is mapped to it.
This sounds trivial. It is the single hardest part of the project, and the reason most price-matching initiatives quietly die. Get it right and every downstream layer works. Get it wrong and you will spend eighteen months not trusting your own dashboards.
2. Collection
Multi-channel price data has to be collected from wherever it lives: your own channels, your partners' sites, marketplaces, and competitor storefronts and apps. Multi-Channel Price Data Tracking at 14,000 SKUs × 5 own channels × 6 competitors is a meaningful engineering commitment — roughly a million observations a day at hourly cadence on the top tier alone.
The retailer chose not to build this in-house. The maintenance burden of E-commerce price Data Scraping — layout changes, app updates, regional variants, anti-bot evolution, new channel onboarding — is continuous and never becomes a competitive advantage. They contracted the collection and normalization layer to Actowiz Solutions, delivered as a stable schema over API and webhook, and put their own engineers on the rules engine instead, which is where the actual differentiation lives.
3. Matching
Mapping your SKU to the equivalent competitor product. Not the same product — the equivalent one. This is where judgement enters the system, and it is covered in detail below.
4. The rules engine
Converting observed prices into policy verdicts: compliant, violation, opportunity, threat. Rules encode your commercial strategy, so they belong to you and not to a vendor.
5. Alerting
Pushing verdicts to the humans (or systems) that can act, with enough context to act immediately and without so much noise that people mute the channel in week three.
6. Action
Repricing — automated within guardrails, human-approved outside them.
The Matching Layer: Where Programs Live or Die
SKU-level price comparison is only meaningful if the two SKUs are genuinely comparable. The retailer's first attempt matched on product title similarity. It produced a 71% match precision, which sounds acceptable until you realise that means nearly three in ten "competitor is cheaper" alerts were comparing a 500ml bottle to a 750ml one.
Three bad alerts out of ten is enough to destroy trust in a system permanently. Once a category manager has been embarrassed twice by acting on a false alert, they stop opening the emails — and the project is dead regardless of how good the other 70% was.
The rebuilt matching layer used a cascade:
- Tier 1 — Identifier match. GTIN, EAN, UPC, MPN. Where a shared identifier exists and is trustworthy, the match is exact and carries maximum confidence. This covers a surprisingly small fraction of listings — typically 30–50% in general merchandise, higher in electronics and packaged goods.
- Tier 2 — Attribute match. Brand + model + normalized pack size + colour/variant + capacity. Requires attribute extraction from unstructured titles and descriptions, which is where machine learning earns its keep.
- Tier 3 — Image similarity. Where text fails — private-label goods, unbranded items, poorly written listings — visual matching frequently succeeds.
- Tier 4 — LLM-assisted disambiguation. For the residual hard cases, where a model reads both listings and adjudicates equivalence with an explicit confidence score.
- Tier 5 — Human review queue. Anything under a defined confidence threshold goes to a person. This queue is small, but it is never empty, and pretending otherwise is how bad matches leak into production.
Critically, every match carries a confidence score, and that score travels with the alert. A 0.98-confidence match triggers automated repricing. A 0.82-confidence match triggers a human alert. A 0.61 goes to the review queue and never reaches a category manager as a claim.
Final match precision after the rebuild: 96.4%, audited monthly against a hand-labelled sample. That number is the foundation the entire program stands on, which is why it gets measured rather than assumed.
Sample Data: What a Clean Record Looks Like
A single normalized cross-channel observation:
{
  "capture_ts": "2026-07-13T08:00:14Z",
  "master_sku": "MSK-44821",
  "product_name": "Aurora Ceramic Non-Stick Frypan 28cm",
  "brand": "Aurora",
  "gtin": "8901234567890",
  "category": "Cookware > Pans > Frypans",
  "own_channels": {
    "d2c_site": {
      "price": 2499.00,
      "mrp": 3499.00,
      "discount_pct": 28.6,
      "in_stock": true
    },
    "marketplace_store": {
      "price": 2299.00,
      "mrp": 3499.00,
      "discount_pct": 34.3,
      "in_stock": true,
      "coupon": "SAVE5"
    },
    "retail_partner_a": {
      "price": 2699.00,
      "in_stock": true
    },
    "retail_partner_b": {
      "price": 2549.00,
      "in_stock": false
    },
    "quick_commerce": {
      "price": 2649.00,
      "in_stock": true,
      "delivery_fee": 29.00
    }
  },
  "competitors": [
    {
      "competitor": "Competitor A",
      "matched_sku": "CA-99201",
      "match_method": "gtin",
      "match_confidence": 0.99,
      "price": 2199.00,
      "effective_price": 2199.00,
      "in_stock": true
    },
    {
      "competitor": "Competitor B",
      "matched_sku": "CB-33417",
      "match_method": "attribute+image",
      "match_confidence": 0.91,
      "price": 2349.00,
      "effective_price": 2149.00,
      "promo": "10% coupon at checkout",
      "in_stock": true
    },
    {
      "competitor": "Competitor C",
      "matched_sku": "CC-77820",
      "match_method": "attribute",
      "match_confidence": 0.87,
      "price": 2599.00,
      "effective_price": 2599.00,
      "in_stock": false
    }
  ],
  "derived": {
    "own_price_spread": 400.00,
    "own_price_spread_pct": 17.4,
    "market_min_available": 2149.00,
    "market_median": 2349.00,
    "our_best_price": 2299.00,
    "gap_to_market_min_pct": 6.98,
    "parity_status": "internal_parity_breach",
    "verdict": "ALERT_UNDERCUT"
  }
}
That single record answers, in one glance, the four questions that used to take an analyst a morning:
- Are we internally consistent? No — a 400-unit spread across our own five channels on the same pan. That is a 17.4% internal price gap, and it is visible to any customer who checks two tabs.
- What is the real market floor? Not 2199, and not 2149 either — 2149 is the floor, but only because Competitor B's coupon is applied at checkout. Anyone reading the listed prices alone would conclude the floor was 2199 and price accordingly, and would be wrong by 50 units.
- Is the cheapest competitor even available? Competitor C at 2599 is out of stock, so it exerts no real competitive pressure and should be excluded from the floor calculation.
- What do we do? Verdict: undercut alert. We are 6.98% above an available market minimum on a SKU where we are also internally inconsistent.
The effective_price field is the one most systems get wrong. Listed price is not what a customer pays. Coupons, checkout discounts, bundle mechanics, delivery fees and BNPL framing all move the number. A cross-channel price monitoring program that benchmarks on listed price is benchmarking on fiction.
The Rules Engine: Turning Prices into Verdicts
The retailer defined five verdict classes. Every SKU × channel combination receives one on every refresh.
| Verdict |
Trigger Condition |
Routing |
| COMPLIANT |
Within policy band on all channels; no action |
Logged, no alert |
| INTERNAL_PARITY_BREACH |
Own-channel spread exceeds 5% on the same SKU |
Alert to channel owners; auto-fix eligible |
| ALERT_UNDERCUT |
Available market minimum is more than 3% below our best price on a Tier-1 SKU |
Alert to category manager within 15 min |
| ALERT_OVERPRICED |
We are more than 8% below market median — margin left on the table |
Weekly digest, not real-time |
| MARGIN_FLOOR_BREACH |
Any proposed price would breach cost + minimum margin |
Blocks automated repricing entirely |
Two design decisions in that table are worth calling out, because they are the ones that made the system usable rather than annoying.
- Not everything is an alert. ALERT_OVERPRICED — where we are cheaper than we need to be — is a real opportunity, often worth more money than undercut defence. But it is not urgent. Sending it in real time trains people to ignore the channel. It goes in a weekly digest, where it gets read.
- The margin floor is a hard block, not a warning. An automated repricing system that can be talked into selling below cost by a competitor's loss-leader is not an asset. It is a liability with an API.
The automated price matching system then applies action tiers:
- Confidence ≥ 0.95 + Tier-1 SKU + within guardrails → auto-reprice, log, notify
- Confidence 0.85–0.95 → recommend, human approves in one click
- Confidence < 0.85 → alert only, no recommendation
- Any margin floor breach → no action, escalate
The retailer runs continuous Real-Time Price Monitoring feeding this engine, with AI Dynamic Pricing Software handling the auto-reprice tier and AI Price Intelligence driving the strategic layer above it — elasticity estimation, promotional planning and category-level positioning.
Alert Design: The Part Everyone Underestimates
The first version of the alerting system sent 1,847 alerts in its first week. By week three, every recipient had muted the channel. The system was technically correct and operationally worthless.
The rebuild applied four rules, and they are the ones worth stealing:
- Alert on change, not on state. "Competitor A is cheaper" is a state, and it may have been true for six months. "Competitor A just dropped 8% on your #3 SKU" is a change, and it demands a response. Alert on the second, never the first.
- Tier by materiality. A price move on a SKU generating 0.02% of revenue is not an alert. It is a row in a report. The retailer's threshold: real-time alerts only for the top 15% of SKUs by revenue, which carried 68% of turnover. Everything else gets aggregated.
- Bundle by decision, not by SKU. Eleven separate alerts about eleven SKUs in the same subcategory, all responding to the same competitor promotion, is one decision. Send it as one alert with eleven lines, not eleven emails.
- Include the recommendation in the alert. An alert that says "you are undercut" creates work. An alert that says "you are undercut; recommended price 2,249; projected margin impact −1.2%; approve?" removes it. The second one gets acted on. The first one gets archived.
Post-rebuild alert volume: 30–45 per week, with a 91% action rate. That last number is the one that matters. An alert nobody acts on is not a signal; it is a cost.
Sample of the alert payload as delivered:
| Field |
Value |
| Alert ID |
ALT-2026-07-13-0042 |
| Type |
ALERT_UNDERCUT |
| Trigger |
Competitor B effective price dropped 9.2% (coupon applied at checkout) |
| SKUs affected |
11 (Cookware > Pans) |
| Revenue exposure (30d) |
₹4.1L |
| Our best available price |
₹2,299 |
| Market min (available only) |
₹2,149 |
| Match confidence (min across SKUs) |
0.91 |
| Recommendation |
Reprice 7 SKUs to match; hold 4 (margin floor) |
| Projected margin impact |
−1.2% blended |
| Action |
[Approve] [Modify] [Dismiss] |
Results
Ninety days after the rebuilt system went live:
| Metric |
Before |
After |
| SKU coverage |
120 (0.9%) |
14,000 (100%) |
| Channels monitored |
4 competitors, manual |
5 own + 6 competitors, automated |
| Refresh frequency |
Weekly |
Hourly (Tier 1), daily (long tail) |
| Time to detect competitor price move |
~6 days |
Under 40 minutes |
| Internal parity breaches (own channels) |
1,340 SKUs at any given time |
Under 90 |
| Analyst hours/week on price checking |
6 |
0.5 (review queue only) |
| Alert action rate |
n/a |
91% |
| Match precision |
71% (v1) |
96.4% (audited) |
| Gross margin |
Baseline |
+2.1 pts |
| Revenue on Tier-1 SKUs |
Baseline |
+7% |
The margin number deserves an explanation, because it is counterintuitive. Most people assume a price-matching system means margin loss — you find out you are expensive, you cut, margin falls.
The opposite happened. The largest single financial finding was not undercutting at all. It was that on 2,100 SKUs, the retailer was pricing well below the market for no strategic reason — a legacy of promotions that were never unwound and channel prices that were never reconciled. Raising those to market median, carefully and with elasticity checks, produced more margin than the defensive repricing cost. The system paid for itself on the ALERT_OVERPRICED verdict class, which nobody had prioritised during the build.
Pitfalls
- Matching on title similarity. It feels like it works. It does not. It works 71% of the time, and the 29% will destroy your credibility.
- Benchmarking on listed price. Coupons, checkout discounts, delivery fees and bundles move the effective price. Benchmark on what the customer actually pays.
- Including out-of-stock competitors in the floor. A price you cannot buy is not a price. It exerts no competitive pressure and should not drive your repricing.
- Alerting on everything. The fastest way to kill a price intelligence program is to make people mute it in week three.
- No margin floor. An auto-repricer without a hard cost-plus-margin block will eventually follow a competitor's loss-leader straight into negative unit economics, at scale, overnight.
- Ignoring your own channels. Most retailers build competitor monitoring and never point the same lens at themselves. In this case, internal parity breaches on 1,340 SKUs were doing more brand damage than any competitor was.
- Treating it as a project. It is a system. Channels change, competitors change, catalogues change. The collection layer needs permanent ownership — in-house or contracted, but never "done."
KPIs Worth Tracking
| Metric |
Healthy Target |
| SKU coverage |
100% of active catalogue |
| Match precision (audited) |
95%+, with confidence scores exposed |
| Extraction success rate |
97%+ |
| Freshness (Tier-1 SKUs) |
Under 1 hour |
| Time to detect competitor move |
Under 1 hour |
| Alert action rate |
85%+ (below this, you have a noise problem) |
| False alert rate |
Under 5% |
| Internal parity breach count |
Trending to near zero |
| Margin impact |
Positive, measured against a holdout set |
That last row matters more than any other. Run a holdout — a subset of SKUs deliberately excluded from automated repricing — and measure the difference. Without a holdout, you cannot distinguish the system's contribution from seasonality, and someone will eventually ask you to.
Compliance and Method
- Publicly displayed information only — the same prices and availability any shopper can see.
- No personal data. Prices are not people.
- Respectful, rate-limited collection that never degrades a source's service.
- Match confidence exposed, never hidden. A claim about a competitor's price carries its confidence score, and low-confidence claims never reach a decision-maker as fact.
- Benchmarking, not misrepresentation. Market data informs your pricing; it is never presented as inventory you hold.
FAQs
How long does a build like this take?
With the collection and normalization layer contracted out, a working v1 — SKU spine, matching, rules engine, alerting — is typically 10 to 14 weeks. Building the collection layer in-house adds a quarter and creates a permanent maintenance obligation that never becomes a competitive advantage.
Is 100% SKU coverage really necessary?
For monitoring, yes — it costs little and eliminates blind spots. For alerting, no. Alert in real time only on your top-revenue tier; aggregate everything else. Coverage and alerting are different questions, and conflating them is what produces alert fatigue.
What match precision is good enough?
95% audited is a workable floor for human-alerted decisions; automated repricing should require 98%+ on the individual match. And "audited" is doing real work in that sentence — a precision number nobody has hand-checked against a labelled sample is a guess.
Should repricing be fully automated?
Partially. Tier it by match confidence, SKU importance and guardrail compliance. Full automation inside tight guardrails on high-confidence, high-volume SKUs; human approval everywhere else. And always a hard margin floor that no automation can override.
Won't price matching just start a race to the bottom?
Only if your rules are written that way. The retailer here defined a policy band, not a "always be cheapest" rule — and their single largest gain came from raising prices where they were needlessly below market. A price matching system tells you where you stand. What you do about it is strategy, and strategy belongs to you.
Is this kind of data collection permissible?
Collecting publicly displayed prices and availability for benchmarking and competitive analysis is a long-established practice across retail. The requirements are: public data only, no personal data, non-disruptive and rate-limited collection, and use for benchmarking rather than misrepresentation. Build inside those lines.
Conclusion
The retailer in this story did not have a pricing problem. They had a visibility problem that looked like a pricing problem — five channels, six competitors, 14,000 SKUs, and a spreadsheet covering 0.9% of it once a week.
Automated Cross-Channel Price Matching & Alerts solved it in the only way it can be solved: complete coverage, a matching layer good enough to trust, a rules engine that converts prices into verdicts, and alerts that arrive as decisions rather than as data. The margin came not from cutting prices but from finally being able to see where they were wrong in both directions.
The lesson generalises. Every retailer selling across more than two channels is currently inconsistent with itself in ways its customers can see and it cannot. That gap is measurable, it is closeable, and it is almost always worth more than the cost of closing it.
Actowiz Solutions builds and operates the data layer behind programs like this one — multi-channel collection, SKU matching, normalized delivery — so your team can spend its time on pricing strategy rather than on scraper maintenance.
You can also reach us for all your mobile app scraping, data collection, web scraping, and instant data scraper service requirements — and request a free sample of a cross-channel pricing dataset before you commit to anything.

 By industry🏷 By platform🌐 By market
 Pricing & Promotions
MAP Violations Brand Protection Counterfeit Detection Price Intelligence AI HOT Data Intelligence
Pricing & Promotions
MAP Violations Brand Protection Counterfeit Detection Price Intelligence AI HOT Data Intelligence Brand & Intelligence
Share of Search Content Audit & PDP Reviews & Ratings Retail Media Buy Box Monitoring Social Commerce HOT Live Commerce NEW Agentic Commerce NEW
Brand & Intelligence
Share of Search Content Audit & PDP Reviews & Ratings Retail Media Buy Box Monitoring Social Commerce HOT Live Commerce NEW Agentic Commerce NEW Digital Shelf & Search
Assortment Planning Competitive Benchmarking Product Availability Q-Commerce NEW
Digital Shelf & Search
Assortment Planning Competitive Benchmarking Product Availability Q-Commerce NEW AssortmentE-commerce Intelligence Hyperlocal Insights POI & Store Locator DTC Brand Analytics NEW
 For Retailers
 E-Commerce Dashboard
 Flipkart Insights (Live) #1
 Grocery Intelligence
.svg) Grocery Price (U.S.)
Grocery Price (U.S.)
.svg) Quick Commerce (India) HOT
Quick Commerce (India) HOT
 Food & Restaurant
 Fashion Intelligence
 Automotive
 Travel & Hospitality
 Real Estate
 Food Delivery Intelligence NEW
 OTT & Streaming NEW
 Fuel & EV Charging Price Tracker NEW
 By Use Case
 Pricing Intelligence
 Digital Shelf Analytics
 MAP Monitoring HOT
 Cross-Border Price Parity NEW
 Share of Search
 Review Sentiment
 Kitchen Market Gaps NEW
 Dynamic Pricing / AI Repricing NEW
 Promotions & Deals Alerts NEW
 B2B / POI & Lead Data NEW
 AI Search Visibility Dashboard NEW
 Baby Products on Quick Commerce NEW
 Hotel & Flight Rate Parity NEW
 By Region🇮🇳 India 🇺🇸 USA 🇦🇪 Middle East 🇬🇧 UK 🇦🇺 Australia 🌏 SE Asia 🇪🇺 Europe 🌎 LATAMIndia
 Flipkart Real-Time Insights
 Quick Commerce — Zepto · Blinkit
 Pincode Price Tracker
Middle East
Pincode Price Tracker
Middle East GCC Q-Commerce — Talabat · Noon NEW
UK & Australia
GCC Q-Commerce — Talabat · Noon NEW
UK & Australia UK Grocery — Tesco, Sainsbury's, Asda
 AU Grocery — Coles & Woolworths NEW
 Marketplace Scrapers
Amazon API TikTok Shop API HOT Uber Eats API Airbnb API Zepto / Blinkit API Instacart API NEW Talabat API NEW
Marketplace Scrapers
Amazon API TikTok Shop API HOT Uber Eats API Airbnb API Zepto / Blinkit API Instacart API NEW Talabat API NEW Developer APIsWeb Extract API Reviews API SERP API Pricing Webhook NEW
 Universal APIsStreaming Crawl API Scheduler Realtime Alerts Webhook Delivery 🐍 Python SDK 💚 Node.js SDK
 Delivery & SDKs
 Knowledge Center
Digital Shelf Playbook MAP Compliance Guide Pricing Intel Guide Scraping Compliance TikTok Shop Guide NEW Cross-Border Guide NEW
Knowledge Center
Digital Shelf Playbook MAP Compliance Guide Pricing Intel Guide Scraping Compliance TikTok Shop Guide NEW Cross-Border Guide NEW Guides & Playbooks
🎉 Seasonal & event tracking NEWBlack Friday pricing report Festive season, India Ramadan, GCC grocery All seasonal reportsSample Datasets HOT ROI Calculator NEW API Postman Collection Demo Dashboards Free API Playground NEW Press Kit
Guides & Playbooks
🎉 Seasonal & event tracking NEWBlack Friday pricing report Festive season, India Ramadan, GCC grocery All seasonal reportsSample Datasets HOT ROI Calculator NEW API Postman Collection Demo Dashboards Free API Playground NEW Press Kit Downloads & Tools
Trust Center About Us FAQs Careers
Downloads & Tools
Trust Center About Us FAQs Careers Trust & CompanyRetail shelf research NEWRetail shelf research






































 4.8/5 Average Rating
 50+ Video Testimonials
 92% Client Retention
 50+ Countries Served