Introduction
Eight retailers. One shopping basket. Eight completely different pricing philosophies — and, increasingly, more than one price per retailer.
That last part is what broke the old way of doing this. For decades, UK grocery price comparison was straightforward: you took a basket, you checked the shelf price at each of the Big Four, you published a table. The shelf price was the price. Everyone paid it.
That world is gone. Today a tin of beans at Tesco has a Clubcard price and a non-Clubcard price, and the gap between them can be 40%. Sainsbury's has Nectar Prices. Morrisons has More Card prices. Asda has Rewards. Aldi and Lidl have no loyalty scheme at all and simply charge everyone the same low number — which is itself a pricing strategy, and an increasingly aggressive one. Meanwhile Tesco and Sainsbury's both run Aldi Price Match programmes that peg specific lines to the discounters, creating a small set of SKUs where the Big Four are deliberately identical to Aldi and everything else is not.
Add own-label tiering — where the same category contains a value line, a standard line and a premium line at each retailer, and where the value line is where the actual discounter battle is being fought — and the naive question "which supermarket is cheapest?" becomes almost unanswerable.
Almost. It is answerable, but only with proper Weekly Grocery Price Monitoring Across UK Supermarkets: matched products, price per unit, loyalty prices captured separately, own-label tiers segmented, tracked week over week across all eight retailers.
This is how that system is built — the data model, the matching problem, the loyalty-pricing trap, the sample data, and what the numbers actually show. Actowiz Solutions runs these programmes for FMCG brands, retailers, investors and researchers across the UK market.
Why the UK Market Is Uniquely Complicated
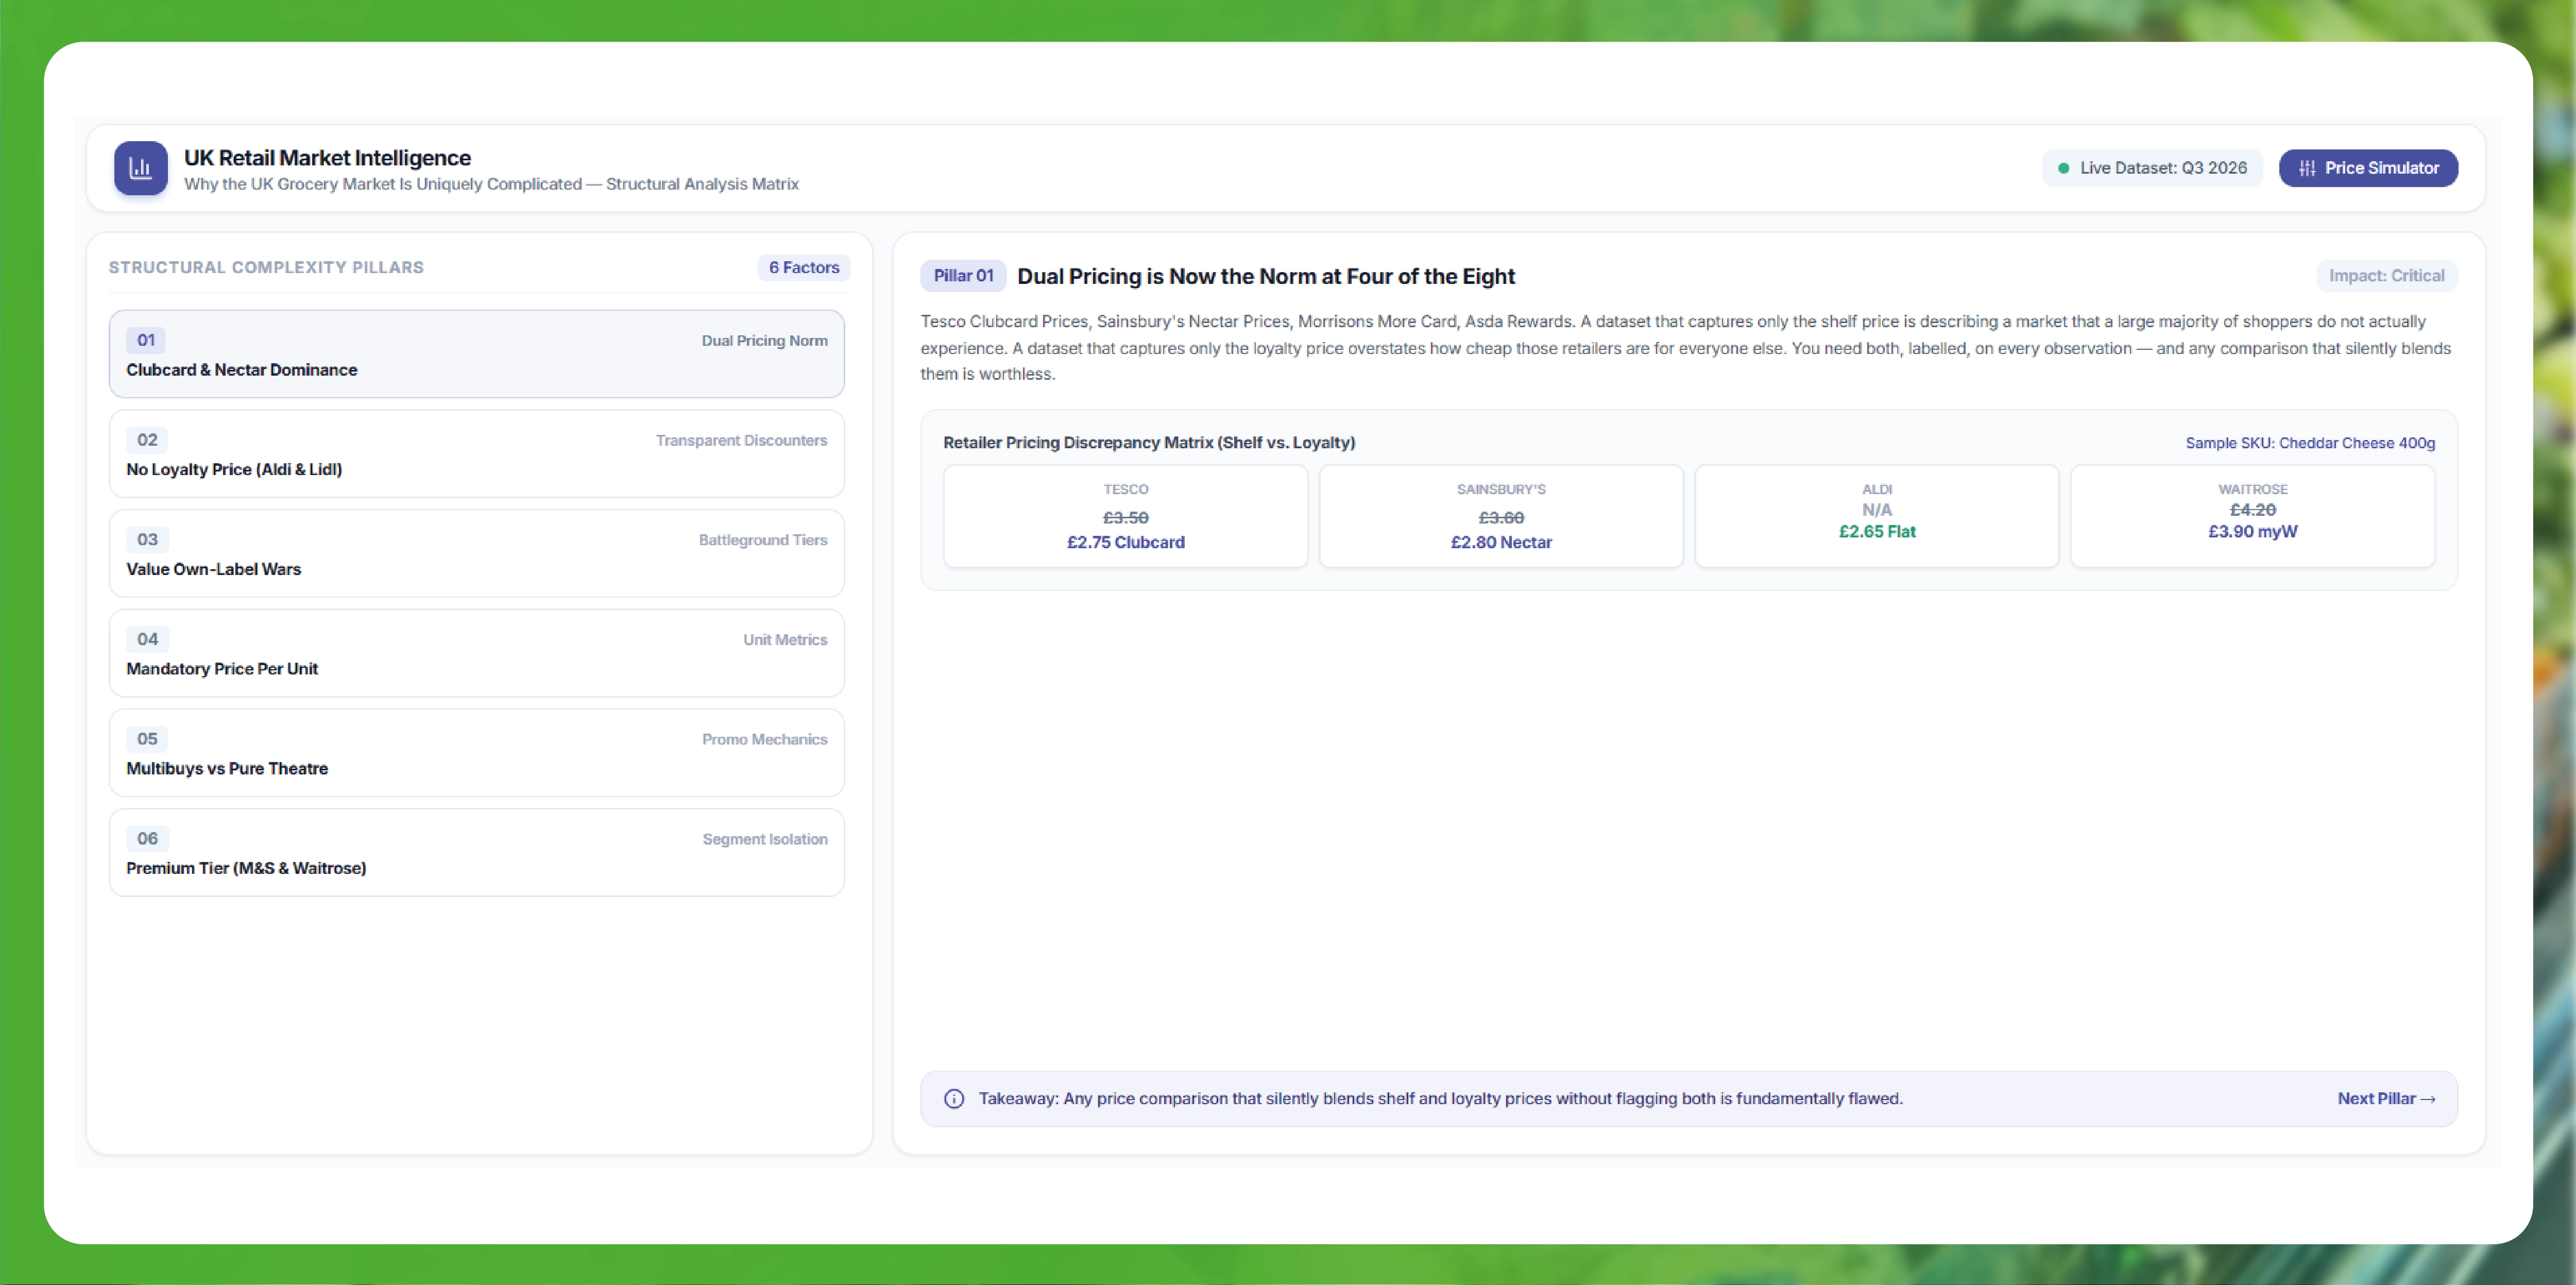
- Dual pricing is now the norm at four of the eight. Tesco Clubcard Prices, Sainsbury's Nectar Prices, Morrisons More Card, Asda Rewards. A dataset that captures only the shelf price is describing a market that a large majority of shoppers do not actually experience. A dataset that captures only the loyalty price overstates how cheap those retailers are for everyone else. You need both, labelled, on every observation — and any comparison that silently blends them is worthless.
- The discounters have no loyalty price — and that is the point. Aldi and Lidl charge one price to everyone. When you compare Tesco's Clubcard price to Aldi's price, Tesco frequently looks competitive. When you compare Tesco's non-Clubcard price to Aldi's, it frequently does not. Both comparisons are true. Which one matters depends entirely on which shopper you are talking about, and a serious analysis reports both.
- Own-label tiers are the real battleground. Tesco Stockwell's, Sainsbury's Stamford Street, Asda Just Essentials, Morrisons Savers — these value ranges exist for one reason: to blunt Aldi and Lidl. Comparing a branded product across all eight retailers tells you about brand pricing. Comparing value own-label to value own-label tells you who is actually winning the price war. These are different questions with different answers, and most published comparisons conflate them.
- Price per unit is mandatory here — and everyone ignores it anyway. UK retailers are legally required to display unit pricing, which is a gift to anyone doing this work. Yet most comparisons still run on pack price, which flatters whoever happens to sell the larger pack. Every legitimate comparison in this market runs on price per kg, per litre, per 100g or per item. There is no excuse not to, because the retailers hand you the number.
- Promotional mechanics differ by retailer. Multibuys, meal deals, "Only at Tesco" lines, Lidl's Middle-of-Lidl non-food chaos, Waitrose's myWaitrose free coffee. Some of these move the effective price and some are pure theatre. Distinguishing them is part of the job.
- Premium is a different market, not an expensive version of the same one. Comparing M&S or Waitrose to Aldi on absolute price produces a number that surprises nobody and informs no one. The useful comparison is within tier — premium against premium, value against value — with the cross-tier premium reported explicitly as a separate finding.
What to Collect
| Data Group |
Fields |
Why It Matters |
| Product identity |
Retailer SKU/product ID, product name, brand, pack size, unit, variant |
The join key |
| Matching |
EAN/GTIN where exposed, normalized brand, normalized pack, matched product key, match confidence |
Legitimacy of every comparison |
| Own-label tier |
Value / standard / premium / branded; own-label range name |
The real competitive battleground |
| Category |
Retailer category path, normalized category (Fresh, Dairy, Bakery, Meat & Fish, Ambient, Frozen, Household, Toiletries, Drinks) |
Category-level gap analysis |
| Price |
Shelf price, loyalty price (Clubcard / Nectar / More / Rewards), was-price, discount %, price per unit |
The comparison currency |
| Promotions |
Multibuy, meal deal, price-match flag (Aldi Price Match / Low Everyday Prices), promo start/end |
Effective price and promo intensity |
| Availability |
In stock / out of stock, delivery slot availability |
Is the price buyable? |
| Location |
Store, region, delivery postcode (where prices vary) |
Regional variance |
| Time |
Capture timestamp, ISO week number, day of week |
The weekly series |
Two fields carry the weight.
Loyalty price as a first-class field, never merged. Every observation carries shelf_price and loyalty_price as separate, explicitly typed fields. Two comparison baskets are then computed on every run: a loyalty basket and a non-loyalty basket. The gap between them is one of the most interesting numbers in UK grocery, and it is invisible to anyone storing a single price column.
Price per unit, always. UK retailers publish it. Use it. A 4-pint milk versus a 2-pint milk comparison on pack price is not analysis; it is arithmetic performed badly.
The Matching Layer
You cannot compare what you have not matched, and this is where most published UK grocery comparisons quietly fall apart.
- Tier 1 — EAN/GTIN match. Where exposed, exact. Covers branded packaged goods well. Covers own-label — the most important segment — hardly at all, because own-label products have no shared identifier across retailers by definition.
- Tier 2 — Brand + pack normalization. "Heinz Baked Beans 415g" versus "Heinz Beanz 415g" versus "Heinz Baked Beans In Tomato Sauce (415g)". Same product, three merchandising teams. Brand strings, pack sizes, unit notation and descriptive suffixes all need normalizing before they will join.
- Tier 3 — Own-label equivalence classes. The hard, essential one. Tesco Stockwell's chopped tomatoes and Asda Just Essentials chopped tomatoes are not the same product and never will be — they have different EANs, different suppliers, different recipes. But they occupy the same competitive position, and comparing them is the only way to see the value-tier price war. The correct construct is an equivalence class: same category, same tier, same pack size, compared on price per unit, with the non-identity disclosed rather than hidden.
- Tier 4 — Attribute + image similarity for anything the text cannot resolve.
- Tier 5 — Human review queue below the confidence threshold.
Every matched pair carries a confidence score, and that score travels with every derived number. A basket comparison built on unaudited matches is a headline, not a finding — and in this market, where the whole point is fractions of a percent, a bad match is not a rounding error. It is the entire result.
The pipelines underneath sit inside dedicated retailer practices — Sainsbury's Data Scraping Services, Tesco PLC Data Scraping Services, Waitrose & Partners Data Scraping, Aldi Data Scraping Services, Lidl Data Scraping Services and Morrisons Data Scraping — all feeding into the broader Grocery & FMCG Data Scraping practice at Actowiz Solutions.
Sample Data: What a Clean Record Looks Like
A single matched, normalized weekly observation:
{
  "capture_ts": "2026-07-13T06:20:11+01:00",
  "iso_week": "2026-W29",
  "matched_product_key": "AMB-BEANS-HEINZ-415G",
  "product_name": "Heinz Baked Beans in Tomato Sauce",
  "brand": "Heinz",
  "tier": "branded",
  "category_normalized": "Ambient > Tinned Goods > Beans",
  "pack_size_g": 415,
  "match_method": "ean",
  "match_confidence": 0.99,
  "retailers": {
    "tesco": {
      "sku": "TES-259871",
      "shelf_price_gbp": 1.40,
      "loyalty_price_gbp": 1.10,
      "loyalty_scheme": "Clubcard Prices",
      "price_per_100g_shelf": 0.337,
      "price_per_100g_loyalty": 0.265,
      "in_stock": true
    },
    "sainsburys": {
      "sku": "SAI-771204",
      "shelf_price_gbp": 1.45,
      "loyalty_price_gbp": 1.15,
      "loyalty_scheme": "Nectar Prices",
      "price_per_100g_shelf": 0.349,
      "price_per_100g_loyalty": 0.277,
      "in_stock": true
    },
    "asda": {
      "sku": "ASD-410092",
      "shelf_price_gbp": 1.38,
      "loyalty_price_gbp": null,
      "price_per_100g_shelf": 0.333,
      "in_stock": true
    },
    "morrisons": {
      "sku": "MOR-330118",
      "shelf_price_gbp": 1.42,
      "loyalty_price_gbp": 1.20,
      "loyalty_scheme": "More Card",
      "price_per_100g_shelf": 0.342,
      "price_per_100g_loyalty": 0.289,
      "in_stock": false
    },
    "waitrose": {
      "sku": "WTR-880431",
      "shelf_price_gbp": 1.50,
      "loyalty_price_gbp": null,
      "price_per_100g_shelf": 0.361,
      "in_stock": true
    },
    "marks_spencer": {
      "sku": "MNS-119027",
      "shelf_price_gbp": null,
      "note": "not_stocked_branded_equivalent",
      "in_stock": false
    },
    "aldi": {
      "sku": null,
      "note": "no_branded_equivalent_stocked",
      "own_label_equivalent_key": "AMB-BEANS-VALUE-400G"
    },
    "lidl": {
      "sku": null,
      "note": "no_branded_equivalent_stocked",
      "own_label_equivalent_key": "AMB-BEANS-VALUE-400G"
    }
  },
  "derived": {
    "cheapest_shelf": {"retailer": "asda", "price_per_100g": 0.333},
    "cheapest_loyalty": {"retailer": "tesco", "price_per_100g": 0.265},
    "shelf_spread_pct": 8.4,
    "loyalty_spread_pct": 9.1,
    "loyalty_advantage_tesco_pct": 21.4,
    "aldi_price_match_flag": false
  }
}
Two things in that record are doing all the work.
The Aldi and Lidl rows are null. They do not stock the branded product at all. This is not missing data — it is the finding. Roughly 90% of what Aldi and Lidl sell is own-label. Any branded-basket comparison that includes them is either quietly excluding them (and misrepresenting the basket) or comparing a Heinz tin to an own-label tin (and misrepresenting the product). The honest approach is to run two separate comparisons: a branded basket across the six that stock brands, and an own-label value basket across all eight.
The loyalty gap is 21.4% at Tesco. Shelf price 33.7p per 100g; Clubcard price 26.5p. Asda is cheapest on shelf price. Tesco is cheapest on loyalty price. Both statements are true simultaneously, and which one you print determines who wins your headline. This is precisely why the two prices are stored separately and reported separately, always.
The Weekly Comparison View
Aggregate the matched records and you get the artefact people actually use — a weekly, category-level, unit-normalized comparison across all eight:
Branded basket (240 matched SKUs, indexed to cheapest = 100):
| Retailer |
Shelf Index |
Loyalty Index |
WoW Shelf |
Aldi Price Match SKUs |
Stock-out Rate |
| Asda |
100.0 |
— |
−0.3% |
— |
3.1% |
| Tesco |
102.4 |
97.8 |
+0.2% |
41 |
2.4% |
| Morrisons |
103.1 |
99.6 |
−0.1% |
— |
4.0% |
| Sainsbury's |
104.0 |
99.1 |
+0.4% |
38 |
2.8% |
| Waitrose |
114.7 |
— |
+0.1% |
— |
2.0% |
| M&S |
119.2 |
— |
0.0% |
— |
1.7% |
Value own-label basket (180 equivalence-class pairs, indexed to cheapest = 100):
| Retailer |
Value Range |
Index |
WoW |
Notes |
| Aldi |
Own label |
100.0 |
−0.2% |
No loyalty scheme |
| Lidl |
Own label |
100.9 |
−0.4% |
No loyalty scheme |
| Asda |
Just Essentials |
104.2 |
+0.1% |
|
| Tesco |
Stockwell's |
105.6 |
−0.6% |
|
| Sainsbury's |
Stamford Street |
106.1 |
−0.3% |
|
| Morrisons |
Savers |
107.8 |
+0.2% |
|
| Waitrose |
Essential |
121.4 |
0.0% |
|
| M&S |
Everyday |
126.0 |
+0.1% |
|
Read those two tables together and the actual structure of the UK market appears.
The Big Four are within ~4% of each other on branded shelf price. Four percent. That is the entire competitive gap between Tesco, Asda, Sainsbury's and Morrisons on brands, and it is smaller than most people's price perception suggests. On brands, they are effectively the same shop with different logos.
Loyalty pricing reorders everything. Asda leads on shelf price. Tesco leads on loyalty price — and by enough to flip the ranking. If you have a Clubcard, Tesco is cheapest. If you do not, Asda is. This is not a nuance; it is two entirely different conclusions from the same week's data.
The value tier is where Aldi and Lidl still win, and it is not close on the metric that counts. Aldi and Lidl sit 4–8% below the Big Four's value own-label ranges — with no loyalty card required and no dual price to navigate. And that gap is measured against the Big Four's cheapest lines, not their standard ones.
The premium tier is a separate market. Waitrose and M&S sit 15–26% above, and their week-on-week movement is close to zero. They are not competing on price and their pricing behaviour proves it.
Aldi Price Match is narrow and targeted. 41 SKUs at Tesco, 38 at Sainsbury's, in a basket of 240. It is a defensive perimeter around a small, high-visibility set of lines — not a general price position. Tracking exactly which SKUs are inside that perimeter, and watching the list change week to week, tells you precisely where the Big Four believe they are most vulnerable.
Why Weekly Is the Right Cadence
Daily collection produces noise. UK grocery prices do move, but a daily chart of the Tesco–Aldi gap is mostly the sound of promotional cycles turning over.
Monthly collection misses the thing that matters: promotional cycles typically run in weekly rhythms, loyalty price lists refresh on weekly cadences, and competitive responses land within days.
Weekly is the resolution at which the pattern becomes legible — and it matches how the industry itself operates: weekly trading meetings, weekly promo cycles, weekly category reviews. Sainsbury's weekly price tracking, Tesco weekly pricing analysis, Asda weekly price data analytics, Waitrose weekly pricing data insights, Aldi grocery pricing intelligence, weekly Lidl supermarket price monitoring, Morrisons weekly price data and weekly Marks & Spencer grocery price data all land in the same weekly artefact, on the same matched basket, with the same normalization.
The collection underneath, though, runs daily. You aggregate to weekly for reporting so the weekly figure is a genuine average rather than one Tuesday morning that happened to catch a flash promo — and you alert in real time on the exceptions that cannot wait: a competitor's category-wide cut, a new Price Match tranche going live, a stock-out cascade.
What the Data Reveals Over Time
The loyalty gap is a strategic instrument, and it is widening. Track the average Clubcard/Nectar/More discount by category over 26 weeks and you can see, precisely, which categories each retailer has decided to defend with loyalty pricing rather than shelf pricing. It is not uniform, and it is not random. It is where they think the switchers are.
Own-label value ranges move independently of brands. During inflationary periods, value own-label frequently outpaces branded inflation as retailers reformulate and reprice to protect entry price points. Watching those two series diverge is one of the clearest early indicators of margin pressure in the sector.
Price Match lists are a confession. The SKUs a retailer chooses to peg to Aldi are the SKUs where they know they are losing. The list changes. Watching what gets added — and what quietly gets dropped — is a live feed of competitive anxiety.
Stock-out rates correlate with premium positioning. Waitrose and M&S run consistently lower stock-out rates. That is a service proposition being delivered, and it is part of what the premium buys. It also means their prices are more reliably buyable, which a price-only comparison never captures.
Promotional intensity is measurable by category and week. Build the index, watch it spike, and you will know a campaign is live before the brand team's own agency reports it.
Who Uses This
- FMCG brands monitor price realisation across all eight retailers, detect where their brand's shelf price has drifted, measure whether trade investment converted to shelf price or was absorbed, and see exactly where own-label is undercutting them on the price-per-unit metric shoppers actually use.
- Retailers benchmark their own position — shelf and loyalty, brand and own-label, category by category — against every competitor, weekly, rather than against a quarterly market report.
- Investors and analysts track relative price positioning as a leading indicator of volume share shifts and margin pressure, long before it appears in a trading statement.
- Category and trading teams walk into supplier negotiations with the week's numbers rather than last quarter's impression.
- Researchers, journalists and policy bodies get a defensible evidence base for the cost-of-living conversation — one that distinguishes, properly, between what a Clubcard holder pays and what everybody else does.
Compliance and Method
- Publicly displayed information only — the same prices, offers and availability any shopper sees on the retailers' public sites.
- No personal data. Prices are not people; nothing collected identifies a shopper.
- Respectful, rate-limited collection that never degrades any retailer's service.
- Loyalty and shelf prices always labelled and reported separately. Blending them is not a simplification; it is a misrepresentation, and this market has enough of those already.
- Methodology published with the numbers. Basket composition, match confidence, capture window, tier definitions and equivalence-class logic travel with every comparison. A price index without its methodology is a press release.
- Benchmarking, not misrepresentation. The data informs pricing and strategy; it is never presented as inventory anyone holds.
KPIs for the Programme
| Metric |
Healthy Target |
| Matched branded SKUs |
200+ for credible category-level claims |
| Own-label equivalence pairs |
150+ across value and standard tiers |
| Match precision (audited) |
96%+, with confidence exposed |
| Loyalty price capture rate |
99% at the four dual-pricing retailers |
| Price-per-unit normalization coverage |
100% (the retailers publish it — there is no excuse) |
| Retailer coverage |
All 8, every week, same basket |
| Collection freshness |
Daily collection, weekly reporting |
| Stock/availability capture |
On every price observation, same timestamp |
FAQs
Which UK supermarket is actually cheapest?
It depends on two things you must specify before the question means anything: which basket and which shopper. On a branded basket at shelf price, Asda typically leads the Big Four by a small margin. On the same basket with loyalty pricing, Tesco frequently leads. On a value own-label basket, Aldi and Lidl lead everyone, and by more than the Big Four's marketing would suggest. Any single-number answer is hiding one of those three findings.
Why can't you just compare Aldi to Tesco directly?
Because roughly 90% of Aldi's range is own-label. There is no Heinz to compare to Heinz. The only legitimate comparison is own-label to own-label, within a tier, on price per unit, through an explicit equivalence class — with the non-identity of the products disclosed, not hidden.
Should loyalty prices be included in a comparison?
Both should be, separately and always. Loyalty schemes have very high penetration but not universal penetration, and the gap between the two prices at a single retailer routinely exceeds the gap between retailers. Publishing one number without stating which price type it uses is the most common — and most misleading — error in UK grocery comparison.
Why price per unit rather than pack price?
Because pack sizes differ systematically across retailers and tiers, and UK retailers are legally required to publish unit prices anyway. Comparing pack prices flatters whoever sells the bigger pack and tells you nothing about value.
How many SKUs do you need for a credible index?
200+ matched branded SKUs and 150+ own-label equivalence pairs, spread across all major categories, with audited match precision above 96%. Below that, individual outliers start driving the index and the conclusions become fragile.
Is this kind of data collection permissible?
Collecting publicly displayed prices, offers and availability for benchmarking and market analysis is a long-established practice across UK retail, and price transparency is broadly in the public interest. The requirements are: public data only, no personal data, non-disruptive rate-limited collection, and use for benchmarking rather than misrepresentation.
Conclusion
The UK grocery market is usually described with a single number — a basket, a winner, a headline. That number is almost always wrong, because it has quietly chosen a basket that suits it, quietly picked a price type, and quietly excluded the two retailers that do not stock brands.
Weekly Grocery Price Monitoring Across UK Supermarkets replaces that with a measurement that can survive scrutiny: matched products, unit-normalized, own-label tiers segmented, loyalty and shelf prices captured separately, all eight retailers, every week, with the methodology attached.
And what it shows is more interesting than any headline. The Big Four are within four percent of each other on brands and are fighting the real war in own-label. The loyalty schemes are not a discount mechanism — they are a pricing structure, and they change who is cheapest. The discounters still lead where it counts, without asking anyone to carry a card. And the Aldi Price Match lists are a weekly published confession of exactly where the incumbents feel most exposed.
None of that is visible from a shelf-price screenshot on a Tuesday.
Actowiz Solutions builds and runs these weekly programmes end to end — matched baskets across all eight retailers, daily collection, weekly reporting, delivered as a dashboard or a feed.
You can also reach us for all your mobile app scraping, data collection, web scraping , and instant data scraper service requirements!

 Pricing & Promotions
MAP Violations Brand Protection Counterfeit Detection Price Intelligence AI HOT Data Intelligence
Pricing & Promotions
MAP Violations Brand Protection Counterfeit Detection Price Intelligence AI HOT Data Intelligence Brand & Intelligence
Share of Search Content Audit & PDP Reviews & Ratings Retail Media Buy Box Monitoring Social Commerce HOT Live Commerce NEW Agentic Commerce NEW
Brand & Intelligence
Share of Search Content Audit & PDP Reviews & Ratings Retail Media Buy Box Monitoring Social Commerce HOT Live Commerce NEW Agentic Commerce NEW Digital Shelf & Search
Assortment Planning Competitive Benchmarking Product Availability Q-Commerce NEW
Digital Shelf & Search
Assortment Planning Competitive Benchmarking Product Availability Q-Commerce NEW AssortmentE-commerce Intelligence Hyperlocal Insights POI & Store Locator DTC Brand Analytics NEW
 For Retailers
 E-Commerce Dashboard
 Flipkart Insights (Live) #1
 Grocery Intelligence
.svg) Grocery Price (U.S.)
Grocery Price (U.S.)
.svg) Quick Commerce (India) HOT
Quick Commerce (India) HOT
 Food & Restaurant
 Fashion Intelligence
 Automotive
 Travel & Hospitality
 Real Estate
 Food Delivery Intelligence NEW
 OTT & Streaming NEW
 By Use Case
 Pricing Intelligence
 Digital Shelf Analytics
 MAP Monitoring HOT
 Cross-Border Price Parity NEW
 Share of Search
 Review Sentiment
 Kitchen Market Gaps NEW
 Dynamic Pricing / AI Repricing NEW
 Promotions & Deals Alerts NEW
 B2B / POI & Lead Data NEW
 By Region🇮🇳 India 🇺🇸 USA 🇦🇪 Middle East 🇬🇧 UK 🇦🇺 Australia 🌏 SE Asia 🇪🇺 Europe 🌎 LATAMIndia
 Flipkart Real-Time Insights
 Quick Commerce — Zepto · Blinkit
 Pincode Price Tracker
Middle East
Pincode Price Tracker
Middle East GCC Q-Commerce — Talabat · Noon NEW
UK & Australia
GCC Q-Commerce — Talabat · Noon NEW
UK & Australia UK Grocery — Tesco, Sainsbury's, Asda
 AU Grocery — Coles & Woolworths NEW
 Marketplace Scrapers
Amazon API TikTok Shop API HOT Uber Eats API Airbnb API Zepto / Blinkit API Instacart API NEW Talabat API NEW
Marketplace Scrapers
Amazon API TikTok Shop API HOT Uber Eats API Airbnb API Zepto / Blinkit API Instacart API NEW Talabat API NEW Developer APIsWeb Extract API Reviews API SERP API Pricing Webhook NEW
 Universal APIsStreaming Crawl API Scheduler Realtime Alerts Webhook Delivery 🐍 Python SDK 💚 Node.js SDK
 Delivery & SDKs
 Knowledge Center
Digital Shelf Playbook MAP Compliance Guide Pricing Intel Guide Scraping Compliance TikTok Shop Guide NEW Cross-Border Guide NEW
Knowledge Center
Digital Shelf Playbook MAP Compliance Guide Pricing Intel Guide Scraping Compliance TikTok Shop Guide NEW Cross-Border Guide NEW Guides & Playbooks
🎉 Seasonal & event tracking NEWBlack Friday pricing report Festive season, India Ramadan, GCC grocery All seasonal reportsSample Datasets HOT ROI Calculator NEW API Postman Collection Demo Dashboards Free API Playground NEW Press Kit
Guides & Playbooks
🎉 Seasonal & event tracking NEWBlack Friday pricing report Festive season, India Ramadan, GCC grocery All seasonal reportsSample Datasets HOT ROI Calculator NEW API Postman Collection Demo Dashboards Free API Playground NEW Press Kit Downloads & Tools
Trust Center About Us FAQs Careers
Downloads & Tools
Trust Center About Us FAQs Careers Trust & CompanyRetail shelf research NEWRetail shelf research






































 4.8/5 Average Rating
 50+ Video Testimonials
 92% Client Retention
 50+ Countries Served