🎃 HALLOWEEN OFF Spooky Savings Event! Get FLAT 20% OFF on all Web Scraping & Data Extraction Plans 20% OFF Web Scraping Plans!
Ends in: 00d : 00h : 00m : 00s
🦇
👻
🎃 Spooktacular Limited Offer

Don’t Let High Data Costs Haunt You! 🎃

Get FLAT 20% OFF

T&C Apply

Scrape competitor prices, monitor MAP, and extract real-time datasets at a spooky discount this Halloween.

Offer Expires In:
00d : 00h : 00m : 00s
⚡ Claim 20% Discount Now
🎃
Promo Code Copied!
SPOOKY30 (20% OFF Applied)
Core services
Enterprise Data Extraction

Scalable web, app and AI-powered collection across 40+ countries.

All 58 services →
New 2026
AI Training Data

Corpus building with provenance and opt-out compliance.

Learn more →
Free pilot
24-hour sample

We run collection on your own sources before you commit.

Get a sample →
58Services
40+Countries
DEVELOPER

Ready-Made Scrapers

Pre-built for top platforms. Self-serve, no setup.

View All →
TRY FREE

API Playground

Test endpoints instantly. No credit card.

Start Free →
28Tools
2SDKs
icons Delivery & SDKs
Streaming Crawl API Scheduler Realtime Alerts Webhook Delivery 🐍 Python SDK 💚 Node.js SDK
Need it managed instead?

Fixed monthly retainer, named engineer, no per-request metering.

Managed Data API →
HOT

Case Studies

How brands use Actowiz, with named outcomes.

Read →
FREE

Sample Datasets

Real output, no signup.

Download →
NEW

ROI Calculator

Model the return on a data engagement.

Calculate →
Zoomcar Data Intelligence 2026: Rental Market Insights

Introduction

Online retailers face a persistent challenge: product prices, discounts, availability, and competing offers can change faster than manual research can reliably capture. Without historical observations, businesses may miss important price movements, overlook emerging product categories, or make decisions based on outdated listing information.

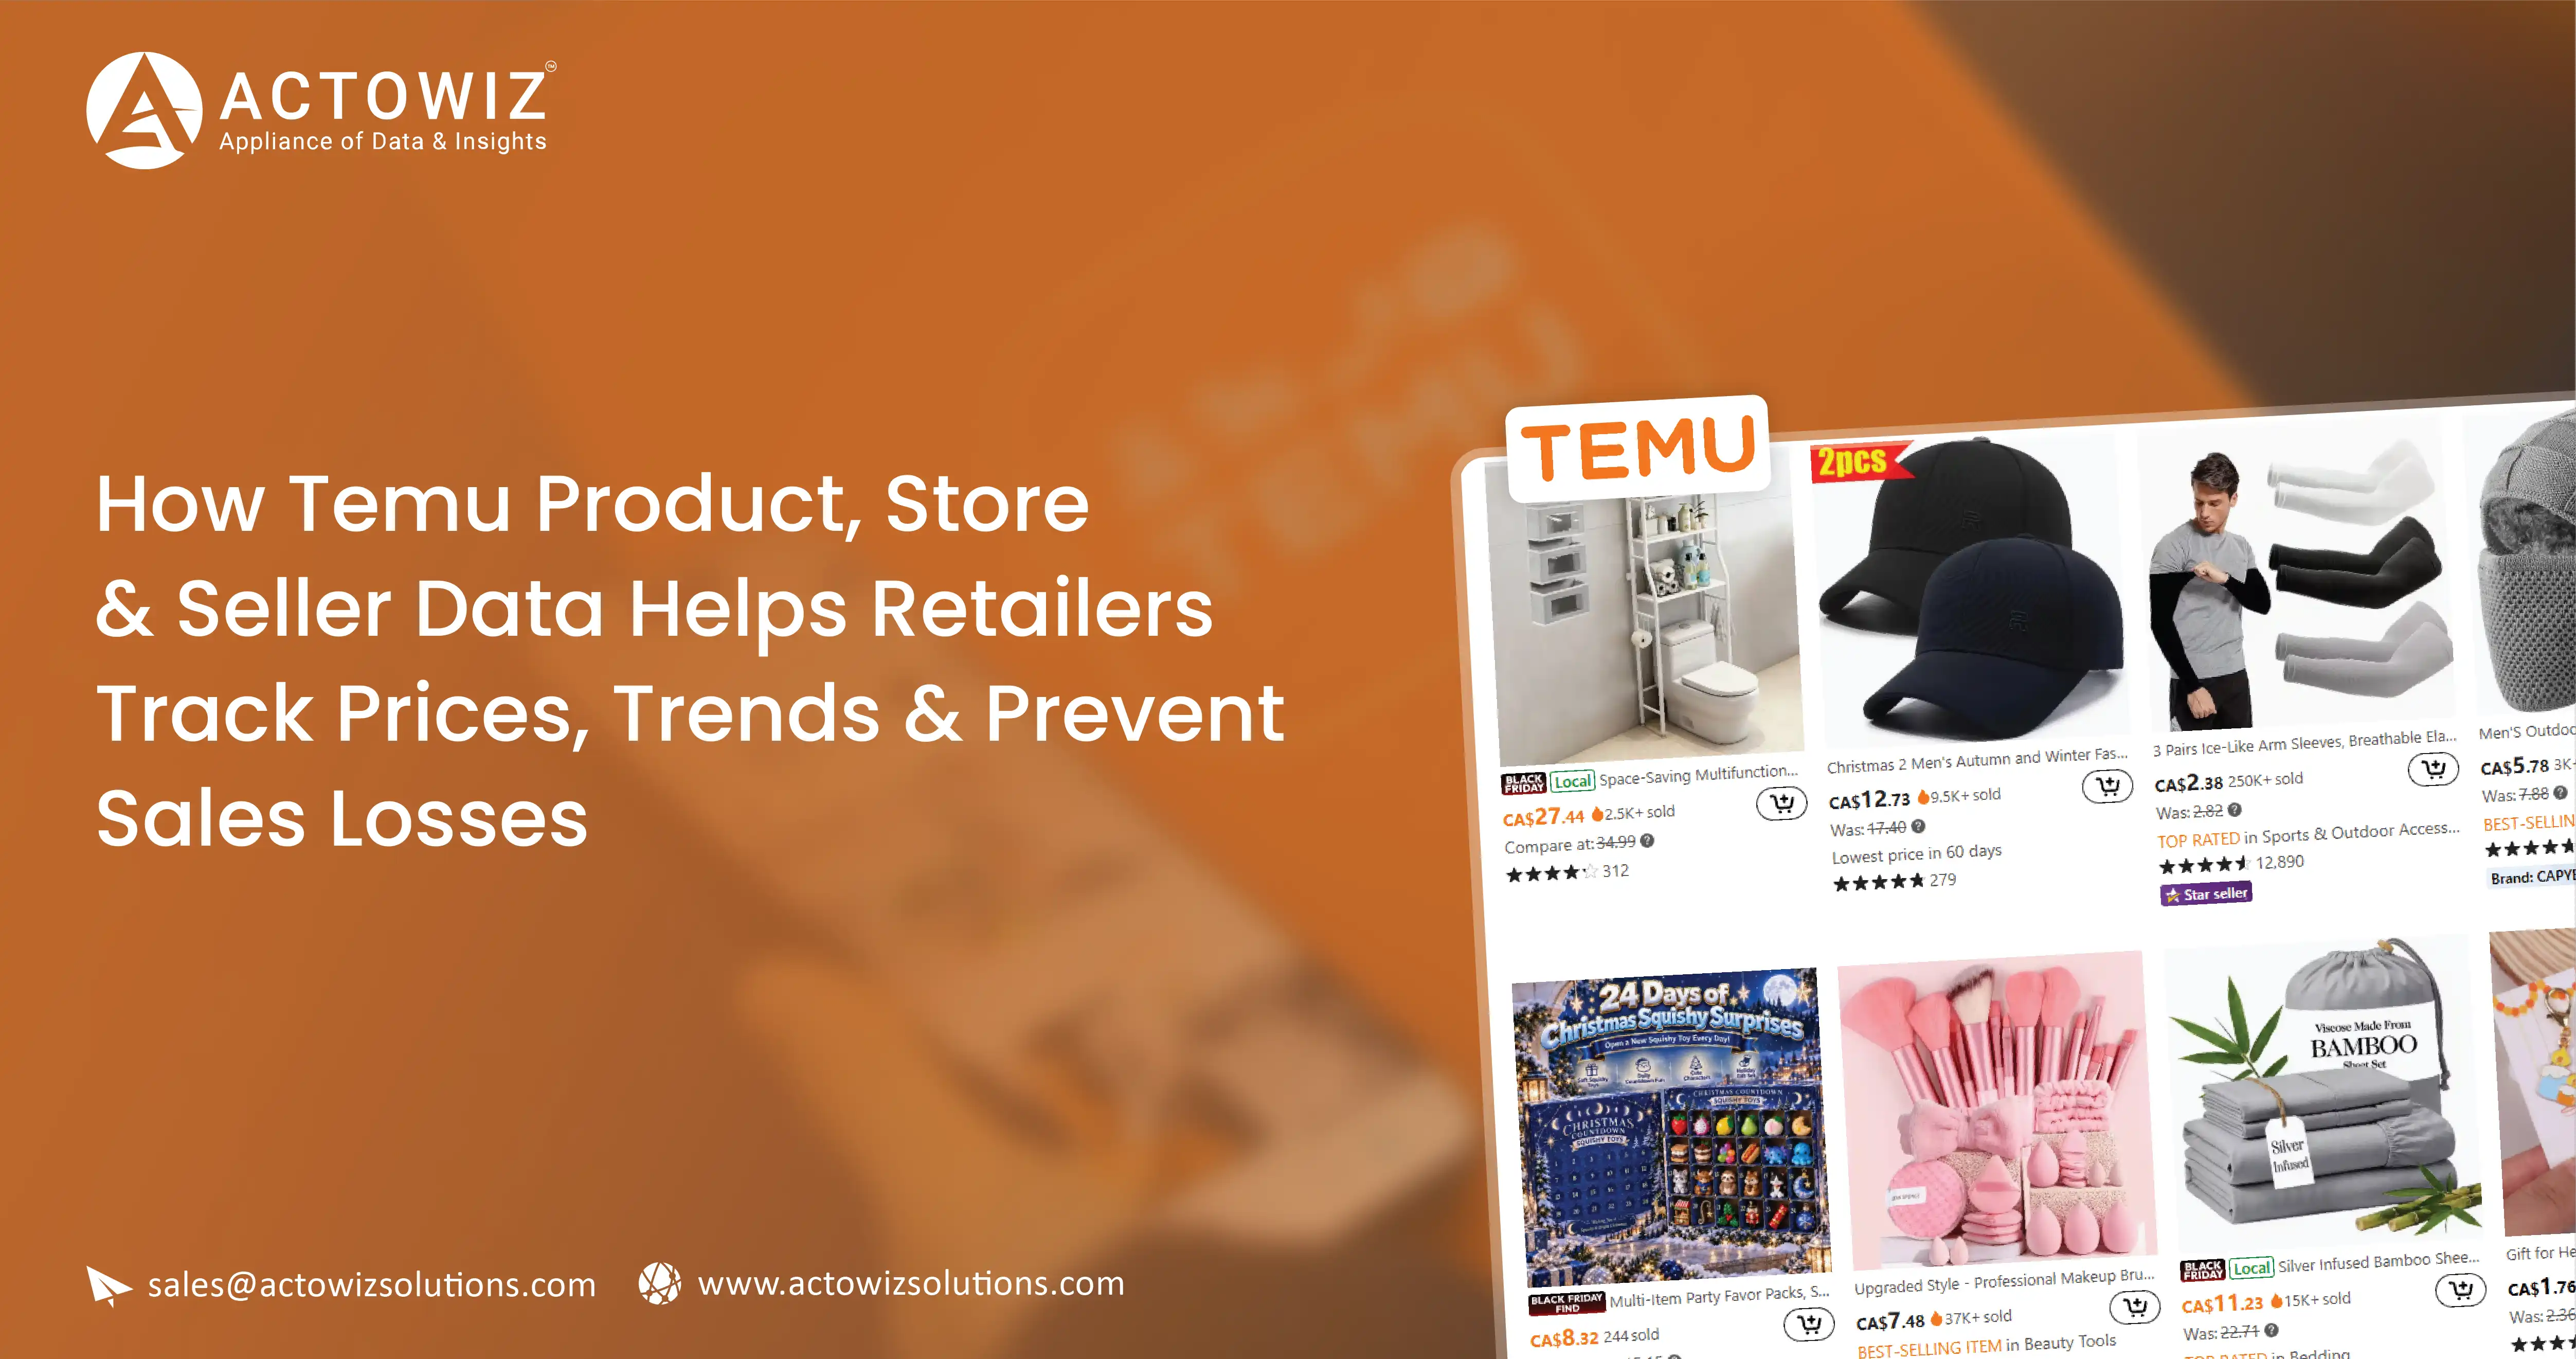
Temu, an e-commerce platform launched in September 2022, connects consumers with a network of merchants, manufacturers, and brands. PDD Holdings describes the platform's international expansion and broad product selection in its 2024 annual filing. This marketplace model makes product-level and merchant-level analysis potentially useful for retailers researching competitive positioning and assortment changes.

A structured Temu data with multi-observation pricing approach records comparable product information at different points in time. Rather than treating a price as a permanent attribute, analysts preserve each observation with its timestamp, currency, availability status, discount information, and relevant product identifiers. This helps distinguish a genuine price movement from a change in product variant, listing, or promotion.

For Actowiz Solutions, the objective is to help businesses turn authorized, accessible marketplace information into organized datasets for competitive analysis. Retailers can use these datasets to prioritize pricing reviews, identify product gaps, and evaluate market trends. The results are most useful when combined with internal sales, inventory, and margin information.

One important limitation applies: Temu's published Terms of Use restrict certain automated collection activities, including scraping and crawling, except under narrowly described circumstances. Businesses should verify the applicable regional terms and obtain the necessary authorization before collecting data. A data strategy should never assume that publicly viewable information is automatically available for unrestricted automated extraction.

Which product and merchant details help retailers identify competitive gaps?

Product and merchant analysis starts with consistent identification. Retailers need to distinguish similar products, variants, and sellers before drawing conclusions about price differences or assortment gaps. A dataset that combines unrelated product variants can produce misleading comparisons and lead to poor pricing decisions.

Temu products stores & merchant information extraction can organize available product identifiers, titles, category labels, displayed prices, variant details, listing URLs, and visible availability information. Where authorized and accessible, store or merchant fields can be recorded separately, with the original labels preserved so analysts do not accidentally interpret a display name as a verified legal business identity.

For businesses researching the Saudi market, a Temu Saudi Product Dataset could be scoped around the relevant product categories, displayed currency, available listings, and observation dates. The actual coverage must first be confirmed for the target region; data availability, localized listings, and merchant fields should not be assumed to be identical across countries.

Useful checks include:

  • Match products using identifiers and meaningful attributes, not titles alone.
  • Keep colors, sizes, pack quantities, and model variants distinct.
  • Store seller or merchant names exactly as displayed, with a separate normalized field when needed.
  • Record the collection timestamp and market context for every observation.
  • Mark missing fields explicitly instead of filling gaps with guesses.

The business outcome is a more dependable comparison set. Retailers can investigate which categories have many competing offers, where comparable products show different prices, and where assortment coverage may be limited. These findings can inform merchandising and sourcing research, but merchant information should be independently verified before it is used for supplier approval or other high-impact decisions.

How can repeated observations reveal pricing and availability changes?

A single product snapshot shows what was visible at one moment. Repeated observations show how the listing changes over time. Retailers can use these records to identify price increases or decreases, track stock-status changes, and determine whether a displayed discount persists or disappears.

A Scrape Temu product pricing and availability data Scraping workflow should only be implemented through an authorized method that complies with applicable platform terms. Depending on the permission and source arrangement, this may involve approved feeds, licensed data access, or another explicitly permitted collection method.

An Ecommerce Dashboard can then summarize historical observations, highlight significant changes, and help teams prioritize products for review. Each record should preserve the original price, displayed discount, currency, availability state, product variant, and timestamp. A price-change calculation is meaningful only when the records refer to the same comparable item.

Broader retail data provides useful context for this work. The U.S. Census Bureau's e-commerce series, published through the Federal Reserve Bank of St. Louis, reports quarterly retail e-commerce sales. The following figures are calculated by summing the four unadjusted quarterly observations for each complete calendar year; 2026 includes only the first two quarters.

Period U.S. retail e-commerce sales Coverage
2020 US$798.5 billion Full year
2021 US$936.6 billion Full year
2022 US$997.5 billion Full year
2023 US$1,087.0 billion Full year
2024 US$1,170.0 billion Full year
2025 US$1,233.7 billion Full year
2026 US$630.8 billion First half only

Source: U.S. Census Bureau retail e-commerce sales data, via FRED. Figures are rounded from quarterly values in millions of U.S. dollars. These are U.S. retail market figures, not Temu-specific sales or evidence of Temu's market share.

The series shows the expanding scale of U.S. online retail, but it cannot establish why a particular Temu product gains or loses sales. Retailers should use their own observations to test pricing and availability patterns rather than infer platform-specific performance from overall market growth.

How can seller-level information improve competitive analysis?

Seller-level information can help retailers understand how marketplace listings are distributed across merchants and product categories. It can also help identify situations where similar products appear under different listings, making simple title-based comparisons unreliable.

Temu seller information for competitive analysis can include visible merchant labels, listing references, product-category associations, and observable differences between comparable offers, provided collection and use are authorized. The dataset should distinguish observed seller details from independently verified company information. A displayed merchant name alone does not establish business registration, manufacturing capability, product quality, or supplier reliability.

Retailers can use this information to investigate three questions. First, are comparable products offered through multiple listings? Second, do visible prices differ after accounting for product specifications and quantities? Third, are particular categories showing changes in the number or variety of observable offers?

The main keyword Collect Data from Temu Products, Stores & Seller/Merchant describes the broader research objective: linking product-level observations to the available store and merchant context. In practice, these relationships should be stored as separate fields connected through stable identifiers wherever possible.

A seller-analysis dataset may support:

  • Competitor mapping: Identify observed merchants associated with relevant categories.
  • Listing comparison: Group equivalent products while keeping variants separate.
  • Price benchmarking: Compare matched offers using the same currency and product specifications.
  • Assortment research: Track additions, removals, and changes in visible listings.
  • Verification workflows: Flag merchant details that require independent confirmation.

The findings should guide further research, not automatically determine supplier selection. Retailers still need appropriate checks for compliance, intellectual property, quality, fulfillment, and commercial terms. This distinction is important because marketplace visibility and competitive pricing are not substitutes for verified supplier due diligence.

What should a structured catalog contain to support reliable comparisons?

A useful catalog combines consistent product records with a history of observations. The catalog describes the product and its attributes; the observation history records what changed and when. Keeping those layers separate prevents a new price from overwriting the earlier value and preserves the evidence needed for trend analysis.

Temu product catalog & merchant data Collection should therefore begin with a defined schema. Core fields may include a product identifier, original title, normalized title, category, variant attributes, displayed price, currency, discount details, availability status, visible merchant label, source reference, and observation timestamp. Only fields available through an authorized source should be included.

A practical data-quality process includes the following checks:

  • Identity validation: Confirm that records represent the same product and variant before comparing them.
  • Price validation: Preserve the original displayed value and check that currency and unit information are consistent.
  • Availability validation: Distinguish unavailable, out-of-stock, discontinued, and unknown statuses when the source supports those distinctions.
  • Duplicate handling: Detect repeated observations without deleting legitimate historical changes.
  • Provenance tracking: Store the source and timestamp so each value can be traced to its observation.
  • Exception review: Flag missing or inconsistent values instead of silently correcting them.

These practices are useful beyond a single marketplace. The U.S. Census Bureau's e-commerce data program, for example, publishes methodology and time-series information alongside sales estimates, illustrating why definitions and data context matter when interpreting figures.

For retailers, a consistent catalog supports product matching, category analysis, and reporting across repeated collection periods. It also helps teams distinguish a genuine market change from a data-processing error. The dataset should be updated according to the business need and the access method permitted by the source, with refresh frequency clearly documented.

How can historical records help retailers respond before pricing gaps become costly?

Historical records help teams compare current observations with previous ones rather than relying on memory or isolated screenshots. When products are matched accurately, retailers can calculate absolute price changes and percentage changes, identify recurring discounts, and investigate changes in visible availability.

To Build a Temu product price monitoring dataset, Collect Data from Temu Products, Stores & Seller/Merchant as a repeatable process, businesses should establish a baseline, schedule authorized observations, validate each new record, and retain prior values. The monitoring period should match the commercial decision: a seasonal assortment review may need a different cadence from a frequently changing product category.

A basic analysis can calculate:

  • Absolute price change: Current comparable price minus previous comparable price.
  • Percentage price change: Absolute price change divided by the previous comparable price, multiplied by 100.
  • Discount movement: Difference between comparable displayed discount values, where both are available and calculated consistently.
  • Availability movement: A recorded change between supported availability states.
  • Observation coverage: The proportion of target products with usable records for the period.

These metrics need guardrails. A product's price may appear to change because the selected size, bundle, seller listing, or market currency changed. Discounts can also have eligibility conditions that are not visible in a product listing. Records with uncertain matching or incomplete context should be excluded from direct comparisons or clearly flagged.

Retailers can use exception reports to prioritize manual review of significant changes. For example, a matched product with a notable price movement could be sent to a category manager to check competitor positioning and internal margin implications. The dataset does not prove that the change caused lost sales; internal transaction and conversion data are needed to test that relationship.

The aim is to reduce the time between observing a market change and investigating it. Better visibility supports faster, more disciplined decisions without assuming that every competitor price should be matched.

How can retailers track discounts without confusing temporary offers with lasting trends?

Discount analysis is most useful when each offer is recorded with its surrounding conditions. A discounted price can reflect a temporary promotion, a limited quantity, a product variant, or an offer available only to eligible shoppers. Comparing the discount label alone may therefore create an inaccurate picture of market pricing.

Track Temu product prices and discounts over time by maintaining separate fields for the original displayed price, current displayed price, discount text or value, observation timestamp, product variant, and any visible promotion conditions. If the source does not provide a reliable reference price or promotion end date, the dataset should not infer one.

Retailers can then distinguish short-lived price changes from patterns that persist across multiple observations. A repeated reduction across several snapshots may justify further review, but it still does not establish the seller's underlying cost, margin, or reason for changing the price.

A useful monitoring report should include:

  • Products with price changes since the previous observation.
  • Products whose displayed discounts have appeared, changed, or disappeared.
  • Matched products with unusually large differences between comparable offers.
  • Listings whose availability status has changed.
  • Records requiring validation because product identity or promotion conditions are unclear.

Teams should combine these findings with their own sales, inventory, and margin records. If a retailer experiences falling conversion, competitor price data may help identify one possible factor, but other causes—such as delivery times, product quality, advertising, or customer demand—may also be relevant.

A disciplined historical view helps category managers choose which products to review first. It also discourages reactive price matching based on one potentially temporary offer. The strongest decisions come from consistent observations, verified product matching, and an understanding of the retailer's own commercial constraints.

How can Actowiz Solutions help retailers build a dependable data workflow?

Actowiz Solutions can help retailers plan and structure marketplace intelligence projects around defined business questions, approved data sources, and clear validation requirements. The scope can be tailored to product categories, regional coverage, merchant fields, observation frequency, and the reporting format required by the client.

Through Ecommerce Data Scraping Services, Collect Data from Temu Products, Stores & Seller/Merchant, businesses can explore a data workflow that emphasizes authorized access, product matching, historical tracking, and data quality. Because Temu's terms restrict certain forms of automated collection, the source-access method must be confirmed before implementation. Where permission is not available, an approved feed, licensed provider, or alternative lawful source should be considered.

A project may include:

  • Requirements mapping: Define the fields needed for pricing, assortment, availability, and merchant analysis.
  • Schema design: Establish product identifiers, variant rules, timestamps, currencies, and provenance fields.
  • Data validation: Flag duplicates, incomplete observations, and inconsistent product matches.
  • Historical storage: Preserve successive observations for trend analysis rather than overwriting earlier values.
  • Reporting support: Organize validated data for business intelligence tools and category-management workflows.

The deliverable should make clear which values were directly observed, which were calculated, and which remain unverified. This helps analysts interpret changes responsibly and gives decision-makers a clearer view of data coverage and limitations.

Conclusion

Collecting consistent product, store, and merchant information can help retailers detect pricing changes, monitor visible discounts, understand assortment shifts, and prioritize competitive reviews. The key is to compare like-for-like products, preserve timestamps, validate the data, and use internal sales and margin information before making commercial decisions.

A carefully designed Collect Data from Temu Products, Stores & Seller/Merchant workflow can turn isolated marketplace observations into a useful historical dataset. Its effectiveness depends on accurate product matching, reliable source access, and compliance with the applicable platform terms and laws.

Ready to improve your marketplace intelligence with a Real-time dataset and Collect Data from Temu Products, Stores & Seller/Merchant to support smarter pricing analysis? Contact Actowiz Solutions to build a data workflow tailored to your business needs!

You can also reach us for all your mobile app scraping, data collection, web scraping, and instant data scraper service requirements!

Social Proof That Converts

Trusted by Global Leaders Across Q-Commerce, Travel, Retail, and FoodTech

Our web scraping expertise is relied on by 4,000+ global enterprises including Zomato, Tata Consumer, Subway, and Expedia — helping them turn web data into growth.

4,000+ Enterprises Worldwide
50+ Countries Served
20+ Industries
Join 4,000+ companies growing with Actowiz →
Real Results from Real Clients

Hear It Directly from Our Clients

Watch how businesses like yours are using Actowiz data to drive growth.

▶
1 min
★★★★★
"Actowiz Solutions offered exceptional support with transparency and guidance throughout. Anna and Saga made the process easy for a non-technical user like me. Great service, fair pricing!"
TG
Thomas Galido
Co-Founder / Head of Product at Upright Data Inc.
▶
2 min
★★★★★
"Actowiz delivered impeccable results for our company. Their team ensured data accuracy and on-time delivery. The competitive intelligence completely transformed our pricing strategy."
II
Iulen Ibanez
CEO / Datacy.es
▶
1:30
★★★★★
"What impressed me most was the speed — we went from requirement to production data in under 48 hours. The API integration was seamless and the support team is always responsive."
FC
Febbin Chacko
-Fin, Small Business Owner
icons 4.8/5 Average Rating
icons 50+ Video Testimonials
icons 92% Client Retention
icons 50+ Countries Served

Join 4,000+ Companies Growing with Actowiz

From Zomato to Expedia — see why global leaders trust us with their data.

Why Global Leaders Trust Actowiz

Backed by automation, data volume, and enterprise-grade scale — we help businesses from startups to Fortune 500s extract competitive insights across the USA, UK, UAE, and beyond.

icons
7+
Years of Experience
Proven track record delivering enterprise-grade web scraping and data intelligence solutions.
icons
4,000+
Projects Delivered
Serving startups to Fortune 500 companies across 50+ countries worldwide.
icons
200+
In-House Experts
Dedicated engineers across scrapers, AI/ML models, APIs, and data quality assurance.
icons
9.2M
Automated Workflows
Running weekly across eCommerce, Quick Commerce, Travel, Real Estate, and Food industries.
icons
270+ TB
Data Transferred
Real-time and batch data scraping at massive scale, across industries globally.
icons
380M+
Pages Crawled Weekly
Scaled infrastructure for comprehensive global data coverage with 99% accuracy.

AI Solutions Engineered
for Your Needs

→
LLM-Powered Attribute Extraction: High-precision product matching using large language models for accurate data classification.
→
Advanced Computer Vision: Fine-grained object detection for precise product classification using text and image embeddings.
→
GPT-Based Analytics Layer: Natural language query-based reporting and visualization for business intelligence.
→
Human-in-the-Loop AI: Continuous feedback loop to improve AI model accuracy over time.
icons Product Matching icons Attribute Tagging icons Content Optimization icons Sentiment Analysis icons Prompt-Based Reporting

Connect the Dots Across
Your Retail Ecosystem

We partner with agencies, system integrators, and technology platforms to deliver end-to-end solutions across the retail and digital shelf ecosystem.

icons
Analytics Services
icons
Ad Tech
icons
Price Optimization
icons
Business Consulting
icons
System Integration
icons
Market Research
Become a Partner →

Popular Datasets — Ready to Download

Browse All Datasets →
icons
Amazon
eCommerce
Free 100 rows
icons
Zillow
Real Estate
Free 100 rows
icons
DoorDash
Food Delivery
Free 100 rows
icons
Walmart
Retail
Free 100 rows
icons
Booking.com
Travel
Free 100 rows
icons
Indeed
Jobs
Free 100 rows

Latest Insights & Resources

View All Resources →
thumb
Blog

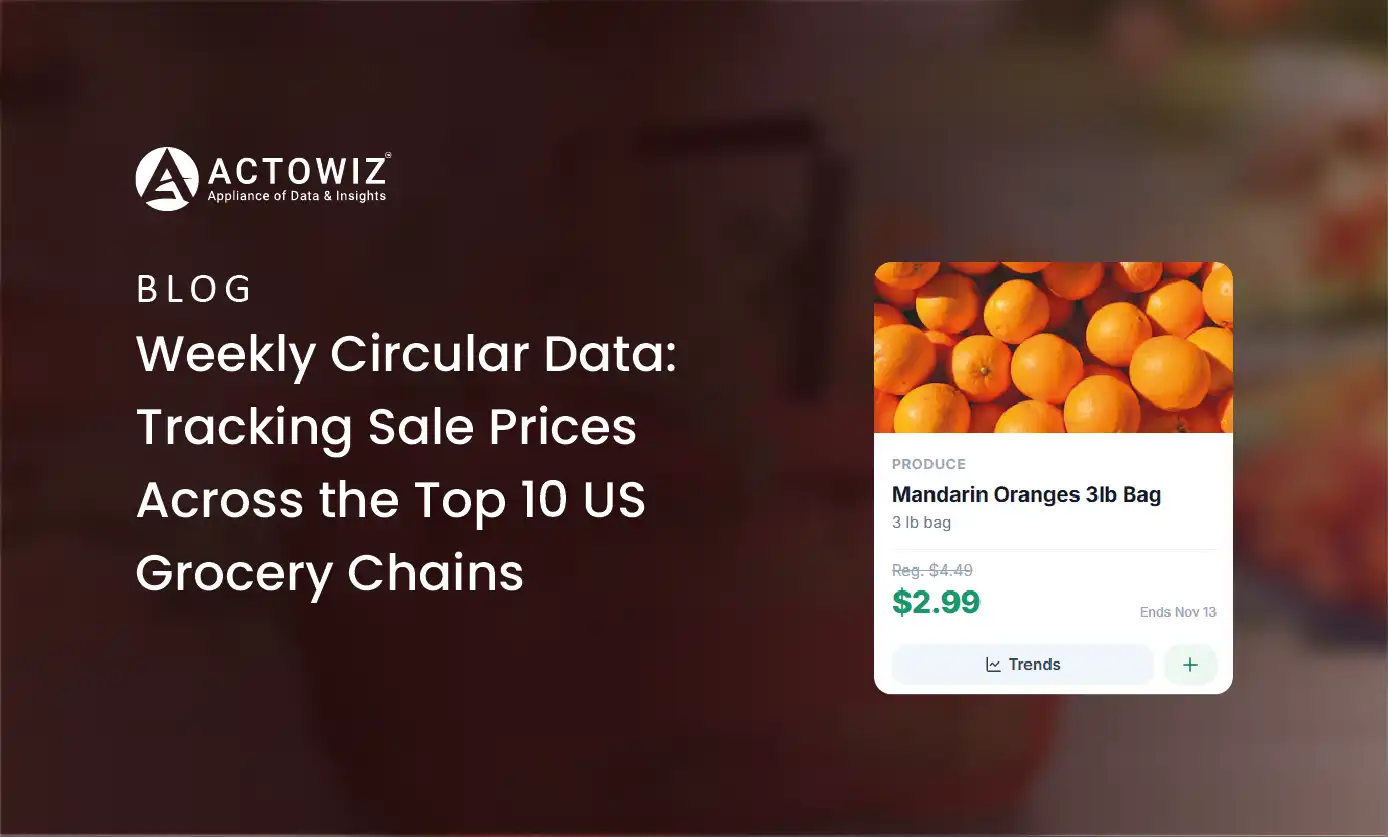
Weekly Circular Data: Tracking Sale Prices Across the Top 10 US Grocery Chains

Track weekly grocery circular data across the top 10 US grocery chains. Analyze sale prices, discounts, promotions, product offers, and competitor pricing trends.

thumb
Case Study

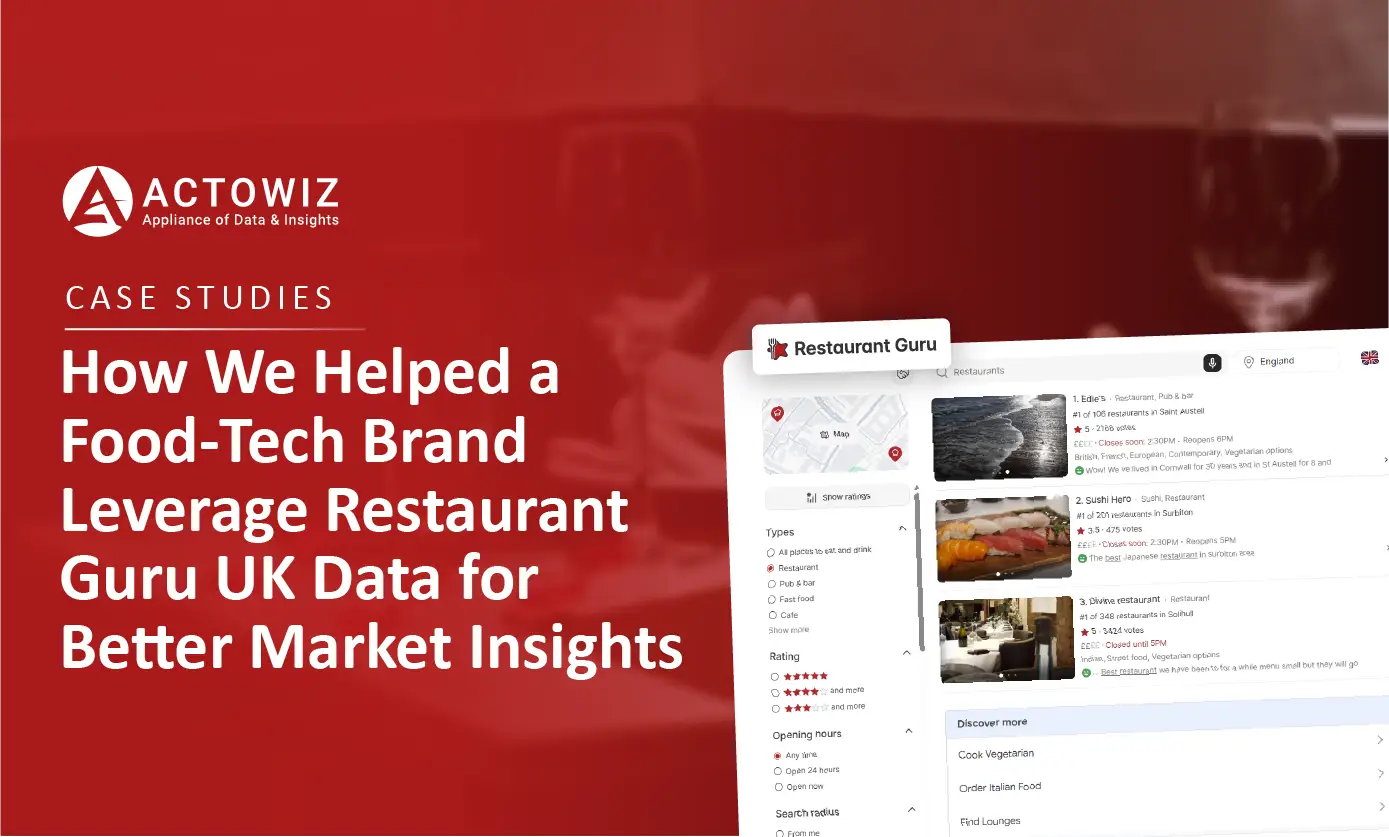
How We Helped a Leading Food-Tech Brand Leverage Restaurant & Menu Data from RestaurantGuru UK for Smarter Market Analysis

Explore Restaurant & Menu Data from RestaurantGuru UK to analyze restaurant listings, menus, pricing, ratings, and dining trends.

thumb
Report

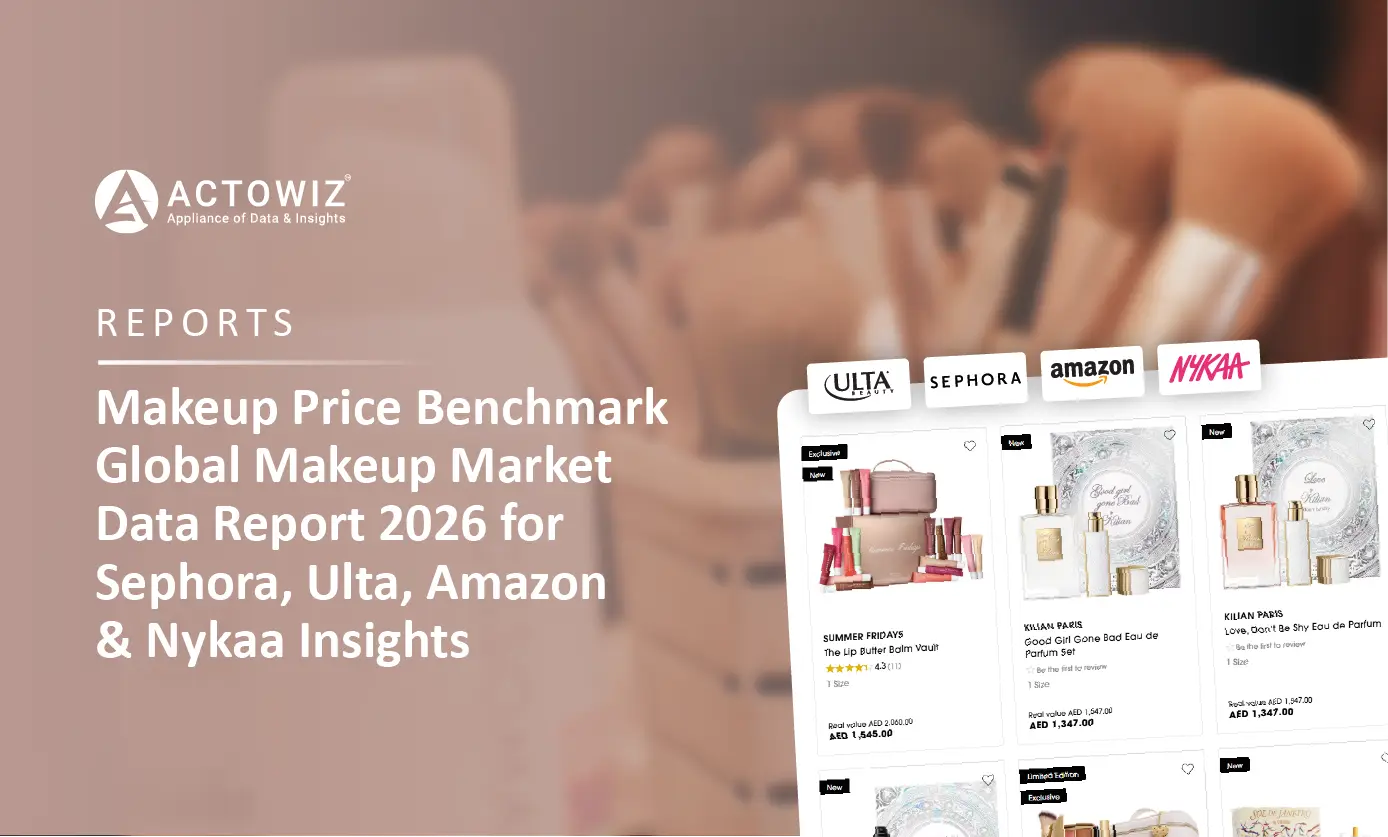
Makeup Price Benchmark: Global Makeup Market Data Report 2026 for Sephora, Ulta, Amazon & Nykaa Insights

Global makeup price benchmark 2026: how L'Oreal, Estee Lauder, Maybelline and MAC products are priced across Sephora, Ulta, Amazon and Nykaa.

Start Where It Makes Sense for You

Whether you're a startup or a Fortune 500 — we have the right plan for your data needs.

icons
Enterprise
Book a Strategy Call
Custom solutions, dedicated support, volume pricing for large-scale needs.
icons
Growing Brand
Get Free Sample Data
Try before you buy — 500 rows of real data, delivered in 2 hours. No strings.
icons
Just Exploring
View Plans & Pricing
Transparent plans from $500/mo. Find the right fit for your budget and scale.
Get in Touch
Let's Talk About
Your Data Needs
Tell us what data you need — we'll scope it for free and share a sample within hours.
  • icons
    Free Sample in 2 HoursShare your requirement, get 500 rows of real data — no commitment.
  • icons
    Plans from $500/monthFlexible pricing for startups, growing brands, and enterprises.
  • icons
    US-Based SupportOffices in New York & California. Aligned with your timezone.
  • icons
    ISO 9001 & 27001 CertifiedEnterprise-grade security and quality standards.
Request Free Sample Data
Fill the form below — our team will reach out within 2 hours.
+1 ▼
✓ Free 500-row sample · No credit card · Response within 2 hours

Request Free Sample Data

Our team will reach out within 2 hours with 500 rows of real data — no credit card required.

+1 ▼
✓ Free 500-row sample · No credit card · Response within 2 hours