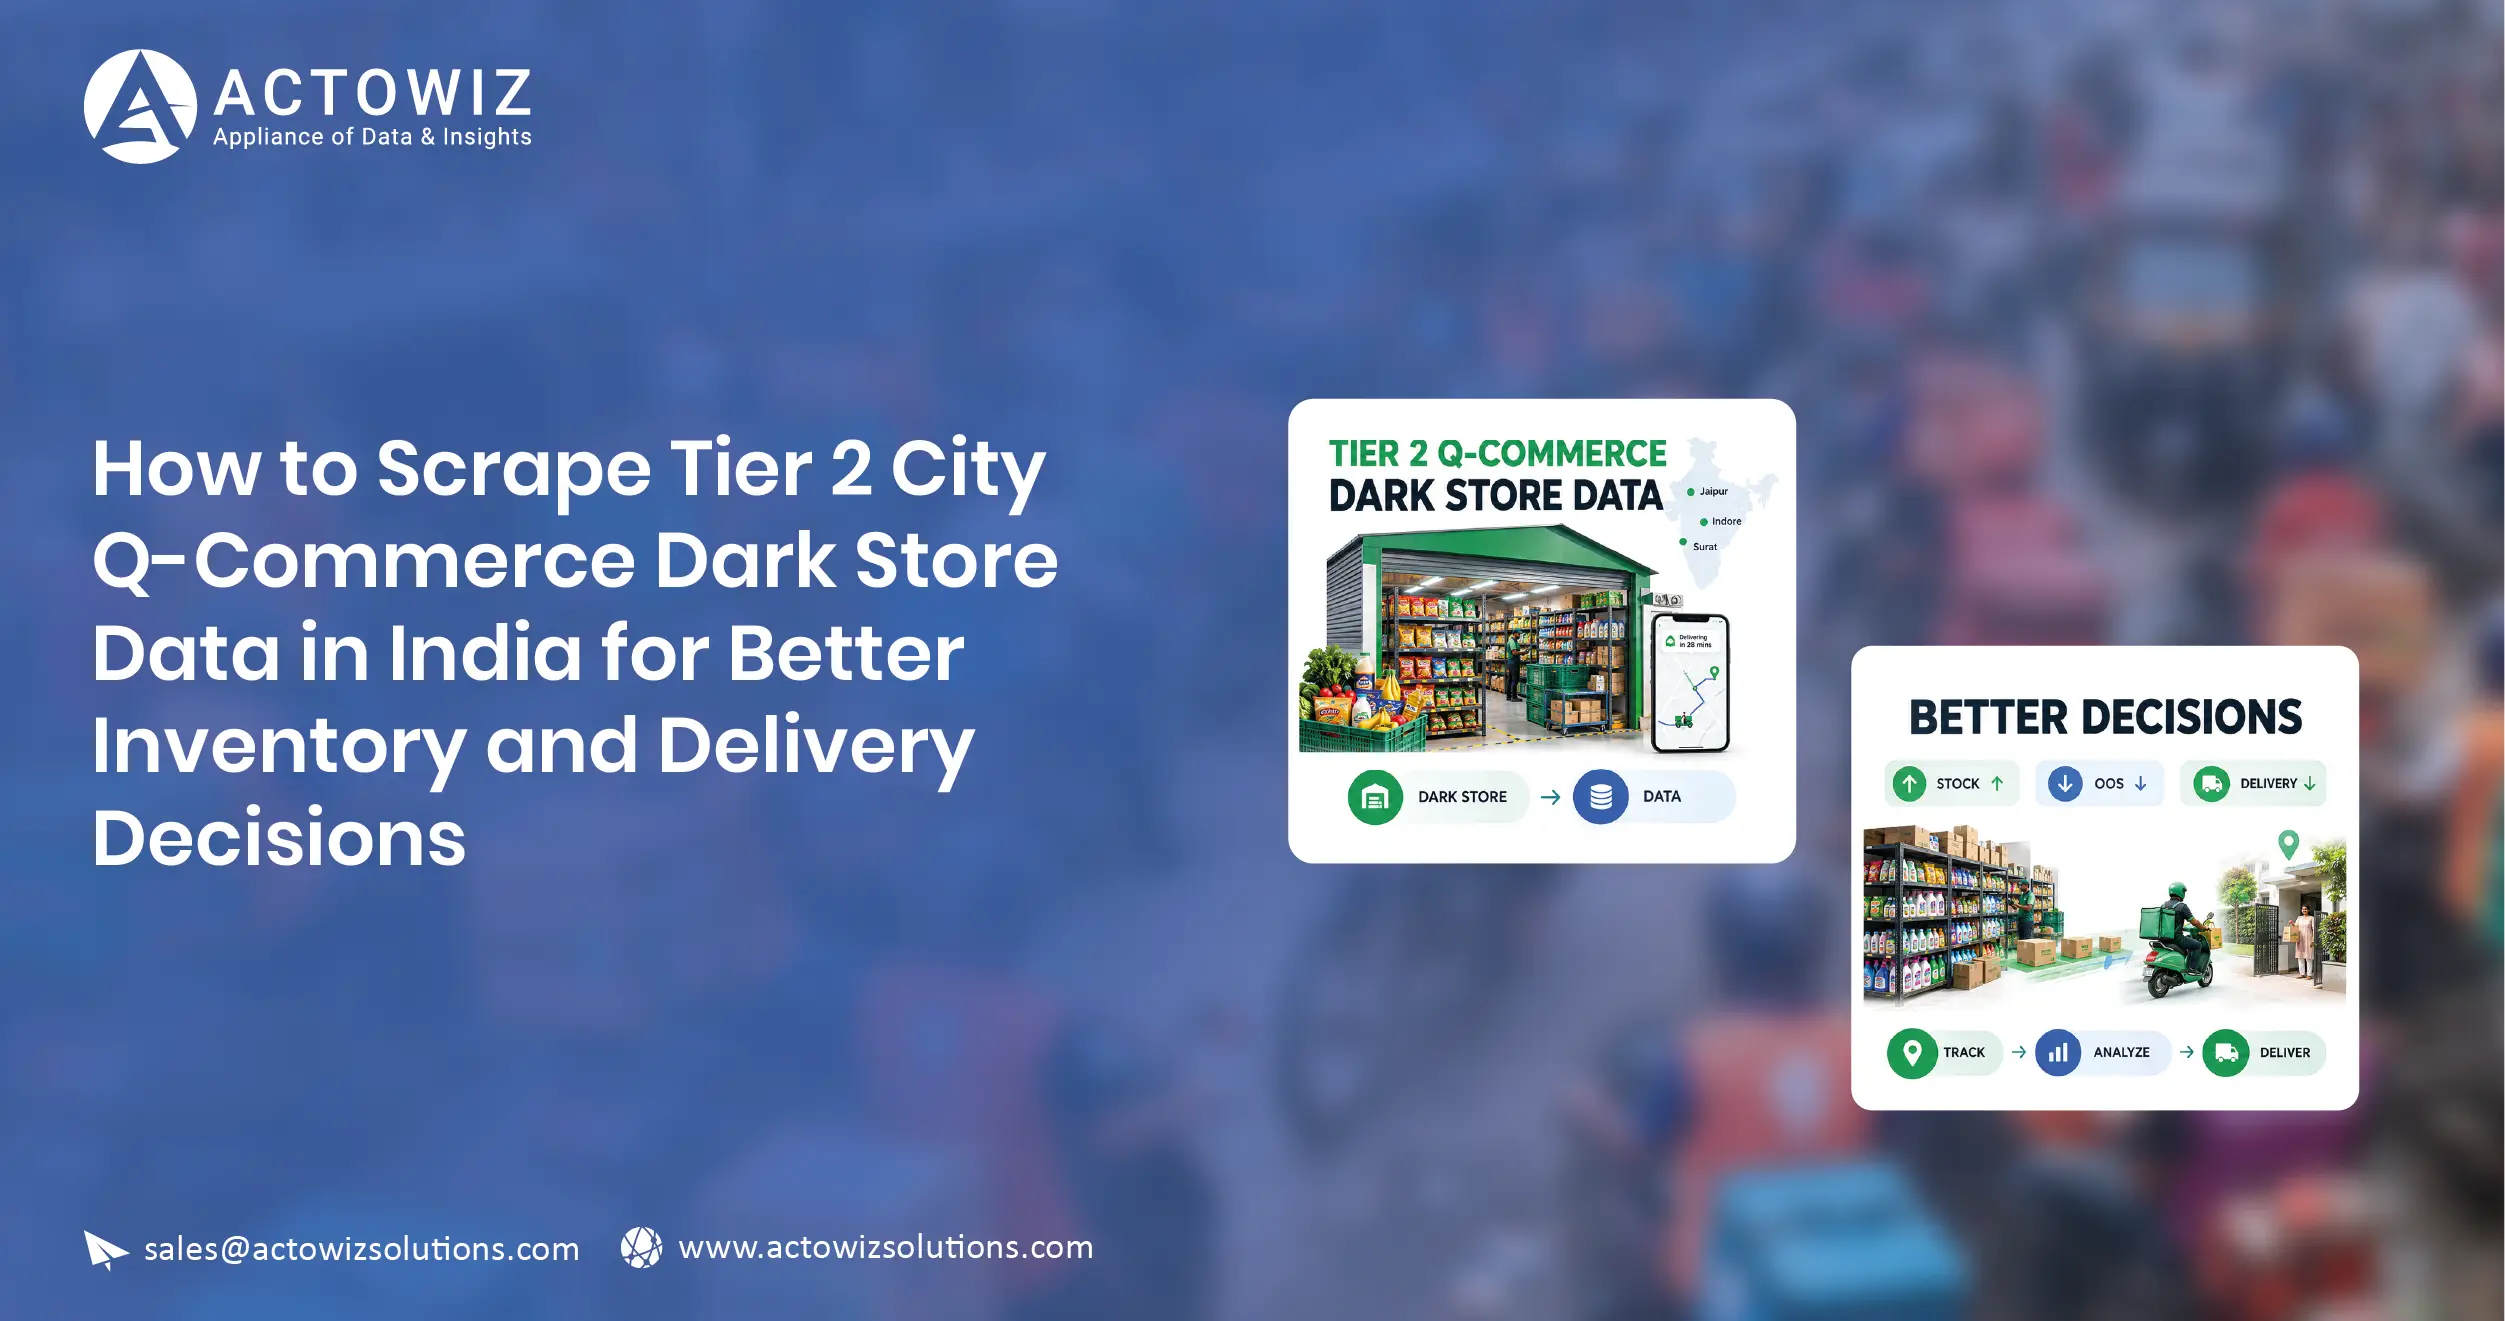
Introduction
Scrape Tier 2 City Q-Commerce Dark Store Data in India to understand where quick-commerce fulfillment networks are expanding, which products are available, how competitors are positioned, and where inventory or delivery gaps exist. For brands, retailers, FMCG companies, and Q-commerce operators, this intelligence supports better inventory allocation, local assortment planning, competitor benchmarking, and expansion decisions.
India's quick-commerce network is moving beyond metros. A 2026 CLSA analysis reported that quick-commerce services had expanded to 477 cities, as operators targeted smaller and underpenetrated markets.
The opportunity is significant, but Tier 2 markets operate differently from dense metropolitan markets. Population distribution, purchasing behavior, local competition, delivery radii, product preferences, and dark-store economics can vary considerably from city to city.
Quick Commerce Intelligence therefore needs to be localized. A national store count alone cannot tell a brand whether a specific city has sufficient coverage, which neighborhoods remain underserved, or whether competitors are carrying the right products.
This article explains how structured dark-store data can help businesses solve these challenges and build a more reliable view of India's next phase of quick-commerce expansion.
Why are Tier 2 cities becoming important for quick commerce?
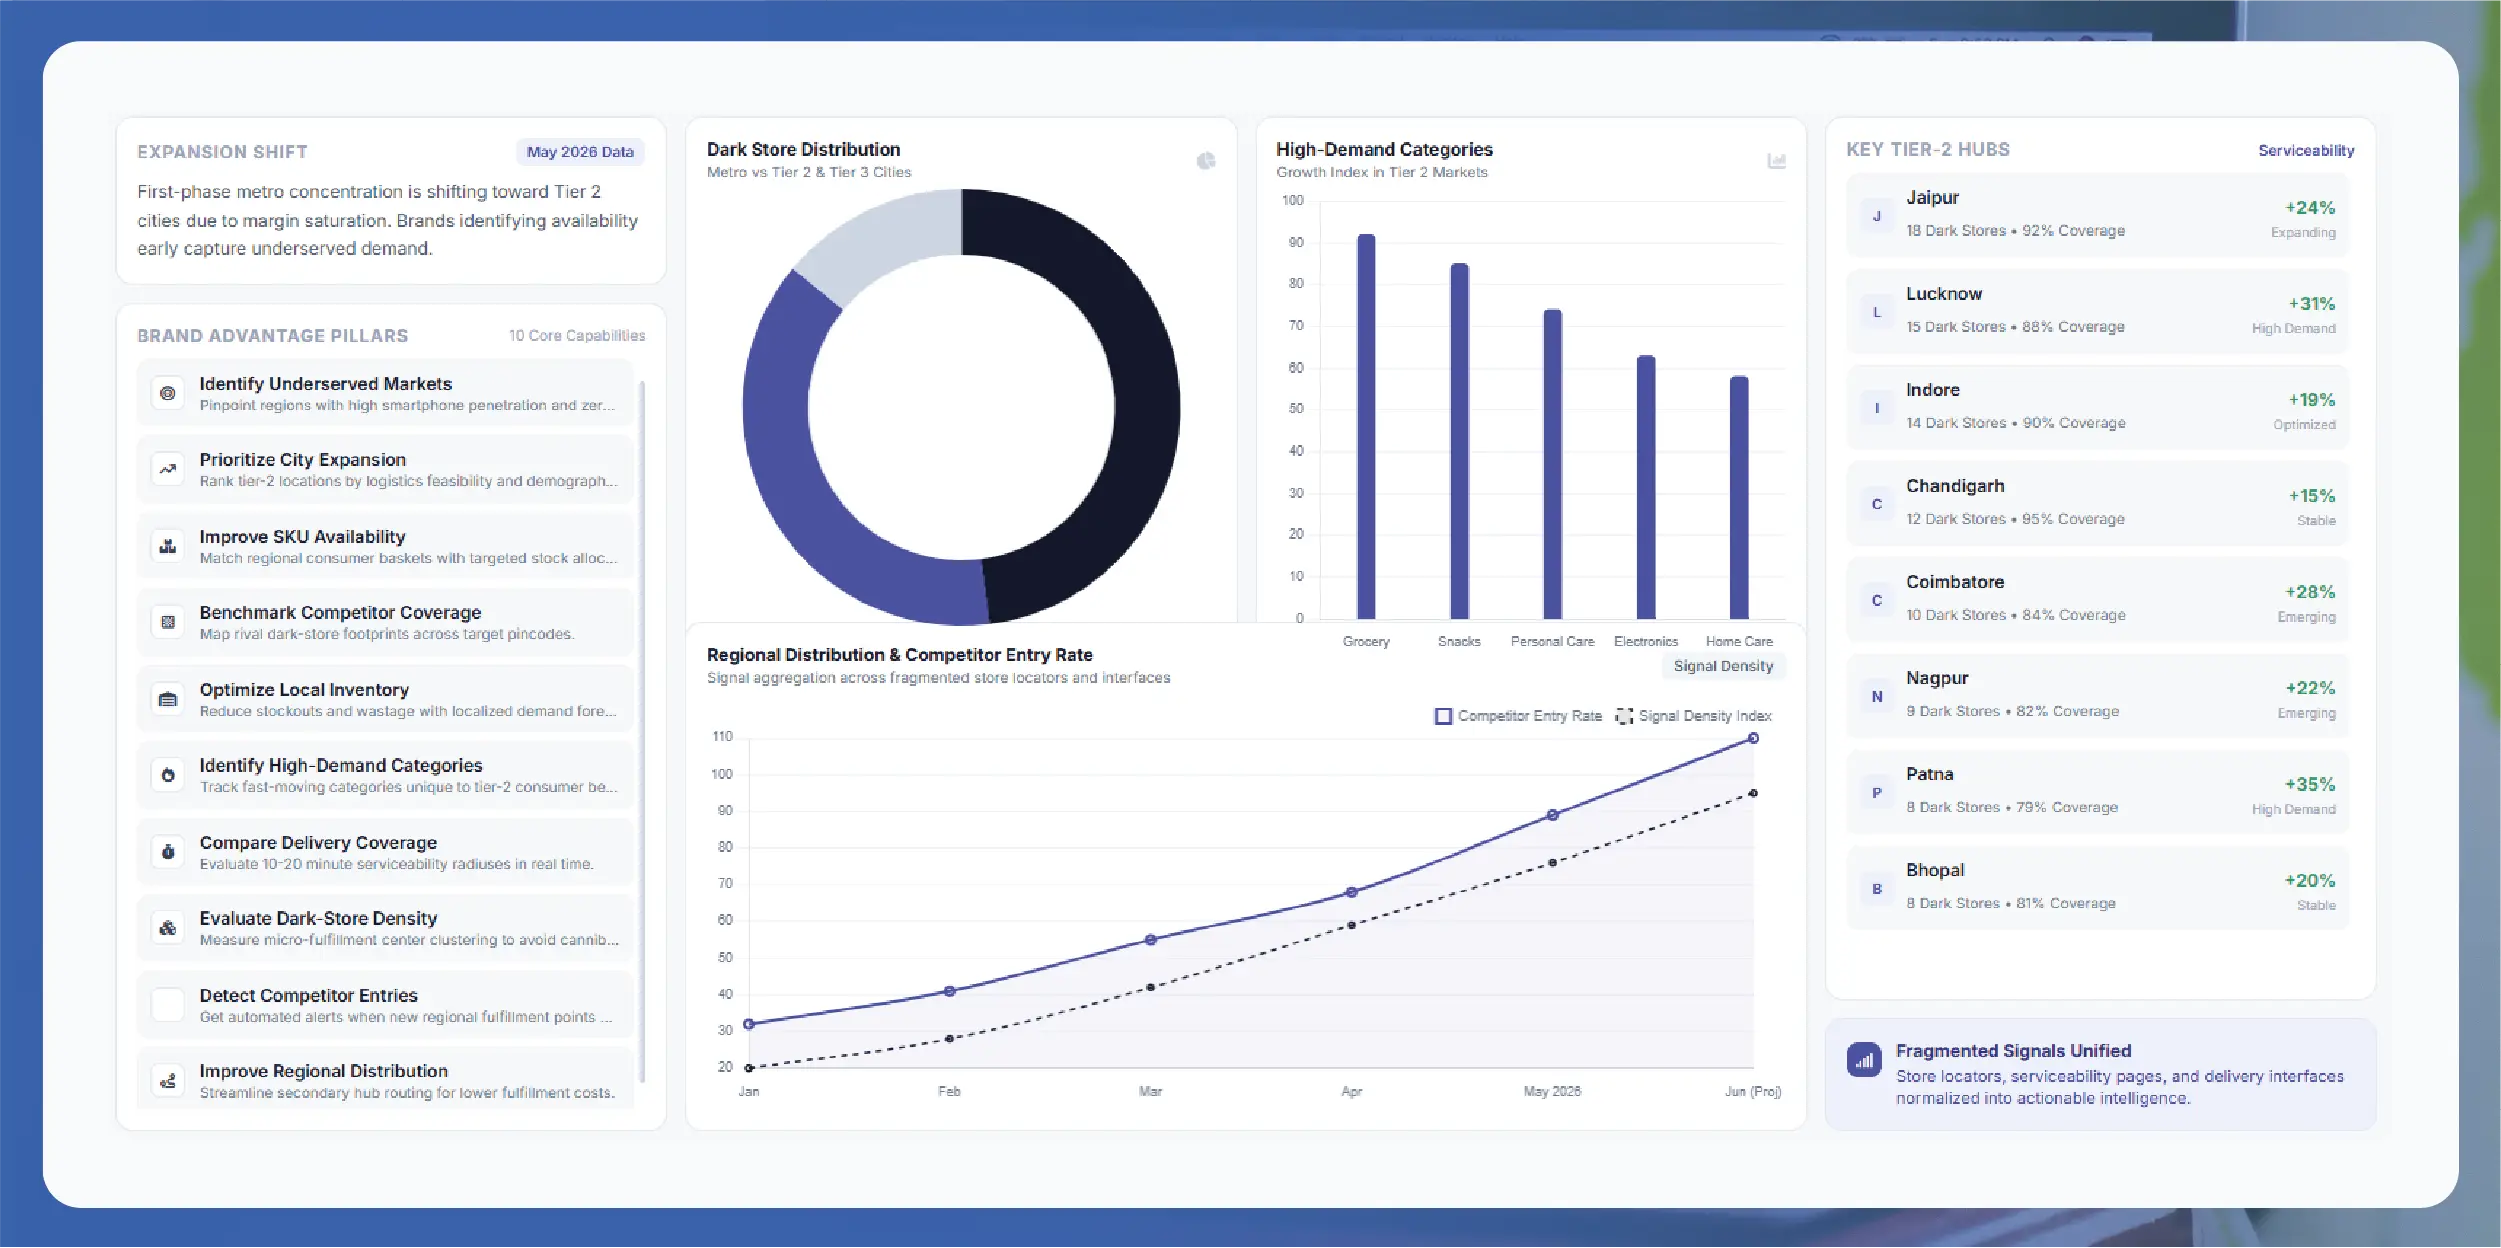
The first phase of Indian quick commerce concentrated heavily on major metropolitan markets where population density, smartphone adoption, disposable income, and established delivery infrastructure supported rapid fulfillment.
That model is now expanding.
Business Standard reported in May 2026 that India's quick-commerce sector had surpassed 6,000 dark stores, while operators were increasingly moving toward smaller cities as metro saturation and profitability pressures increased.
This creates an important opportunity for brands.
A company that understands Tier 2 availability earlier can potentially:
- Identify underserved markets.
- Prioritize city-level expansion.
- Improve SKU availability.
- Benchmark competitor coverage.
- Optimize local inventory.
- Identify high-demand categories.
- Compare delivery coverage.
- Evaluate dark-store density.
- Detect new competitor entries.
- Improve regional distribution planning.
The challenge is that dark stores are not always publicly presented in a standardized format. Store locators, serviceability pages, marketplace applications, and local delivery interfaces can expose different pieces of information.
Data collection brings these fragmented signals together.
How can brands measure dark-store presence across smaller cities?
India Tier 2 City Dark Store Coverage Analysis helps businesses understand where fulfillment infrastructure exists and how deeply each platform penetrates a target market.
A useful coverage dataset should go beyond simply counting stores. It should capture the city, locality, platform, store/service area, available categories, estimated delivery coverage, and observation date.
For example, a city-level dataset can be structured as follows:
| Data Point |
Business Question |
| City |
Where is the platform active? |
| Locality |
Which neighborhoods are covered? |
| Platform |
Who operates in the market? |
| Store count |
How dense is fulfillment coverage? |
| Serviceability |
Which areas can order? |
| Product availability |
What can customers actually buy? |
| Delivery promise |
How competitive is fulfillment speed? |
| Timestamp |
When was the information collected? |
| Category coverage |
Which product groups are prioritized? |
Third-party mapping data published in 2026 provides an indication of how quickly the footprint is spreading. One public dataset mapped 5,625 dark stores across 408 cities and five major platforms in a July 2026 snapshot. It identified substantial Tier 2 footprints in cities such as Nagpur, Vadodara, Surat, Nashik, and Rajkot.
These figures should be treated as publicly observable lower-bound estimates, not a complete official census. The value for businesses is the methodology: repeatedly tracking the same locations can reveal network expansion and contraction over time.
What should businesses measure?
A practical coverage model can assign every city a score based on:
1. Number of active platforms.
2. Number of dark stores.
3. Store density.
4. Geographic coverage.
5. Average delivery promise.
6. SKU breadth.
7. Competitor presence.
8. Category availability.
This creates a city-level benchmark rather than a simple store directory.
How can companies identify commercial opportunities in Tier 2 markets?
Tier 2 City Q-Commerce Market Intelligence India turns store and product observations into commercial insights.
For a consumer brand, the most important question may not be “How many stores exist?”
It may be:
“Are competitors reaching customers in this city better than we are?”
That requires several datasets to be connected.
Suppose a brand identifies that a competitor is available across 12 neighborhoods while its own products are visible in only seven. The gap could indicate a distribution problem, a platform listing issue, insufficient inventory, or differences in local assortment.
A structured intelligence system can compare:
| Intelligence Layer |
Example Metric |
Decision |
| Store coverage |
25 locations |
Expansion planning |
| Brand availability |
82% |
Distribution review |
| Competitor availability |
94% |
Competitive gap |
| Average price |
₹245 |
Pricing benchmark |
| Average discount |
12% |
Promotion monitoring |
| Delivery promise |
18 min |
Service comparison |
| Stockout frequency |
9% |
Replenishment review |
business example; not reported market data.
This approach is especially useful for FMCG and consumer brands because Q-commerce can become an additional digital shelf.
A product that is technically distributed across a city but frequently unavailable is not equivalent to a product that remains consistently visible and orderable.
That distinction matters when measuring digital availability.
What can market intelligence reveal?
Businesses can use recurring data collection to identify:
- Emerging cities.
- New platform entries.
- Dark-store openings.
- Competitor expansion.
- Category expansion.
- Pricing changes.
- Local assortment differences.
- High-stockout products.
- Delivery-service gaps.
- Potential white-space markets.
This allows strategy teams to move from national assumptions toward city-specific decisions.
How can businesses map serviceable areas and store clusters?
India Tier 2 City Q-Commerce Store Mapping analysis enables companies to understand the geographic structure behind fast delivery.
Dark-store mapping is valuable because store count alone can be misleading.
Two cities may each have 20 stores, but one may have stores concentrated in a small central area while the other may distribute them across multiple residential clusters.
The second network could potentially provide broader customer coverage.
A mapping dataset can include:
- Store or fulfillment-node identifier.
- City.
- Neighborhood.
- Postal code.
- Latitude and longitude where publicly available.
- Platform.
- Serviceable area.
- Product categories.
- Delivery estimate.
- Operating status.
- First-observed date.
- Last-observed date.
A 2026 public mapping project found that its 5,625-store dataset covered 2,843 localities across 26 states and union territories, demonstrating why locality-level information can be more useful than national totals.
Example of a city-mapping framework
| City |
Platform Stores |
Service Zones |
Competitive Intensity |
Opportunity |
| City A |
28 |
21 |
High |
Optimize availability |
| City B |
14 |
12 |
Medium |
Expand assortment |
| City C |
7 |
6 |
Low |
Early-entry opportunity |
| City D |
22 |
15 |
High |
Price differentiation |
framework.
For real business use, the dataset can be refreshed at defined intervals.
Monthly mapping can identify structural changes.
Weekly monitoring can identify faster expansion.
More frequent collection can be used when businesses need to monitor dynamic serviceability, inventory, pricing, or delivery changes.
How can brands benchmark competitors at the city level?
India Tier 2 City Q-Commerce Dark store competitor analysis helps businesses compare competing networks using consistent metrics.
Competitive analysis becomes more useful when it answers operational questions instead of simply listing competitors.
For example:
- Which platform entered the city first?
- Which platform has the broadest coverage?
- Which neighborhoods have multiple competing stores?
- Which competitor has the strongest assortment?
- Which products are consistently discounted?
- Which brands have the best availability?
- Where are competitors expanding?
- Which categories receive more shelf visibility?
Public 2026 data shows how different platforms can have very different footprints. One July 2026 dataset mapped 1,955 Blinkit stores, 1,088 Zepto stores, 1,038 Swiggy Instamart stores, 880 Flipkart Minutes stores, and 664 BigBasket stores within its five-platform sample.
The figures are useful as a comparative dataset, but businesses should not interpret them as a definitive national census because methodology and platform coverage can differ.
A practical competitor scorecard
| KPI |
Brand/Platform A |
Brand/Platform B |
Brand/Platform C |
| City coverage |
18 cities |
14 cities |
11 cities |
| Store locations |
65 |
51 |
38 |
| Average delivery promise |
17 min |
21 min |
19 min |
| SKU availability |
91% |
86% |
88% |
| Promotional frequency |
26% |
19% |
31% |
| Category breadth |
High |
Medium |
High |
This scorecard can be produced for individual cities, regions, categories, or brands.
It can also help property, expansion, and supply-chain teams identify locations where competitors are clustering heavily.
How can city-level data improve inventory and assortment decisions?
Q-Commerce Dark Store Data by City India gives supply-chain and category teams a more detailed understanding of localized demand and availability.
Tier 2 cities should not automatically be treated as smaller versions of metro markets.
Consumer preferences can differ based on:
- Local income patterns.
- Climate.
- Food habits.
- Household structure.
- Festival calendars.
- Regional brands.
- Local competitors.
- Urban density.
- Delivery infrastructure.
For example, a grocery operator may discover that one city has strong demand for packaged snacks and beverages while another shows stronger demand for personal care and household products.
Without city-level data, businesses may use the same assortment strategy everywhere.
With city-level monitoring, assortment can become more localized.
Useful city-level fields
| Category |
Example Data |
| Product |
Name, SKU, brand |
| Pricing |
MRP, selling price, discount |
| Availability |
In stock, unavailable |
| Location |
City, locality, PIN code |
| Delivery |
Estimated time |
| Promotion |
Offer type and depth |
| Reviews |
Rating and review count |
| Platform |
Marketplace/app |
| Timestamp |
Collection date and time |
The same dataset can support inventory and commercial teams.
If a product frequently goes out of stock in one city, supply-chain teams can investigate replenishment.
If competitors maintain better availability, commercial teams can investigate distribution.
If a product performs strongly across multiple cities, category managers can consider broader rollout.
How can automated data collection make this monitoring scalable?
Quick Commerce Data Scraping Services, Scrape Tier 2 City Q-Commerce Dark Store Data in India can help businesses automate the collection of high-volume, frequently changing commerce information.
Manual monitoring becomes difficult when businesses need to track:
- Hundreds of cities.
- Thousands of SKUs.
- Multiple platforms.
- Multiple localities.
- Different delivery zones.
- Price changes.
- Inventory changes.
- New store entries.
- Competitor activity.
A scalable architecture can follow this workflow:
Source discovery → Automated extraction → SKU/store matching → Data normalization → Validation → Historical storage → Analytics → Alerts
The extraction layer can collect publicly accessible information from websites and relevant mobile application interfaces, subject to applicable terms, technical restrictions, and legal requirements.
The normalization layer is particularly important.
The same product can appear with:
- Different names.
- Different pack-size formats.
- Different SKU identifiers.
- Different capitalization.
- Different promotional prices.
Matching and normalization allow businesses to compare like-for-like products.
Example output
| City |
Platform |
SKU |
Price |
Stock |
Delivery |
Timestamp |
| City A |
Platform 1 |
SKU-101 |
₹149 |
Yes |
16 min |
10:00 |
| City A |
Platform 2 |
SKU-101 |
₹155 |
Yes |
19 min |
10:00 |
| City B |
Platform 1 |
SKU-101 |
₹149 |
No |
— |
10:00 |
This simple structure can become the foundation for dashboards, alerts, competitor reports, and forecasting models.
How has the market evolved from 2020 to 2026?
India's quick-commerce story between 2020 and 2026 can be understood as a transition from pandemic-driven digital adoption to increasingly sophisticated fulfillment competition. During the early period, online grocery and delivery adoption accelerated as consumers became more comfortable ordering everyday products digitally. As the market matured, operators began investing heavily in dark stores, localized inventory, delivery density, and larger product assortments.
The metro markets became the first major battleground. By the middle of the decade, however, operators faced increasing saturation and rising pressure to make store economics work. This encouraged expansion into Tier 2 cities and other underpenetrated locations. By 2025, industry reporting indicated that around one-third of India's quick-commerce dark stores were already in Tier 2 cities and smaller towns, with the national store base expected to grow substantially toward 2030.
In 2026, the expansion became more measurable. CLSA reporting placed quick-commerce availability at 477 cities, while other public datasets mapped hundreds of cities and thousands of dark stores.
The competitive focus is also changing. Instead of simply asking how many stores can be opened, operators increasingly need to determine where demand supports sustainable fulfillment. This makes store density, local assortment, delivery coverage, inventory availability, and competitor presence increasingly important.
For brands, the 2020–2026 evolution means that Q-commerce should no longer be viewed only as a delivery channel. It is becoming a measurable retail environment where digital shelf visibility, availability, pricing, and geographic reach can be continuously analyzed.
How can Actowiz Solutions help businesses build a scalable data pipeline?
Actowiz Solutions can help brands, retailers, FMCG companies, marketplaces, investors, and Q-commerce operators transform fragmented digital commerce information into structured business intelligence.
A customized Scrape Tier 2 City Q-Commerce Dark Store Data in India solution can be designed around the client's cities, platforms, products, and KPIs.
Data collection capabilities
Dark-store monitoring
Track publicly observable store locations, city presence, locality coverage, and network changes.
Product monitoring
Capture product names, SKUs, categories, brands, pack sizes, and other available attributes.
Price monitoring
Compare MRP, selling prices, discounts, and promotional changes.
Availability monitoring
Identify in-stock and out-of-stock patterns across selected cities and platforms.
Delivery monitoring
Capture available delivery estimates and compare service levels between competitors.
Competitor monitoring
Track competitor network expansion, assortment, pricing, and promotional activity.
Historical datasets
Maintain time-series records to identify expansion, contraction, seasonal patterns, and recurring availability problems.
Web and application collection
Web Scraping can support structured collection from publicly accessible commerce websites, while Mobile App Scraping can be used where relevant information is exposed through mobile applications and the applicable technical and legal conditions permit collection.
The data can then be normalized into consistent fields.
Analytics-ready delivery
The resulting Real-time dataset can be structured according to the client's requirements and used for:
- BI dashboards.
- Pricing analytics.
- Inventory planning.
- Market research.
- Competitor intelligence.
- Geographic expansion.
- Assortment optimization.
- Supply-chain analysis.
- Executive reporting.
The collection frequency can also be tailored to the business problem.
For store expansion research, weekly or monthly snapshots may be sufficient.
For pricing and inventory monitoring, daily or more frequent collection may be appropriate.
For high-priority operational use cases, businesses can establish alert-based workflows around significant changes.
What should businesses monitor before entering a Tier 2 city?
A successful expansion decision should combine market opportunity with operational feasibility.
Before entering a city, businesses should evaluate:
1. Existing platform coverage
Determine which Q-commerce operators already serve the city.
2. Dark-store density
Measure whether competitors have built dense networks or only limited coverage.
3. Product availability
Check whether important categories are consistently available.
4. Price competitiveness
Compare local pricing and promotional intensity.
5. Delivery performance
Assess available delivery promises by locality.
6. Customer signals
Monitor ratings, reviews, and product engagement where available.
7. Assortment gaps
Identify products and categories that are underrepresented.
8. Expansion signals
Track newly appearing stores and serviceable locations.
A city with low store density is not automatically a good opportunity. Low density can indicate either an underserved market or weak economics.
That is why multiple signals need to be evaluated together.
Conclusion
Tier 2 cities are becoming an increasingly important frontier for India's quick-commerce ecosystem. As operators move beyond saturated metropolitan markets, businesses need granular intelligence to understand where dark stores are located, how competitors are expanding, what products are available, and where inventory and delivery gaps remain.
Scrape Tier 2 City Q-Commerce Dark Store Data in India can help businesses transform these fragmented observations into structured, historical, and actionable intelligence.
The most effective approach combines city-level store mapping, product availability, pricing, delivery information, competitor benchmarking, and recurring monitoring. This gives brands a clearer view of local market conditions and helps them make better decisions about inventory, assortment, distribution, and expansion.
For Actowiz Solutions, the objective is not simply to collect more data. It is to build a reliable data pipeline around the client's specific business questions and deliver information that commercial, supply-chain, strategy, and analytics teams can use.
Ready to identify Tier 2 Q-commerce opportunities and improve inventory and delivery decisions? Contact Actowiz Solutions for customized data collection, dark-store intelligence, and competitive monitoring solutions.
You can also reach us for all your mobile app scraping, data collection, web scraping , and instant data scraper service requirements!

 Pricing & Promotions
MAP Violations Brand Protection Counterfeit Detection Price Intelligence AI HOT Data Intelligence
Pricing & Promotions
MAP Violations Brand Protection Counterfeit Detection Price Intelligence AI HOT Data Intelligence Brand & Intelligence
Share of Search Content Audit & PDP Reviews & Ratings Retail Media Buy Box Monitoring Social Commerce HOT Live Commerce NEW Agentic Commerce NEW
Brand & Intelligence
Share of Search Content Audit & PDP Reviews & Ratings Retail Media Buy Box Monitoring Social Commerce HOT Live Commerce NEW Agentic Commerce NEW Digital Shelf & Search
Assortment Planning Competitive Benchmarking Product Availability Q-Commerce NEW
Digital Shelf & Search
Assortment Planning Competitive Benchmarking Product Availability Q-Commerce NEW AssortmentE-commerce Intelligence Hyperlocal Insights POI & Store Locator DTC Brand Analytics NEW
 For Retailers
 E-Commerce Dashboard
 Flipkart Insights (Live) #1
 Grocery Intelligence
.svg) Grocery Price (U.S.)
Grocery Price (U.S.)
.svg) Quick Commerce (India) HOT
Quick Commerce (India) HOT
 Food & Restaurant
 Fashion Intelligence
 Automotive
 Travel & Hospitality
 Real Estate
 Food Delivery Intelligence NEW
 OTT & Streaming NEW
 By Use Case
 Pricing Intelligence
 Digital Shelf Analytics
 MAP Monitoring HOT
 Cross-Border Price Parity NEW
 Share of Search
 Review Sentiment
 Kitchen Market Gaps NEW
 Dynamic Pricing / AI Repricing NEW
 Promotions & Deals Alerts NEW
 B2B / POI & Lead Data NEW
 By Region🇮🇳 India 🇺🇸 USA 🇦🇪 Middle East 🇬🇧 UK 🇦🇺 Australia 🌏 SE Asia 🇪🇺 Europe 🌎 LATAMIndia
 Flipkart Real-Time Insights
 Quick Commerce — Zepto · Blinkit
 Pincode Price Tracker
Middle East
Pincode Price Tracker
Middle East GCC Q-Commerce — Talabat · Noon NEW
UK & Australia
GCC Q-Commerce — Talabat · Noon NEW
UK & Australia UK Grocery — Tesco, Sainsbury's, Asda
 AU Grocery — Coles & Woolworths NEW
 Marketplace Scrapers
Amazon API TikTok Shop API HOT Uber Eats API Airbnb API Zepto / Blinkit API Instacart API NEW Talabat API NEW
Marketplace Scrapers
Amazon API TikTok Shop API HOT Uber Eats API Airbnb API Zepto / Blinkit API Instacart API NEW Talabat API NEW Developer APIsWeb Extract API Reviews API SERP API Pricing Webhook NEW
 Universal APIsStreaming Crawl API Scheduler Realtime Alerts Webhook Delivery 🐍 Python SDK 💚 Node.js SDK
 Delivery & SDKs
 Knowledge Center
Digital Shelf Playbook MAP Compliance Guide Pricing Intel Guide Scraping Compliance TikTok Shop Guide NEW Cross-Border Guide NEW
Knowledge Center
Digital Shelf Playbook MAP Compliance Guide Pricing Intel Guide Scraping Compliance TikTok Shop Guide NEW Cross-Border Guide NEW Guides & Playbooks
🎉 Seasonal & event tracking NEWBlack Friday pricing report Festive season, India Ramadan, GCC grocery All seasonal reportsSample Datasets HOT ROI Calculator NEW API Postman Collection Demo Dashboards Free API Playground NEW Press Kit
Guides & Playbooks
🎉 Seasonal & event tracking NEWBlack Friday pricing report Festive season, India Ramadan, GCC grocery All seasonal reportsSample Datasets HOT ROI Calculator NEW API Postman Collection Demo Dashboards Free API Playground NEW Press Kit Downloads & Tools
Trust Center About Us FAQs Careers
Downloads & Tools
Trust Center About Us FAQs Careers Trust & CompanyRetail shelf research NEWRetail shelf research






































 4.8/5 Average Rating
 50+ Video Testimonials
 92% Client Retention
 50+ Countries Served