Core services
Enterprise Data Extraction

Scalable web, app and AI-powered collection across 40+ countries.

All 58 services →
New 2026
AI Training Data

Corpus building with provenance and opt-out compliance.

Learn more →
Free pilot
24-hour sample

We run collection on your own sources before you commit.

Get a sample →
58Services
40+Countries
DEVELOPER

Ready-Made Scrapers

Pre-built for top platforms. Self-serve, no setup.

View All →
TRY FREE

API Playground

Test endpoints instantly. No credit card.

Start Free →
28Tools
2SDKs
icons Delivery & SDKs
Streaming Crawl API Scheduler Realtime Alerts Webhook Delivery 🐍 Python SDK 💚 Node.js SDK

Need it managed instead?

Fixed monthly retainer, named engineer, no per-request metering.

Managed Data API →
HOT

Case Studies

How brands use Actowiz, with named outcomes.

Read →
FREE

Sample Datasets

Real output, no signup.

Download →
NEW

ROI Calculator

Model the return on a data engagement.

Calculate →
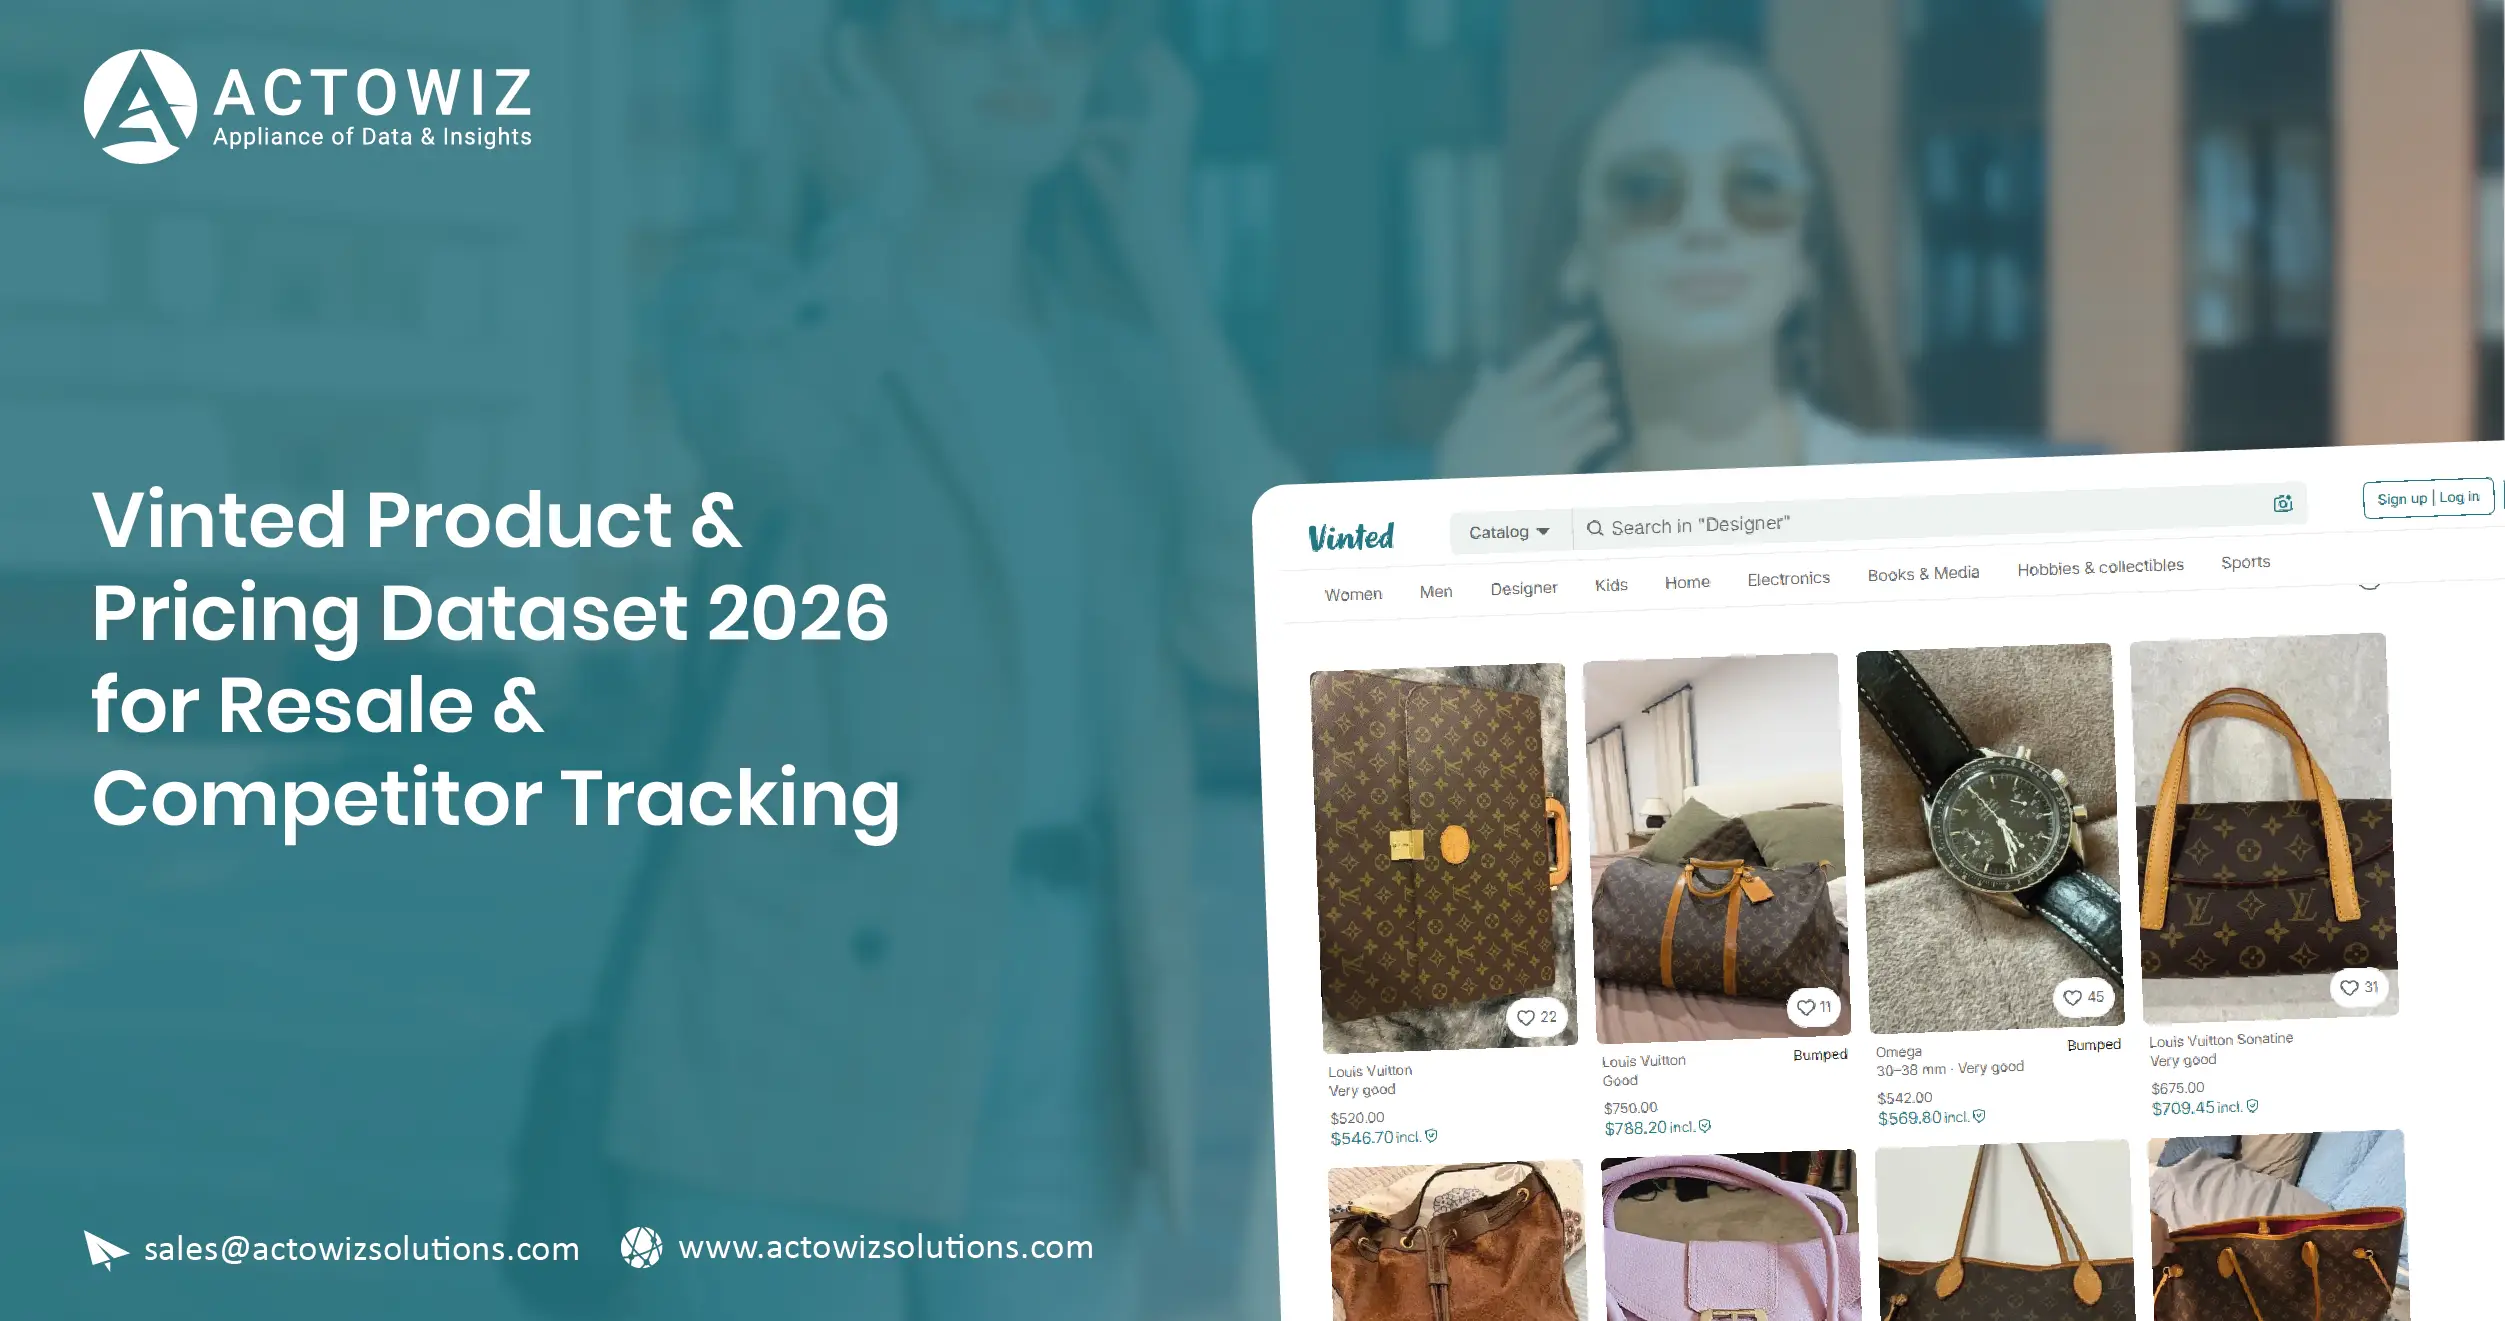
Vinted Product and Pricing Dataset 2026

Introduction

Businesses tracking the resale market need more than isolated listing prices. They need structured information covering products, SKUs, brands, conditions, discounts, reviews, ratings, seller activity, and price movements. The Vinted Product and Pricing Dataset 2026 helps retailers, resale businesses, market researchers, fashion brands, and pricing teams transform marketplace listings into comparable intelligence for competitive analysis and pricing decisions.

Vinted has become a major second-hand marketplace, with its 2025 marketplace GMV reaching €10.8 billion, up 47% from €7.3 billion in 2024. Vinted also reported €1.1 billion in 2025 revenue and operations across 26 markets.

For businesses, this growth creates a larger and more dynamic dataset to analyze. A structured dataset can help answer practical questions: Which brands have the highest resale prices? Which products are discounted most frequently? How do comparable listings differ by condition? Which categories show growing demand? How quickly do prices change?

The goal is not simply to collect listings. The goal is to convert continuously changing marketplace information into an analytical layer that supports pricing, assortment, competitor monitoring, and resale-market research.

What Can Businesses Learn From a Structured Marketplace Dataset?

A useful E-commerce Dashboard can combine product, price, seller, review, availability, and historical information into a single analytical environment. Instead of manually opening hundreds of listings, teams can monitor KPIs such as median price, average discount, listing volume, brand share, price ranges, review counts, and product availability.

A dashboard can also segment data by:

Availability status

Vinted's 2025 results demonstrate why this type of intelligence matters. The company said its marketplace expanded beyond core fashion into categories including sports and collectibles, while women's and children's clothing continued to perform strongly.

Example Dashboard KPIs

KPIWhat It MeasuresBusiness Use
Average Listed PriceMean asking pricePricing comparison
Median PriceTypical marketplace priceReduces distortion from extreme listings
Discount RatePrice reduction against reference pricePromotion monitoring
Listing VolumeNumber of tracked listingsCategory and supply analysis
Brand ShareBrand presence within a categoryCompetitive positioning
Availability RateActive vs unavailable productsSupply monitoring
Review CountCustomer feedback volumeProduct popularity
Price MovementChange over timeDynamic pricing analysis

The dashboard becomes more valuable when data is collected repeatedly rather than only once. Historical snapshots allow businesses to compare today's market with previous weeks, months, or seasons.

How Can Businesses Compare Product Prices More Efficiently?

Vinted Products Price Data Scraping enables businesses to collect structured listing information such as product name, brand, category, price, condition, size, seller details, availability, URL, and other accessible attributes.

For fashion and resale businesses, the main challenge is product comparability. Two listings may represent the same brand and model but have different conditions, sizes, colors, seller profiles, and asking prices. A raw listing feed therefore needs normalization before it can support reliable analysis.

This is where Pricing & Product Data Scraping becomes useful. Businesses can establish common fields and standardize marketplace records before loading them into databases, dashboards, or analytics platforms.

Typical Data Fields

Data AttributeExample Use
Product NameProduct identification
BrandBrand-level benchmarking
CategoryCategory analysis
PricePricing comparison
CurrencyRegional normalization
ConditionLike-new vs used comparison
SizeFashion demand analysis
Seller IDSeller-level tracking
Listing URLSource reference
AvailabilitySupply monitoring
TimestampHistorical price tracking
Image URLVisual catalog analysis

The distinction between asking price and buyer-facing cost can also matter. Independent Vinted data-access services currently expose fields such as seller price, service fee, and total price, illustrating why a pricing dataset should preserve multiple price fields rather than treating one number as the complete transaction cost.

For example, a pricing team could calculate:

Price Gap % = ((Competitor Price − Reference Price) / Reference Price) × 100

This makes it possible to identify products priced substantially above or below a selected benchmark.

How Can SKU-Level Data Make Product Monitoring More Precise?

A SKU-oriented dataset helps businesses distinguish between products that may look similar but represent different models, variants, sizes, colors, or editions. Vinted Products SKU ID Dataset can organize marketplace records around product identifiers and related attributes where identifiable.

The phrase Vinted Product and Pricing Dataset 2026 represents a broader dataset strategy in which SKU-level information is combined with pricing, product, seller, and market attributes.

SKU-level monitoring can help businesses:

Detect duplicate or closely related listings.

Compare prices for the same product across sellers.

Track price changes over time.

Identify popular product variants.

Analyze availability by size or condition.

Build historical product records.

Connect product data with internal catalogs.

Create category-level pricing benchmarks.

Example SKU Monitoring Structure

FieldPurpose
Product IDUnique marketplace reference
SKU/Model IDProduct-level grouping
BrandBrand classification
Product NameCatalog matching
VariantColor/model/version
SizeVariant analysis
ConditionQuality comparison
SellerSeller monitoring
Current PriceCurrent benchmark
Previous PriceHistorical comparison
Price Change %Movement detection
First SeenListing lifecycle
Last SeenLatest observation

SKU-level tracking becomes particularly useful when the same product appears through multiple sellers. Rather than treating every listing as a completely different product, businesses can group related records and analyze the underlying pricing pattern.

A resale business could use this information to determine whether a particular product consistently sells around a specific price range. A fashion brand could compare the resale value of selected products against their original retail positioning. A marketplace analytics company could use SKU groups to study demand and price dispersion.

How Can Discount and Price-Movement Data Reveal Market Opportunities?

Vinted Deals & Discount Data Collection helps businesses identify price reductions, promotional behavior, discounted listings, and changes in seller asking prices.

For resale businesses, discounts can indicate several different market signals. A price reduction may suggest increased competition, a seller attempting to accelerate inventory turnover, seasonal demand changes, or a product that initially entered the marketplace above the prevailing market level.

Combining discount information with Real-Time Price Monitoring provides a more useful view than a one-time price snapshot.

Example Price-Monitoring Metrics

MetricFormula / MeasurementBusiness Question
Discount %Price reduction ÷ previous priceHow aggressively are prices changing?
Median PriceMiddle observed priceWhat is the typical market level?
Price RangeMaximum − minimumHow fragmented is the market?
Price VolatilityChange across snapshotsHow quickly does pricing move?
Listing TurnoverNew/removed listingsHow active is supply?
Seller Discount FrequencyDiscount events per sellerWhich sellers frequently adjust prices?

Vinted reported that the average price of fashion items on its marketplace was 72% below original retail prices for new items in 2025. The company also estimated that members saved €21.6 billion compared with original retail prices for adult fashion.

These figures are company-reported and describe Vinted's own analysis; they should not be interpreted as a universal resale-market benchmark.

For businesses, the practical opportunity is to build category-specific benchmarks. For example, a team could compare the median resale price of a particular brand against original retail pricing, then segment the results by condition, product age, and size.

How Can Reviews and Ratings Add Context to Pricing Data?

Price alone does not explain why one listing attracts more attention than another. Extract Product Revie & Rating Data can add customer and seller feedback signals to product and pricing analysis.

The requested keyword contains “Revie,” but the underlying business requirement is broader: collecting available review and rating information and connecting it with product-level records.

When combined with Vinted Product and Pricing Dataset 2026, review and rating information can help businesses investigate relationships between product quality signals and marketplace positioning.

Review Intelligence Framework

Data PointAnalytical Value
RatingReputation measurement
Review CountFeedback volume
Review TextSentiment and issue analysis
Seller FeedbackSeller-quality comparison
Product ConditionQuality segmentation
PricePrice-to-feedback comparison
Listing AgeLifecycle analysis
Seller ActivityMarketplace participation

Businesses can use review data to classify recurring themes such as:

Buyer satisfaction

For example, a product with a high asking price and strong seller feedback may represent a different market proposition from a similarly priced listing with limited feedback.

A review dataset should therefore be analyzed alongside price, condition, category, and seller attributes rather than treated as an isolated metric.

How Can Dynamic Price Intelligence Identify Changing Resale Trends?

Scrape Vinted Dynamic Pricing Data Intelligence focuses on turning repeated marketplace observations into trend signals.

Unlike static research, dynamic analysis captures how listings evolve. A product can appear at €80 today, fall to €70 later, and disappear from the active marketplace after another adjustment. Without historical snapshots, the business sees only the current state.

Dynamic analysis can track:

Illustrative Dynamic Pricing Dataset

Product GroupInitial PriceCurrent PriceChangeObservation
Fashion A€90€78-13.3%Price reduced
Fashion B€65€650%Stable
Fashion C€120€99-17.5%Larger reduction
Fashion D€45€52+15.6%Higher current listing
Fashion E€150€135-10.0%Moderate reduction

Illustrative example for methodology demonstration; not a live Vinted market sample.

A more advanced model can calculate price volatility by category, brand, product condition, or seller. This can help businesses separate normal price variation from meaningful market changes.

For instance, if premium fashion products consistently experience smaller price reductions than lower-priced categories, businesses may investigate differences in demand, brand equity, supply, or seller behavior.

Dynamic monitoring can also support alerts:

Alert Rule Example: Trigger an alert when the median price for a tracked product group falls by more than 10% across two consecutive observations.

This converts raw marketplace data into an operational workflow.

How Can API-Based Data Delivery Support Large-Scale Market Research?

Vinted Fashion & Retail Market Data API can provide a structured delivery layer for businesses that need marketplace information inside their existing analytics infrastructure.

An API-oriented workflow can feed normalized data into:

Machine-learning pipelines

Current third-party Vinted data services demonstrate that structured marketplace endpoints can expose listing fields such as price, brand, size, seller information, URLs, engagement indicators, and pagination. These are third-party services rather than official Vinted APIs, so businesses should verify access terms, source coverage, and field availability before implementation.

API Delivery Model

LayerFunction
Source CollectionCapture marketplace records
Data ProcessingClean and normalize fields
Entity MatchingGroup products and variants
ValidationDetect missing or inconsistent data
StorageMaintain historical snapshots
API LayerDeliver structured records
DashboardVisualize market intelligence
AlertsTrigger important changes

For a large analytics project, API delivery is useful because it separates data collection from business applications. A pricing team does not need to manually collect marketplace records every morning. Instead, a structured data pipeline can deliver refreshed records to its analytics environment.

What Changed From 2020 to 2026?

From 2020 to 2026, second-hand commerce moved from a niche resale activity toward a broader digital marketplace ecosystem. During the early part of the period, marketplace analytics primarily focused on listing volume, prices, brands, and product availability. As resale platforms matured, businesses increasingly needed historical price intelligence, seller analysis, product matching, review signals, and category-level benchmarks. Vinted reported 61% revenue growth in 2023, reaching €596.3 million, compared with €370.2 million in 2022. In 2024, revenue increased another 36% to €813.4 million, while net profit reached €76.7 million. In 2025, marketplace GMV reached €10.8 billion, up 47% year over year, while revenue reached €1.1 billion. By 2026, Vinted had expanded its geographic footprint further, including launches in Australia and New York, while continuing to expand categories and its shipping and payment ecosystem. This progression changes the requirements for data buyers. A single product-price snapshot is increasingly insufficient for serious market research. Businesses need repeatable collection, historical storage, product normalization, price-change detection, and analytical delivery. The most useful datasets therefore connect product identity with price, condition, availability, seller, review, and time-series information. This enables businesses to understand not only what products are listed, but also how marketplace conditions change over time.

How Can Actowiz Solutions Help?

Actowiz Solutions can help businesses build structured marketplace datasets designed around specific research and analytics requirements. Instead of delivering generic listing information, the collection framework can be configured around fields, categories, brands, products, regions, pricing attributes, and refresh frequencies relevant to the project.

Vinted Product, Pricing & Review Datasets can support use cases such as:

Category-level market intelligence

The data workflow can include collection, extraction, normalization, validation, deduplication, historical storage, and structured delivery.

For example, a fashion analytics company may require daily product prices and seller information, while a market research organization may need weekly snapshots with additional review and category attributes. The dataset structure can be designed around those requirements.


The Vinted Product and Pricing Dataset 2026 can therefore serve as a foundation for dashboards and analytical models rather than functioning as a simple spreadsheet of marketplace listings.

Data Quality Workflow

StageKey Activity
Requirement MappingDefine categories and fields
Data CollectionGather relevant marketplace records
NormalizationStandardize names, prices, categories
ValidationCheck completeness and consistency
DeduplicationRemove repeated records
Historical StoragePreserve dated snapshots
EnrichmentAdd calculated metrics
DeliveryCSV, JSON, database, API, or custom format

This approach is particularly useful for teams that need repeatable data instead of one-off manual research.

Why Is Historical Data Important for Resale Pricing Decisions?

A current listing tells a business what is happening now. A historical dataset explains what changed.

Suppose a category has a median price of €100 today. Without previous observations, the business cannot determine whether €100 represents a normal market level, a recent price increase, or a temporary discount.

Historical data enables:

Category growth analysis

This is especially important for fashion, where demand can vary by season, collection, brand, product type, and consumer preference.

A historical dataset can also support predictive modeling, although predictions should be validated against sufficient historical observations and should not be treated as guaranteed outcomes.

What Should Businesses Include in a Resale-Market Dataset?

A practical dataset should be designed around the decisions it needs to support.

Subcategory

SKU/model identifier where available

Sentiment classification

The precise fields depend on source availability, access method, region, and the project's requirements.

What Business Problems Can This Data Solve?

For pricing teams, the primary value is benchmark creation. They can compare prices by brand, product, category, condition, and seller.

For fashion brands, resale information can provide an additional market signal around product demand and second-hand value.

For resale businesses, the data can support product discovery, pricing research, competitive monitoring, and category selection.

For market researchers, historical marketplace records can provide a structured foundation for studying consumer behavior and price movements.

For e-commerce analysts, the data can be connected to internal product catalogs and business intelligence systems.

Buyer Persona and Use-Case Map

BuyerPrimary Pain PointUseful Data
Fashion BrandLimited resale visibilityBrand, product, price
Resale BusinessDifficult price benchmarkingPrice, condition, seller
Market Research FirmManual marketplace researchHistorical listings
Pricing TeamRapid price changesTime-series prices
E-commerce AnalystFragmented marketplace dataProduct + pricing dataset
Data Science TeamUnstructured source dataNormalized historical records

Conclusion

The resale market is increasingly data-driven. Businesses that want to understand competitive prices, product availability, seller behavior, discounts, and category trends need structured marketplace information rather than isolated manual observations.

The Vinted Product and Pricing Dataset 2026 can support this requirement by combining product, pricing, seller, review, availability, and historical attributes into an analytics-ready data foundation.

When collected consistently, marketplace data can help businesses build pricing benchmarks, monitor competitor listings, identify changing market conditions, and feed e-commerce dashboards or internal analytics systems.

Actowiz Solutions can design customized data collection workflows around the fields, categories, frequency, and delivery format required by each business.

Web Scraping, Mobile App Scraping, and Real-time dataset solutions can help organizations turn changing marketplace information into structured business intelligence.

You can also reach us for all your mobile app scraping, data collection, web scraping, and instant data scraper service requirements!

You can also reach us for all your mobile app scraping, data collection, web scraping , and instant data scraper service requirements!

Social Proof That Converts

Trusted by Global Leaders Across Q-Commerce, Travel, Retail, and FoodTech

Our web scraping expertise is relied on by 4,000+ global enterprises including Zomato, Tata Consumer, Subway, and Expedia — helping them turn web data into growth.

4,000+ Enterprises Worldwide
50+ Countries Served
20+ Industries
Join 4,000+ companies growing with Actowiz →
Real Results from Real Clients

Hear It Directly from Our Clients

Watch how businesses like yours are using Actowiz data to drive growth.

▶
1 min
★★★★★
"Actowiz Solutions offered exceptional support with transparency and guidance throughout. Anna and Saga made the process easy for a non-technical user like me. Great service, fair pricing!"
TG
Thomas Galido
Co-Founder / Head of Product at Upright Data Inc.
▶
2 min
★★★★★
"Actowiz delivered impeccable results for our company. Their team ensured data accuracy and on-time delivery. The competitive intelligence completely transformed our pricing strategy."
II
Iulen Ibanez
CEO / Datacy.es
▶
1:30
★★★★★
"What impressed me most was the speed — we went from requirement to production data in under 48 hours. The API integration was seamless and the support team is always responsive."
FC
Febbin Chacko
-Fin, Small Business Owner
icons 4.8/5 Average Rating
icons 50+ Video Testimonials
icons 92% Client Retention
icons 50+ Countries Served

Join 4,000+ Companies Growing with Actowiz

From Zomato to Expedia — see why global leaders trust us with their data.

Why Global Leaders Trust Actowiz

Backed by automation, data volume, and enterprise-grade scale — we help businesses from startups to Fortune 500s extract competitive insights across the USA, UK, UAE, and beyond.

icons
7+
Years of Experience
Proven track record delivering enterprise-grade web scraping and data intelligence solutions.
icons
4,000+
Projects Delivered
Serving startups to Fortune 500 companies across 50+ countries worldwide.
icons
200+
In-House Experts
Dedicated engineers across scrapers, AI/ML models, APIs, and data quality assurance.
icons
9.2M
Automated Workflows
Running weekly across eCommerce, Quick Commerce, Travel, Real Estate, and Food industries.
icons
270+ TB
Data Transferred
Real-time and batch data scraping at massive scale, across industries globally.
icons
380M+
Pages Crawled Weekly
Scaled infrastructure for comprehensive global data coverage with 99% accuracy.

AI Solutions Engineered
for Your Needs

→
LLM-Powered Attribute Extraction: High-precision product matching using large language models for accurate data classification.
→
Advanced Computer Vision: Fine-grained object detection for precise product classification using text and image embeddings.
→
GPT-Based Analytics Layer: Natural language query-based reporting and visualization for business intelligence.
→
Human-in-the-Loop AI: Continuous feedback loop to improve AI model accuracy over time.
icons Product Matching icons Attribute Tagging icons Content Optimization icons Sentiment Analysis icons Prompt-Based Reporting

Connect the Dots Across
Your Retail Ecosystem

We partner with agencies, system integrators, and technology platforms to deliver end-to-end solutions across the retail and digital shelf ecosystem.

icons
Analytics Services
icons
Ad Tech
icons
Price Optimization
icons
Business Consulting
icons
System Integration
icons
Market Research
Become a Partner →

Popular Datasets — Ready to Download

Browse All Datasets →
icons
Amazon
eCommerce
Free 100 rows
icons
Zillow
Real Estate
Free 100 rows
icons
DoorDash
Food Delivery
Free 100 rows
icons
Walmart
Retail
Free 100 rows
icons
Booking.com
Travel
Free 100 rows
icons
Indeed
Jobs
Free 100 rows

Latest Insights & Resources

View All Resources →
thumb
Blog

Retail Data Intelligence for UAE Retail Groups: The Complete Guide (2026)

UAE retail data intelligence for retail groups: prices, assortment, stock, reviews and share of search across Noon, Amazon.ae and more. 

thumb
Case Study

How Sensitive Skin Skincare Product Data API Helps Brands Track Cleansers, Serums, Moisturizers, and Sunscreens

Sensitive Skin Skincare Product Data API helps brands track cleansers, serums, moisturizers, and sunscreens with structured product data.

thumb
Report

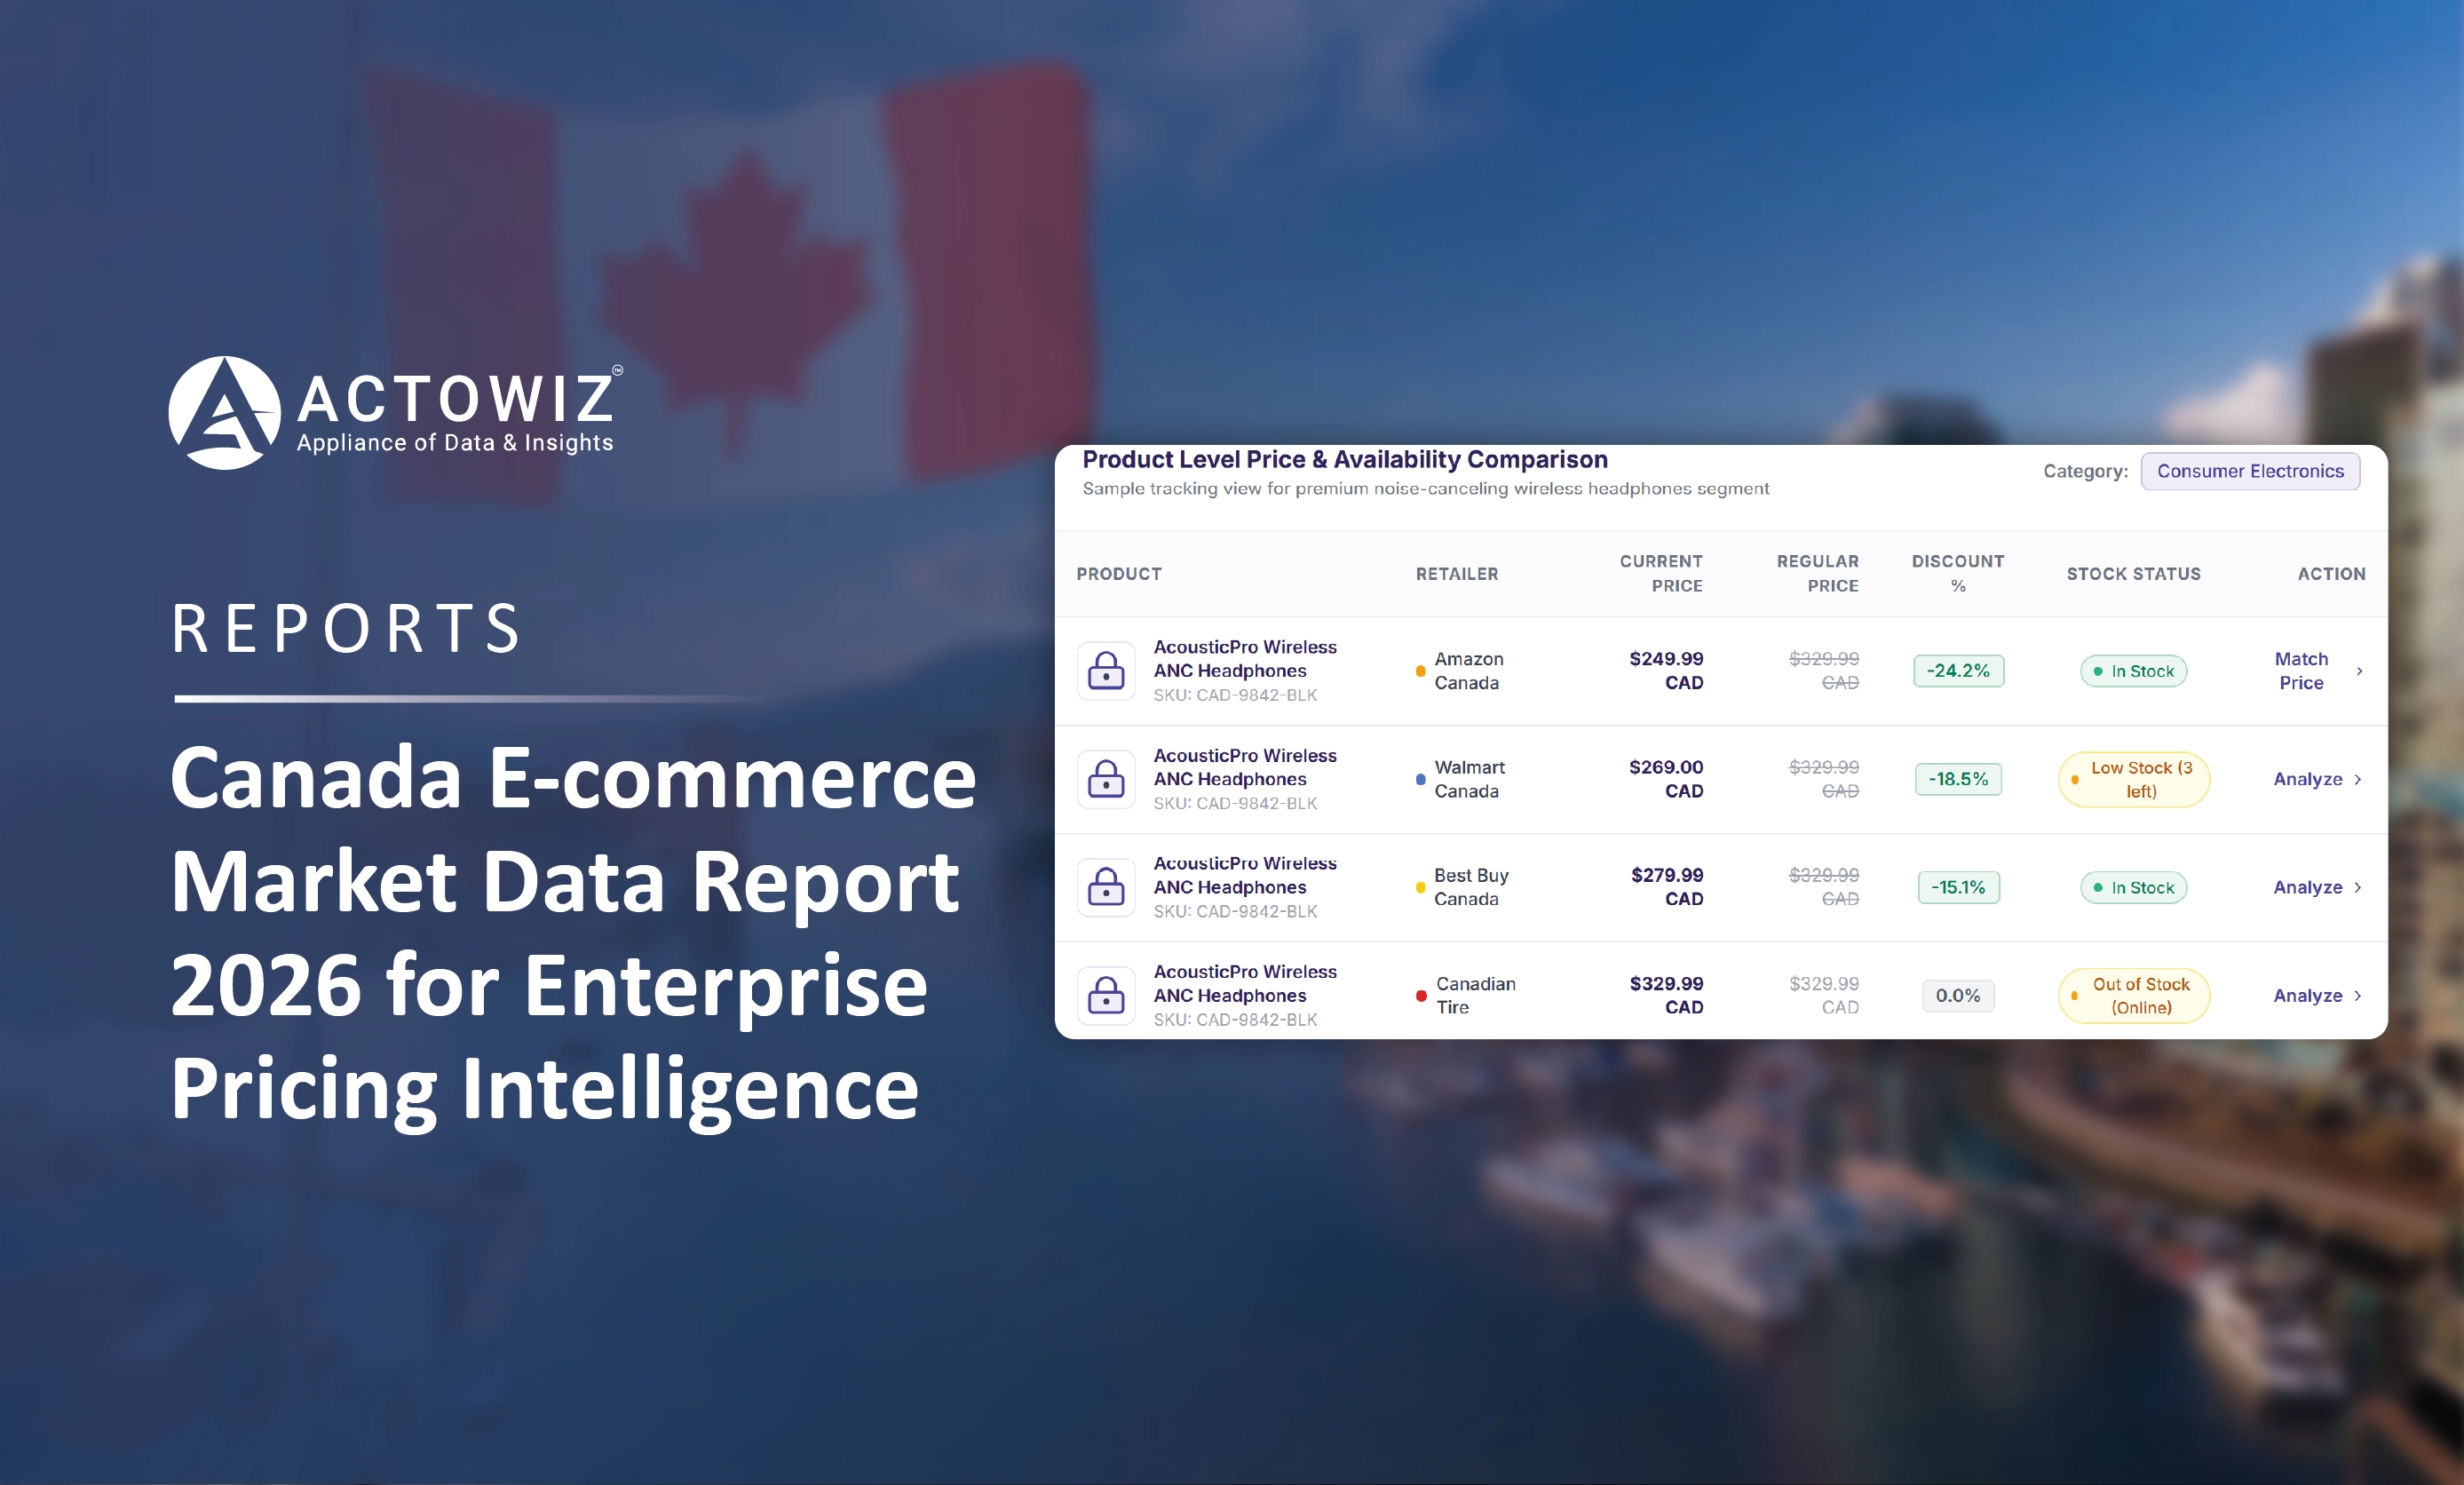
Canada E-commerce Market Data Report 2026 for Enterprise Pricing Intelligence

Canada ecommerce market data for 2026: StatCan online sales, key retailers, tax, French-language and pricing rules.

Start Where It Makes Sense for You

Whether you're a startup or a Fortune 500 — we have the right plan for your data needs.

icons
Enterprise
Book a Strategy Call
Custom solutions, dedicated support, volume pricing for large-scale needs.
icons
Growing Brand
Get Free Sample Data
Try before you buy — 500 rows of real data, delivered in 2 hours. No strings.
icons
Just Exploring
View Plans & Pricing
Transparent plans from $500/mo. Find the right fit for your budget and scale.
Get in Touch
Let's Talk About
Your Data Needs
Tell us what data you need — we'll scope it for free and share a sample within hours.
  • icons
    Free Sample in 2 HoursShare your requirement, get 500 rows of real data — no commitment.
  • icons
    Plans from $500/monthFlexible pricing for startups, growing brands, and enterprises.
  • icons
    US-Based SupportOffices in New York & California. Aligned with your timezone.
  • icons
    ISO 9001 & 27001 CertifiedEnterprise-grade security and quality standards.
Request Free Sample Data
Fill the form below — our team will reach out within 2 hours.
+1 ▼
✓ Free 500-row sample · No credit card · Response within 2 hours

Request Free Sample Data

Our team will reach out within 2 hours with 500 rows of real data — no credit card required.

+1 ▼
✓ Free 500-row sample · No credit card · Response within 2 hours