Introduction
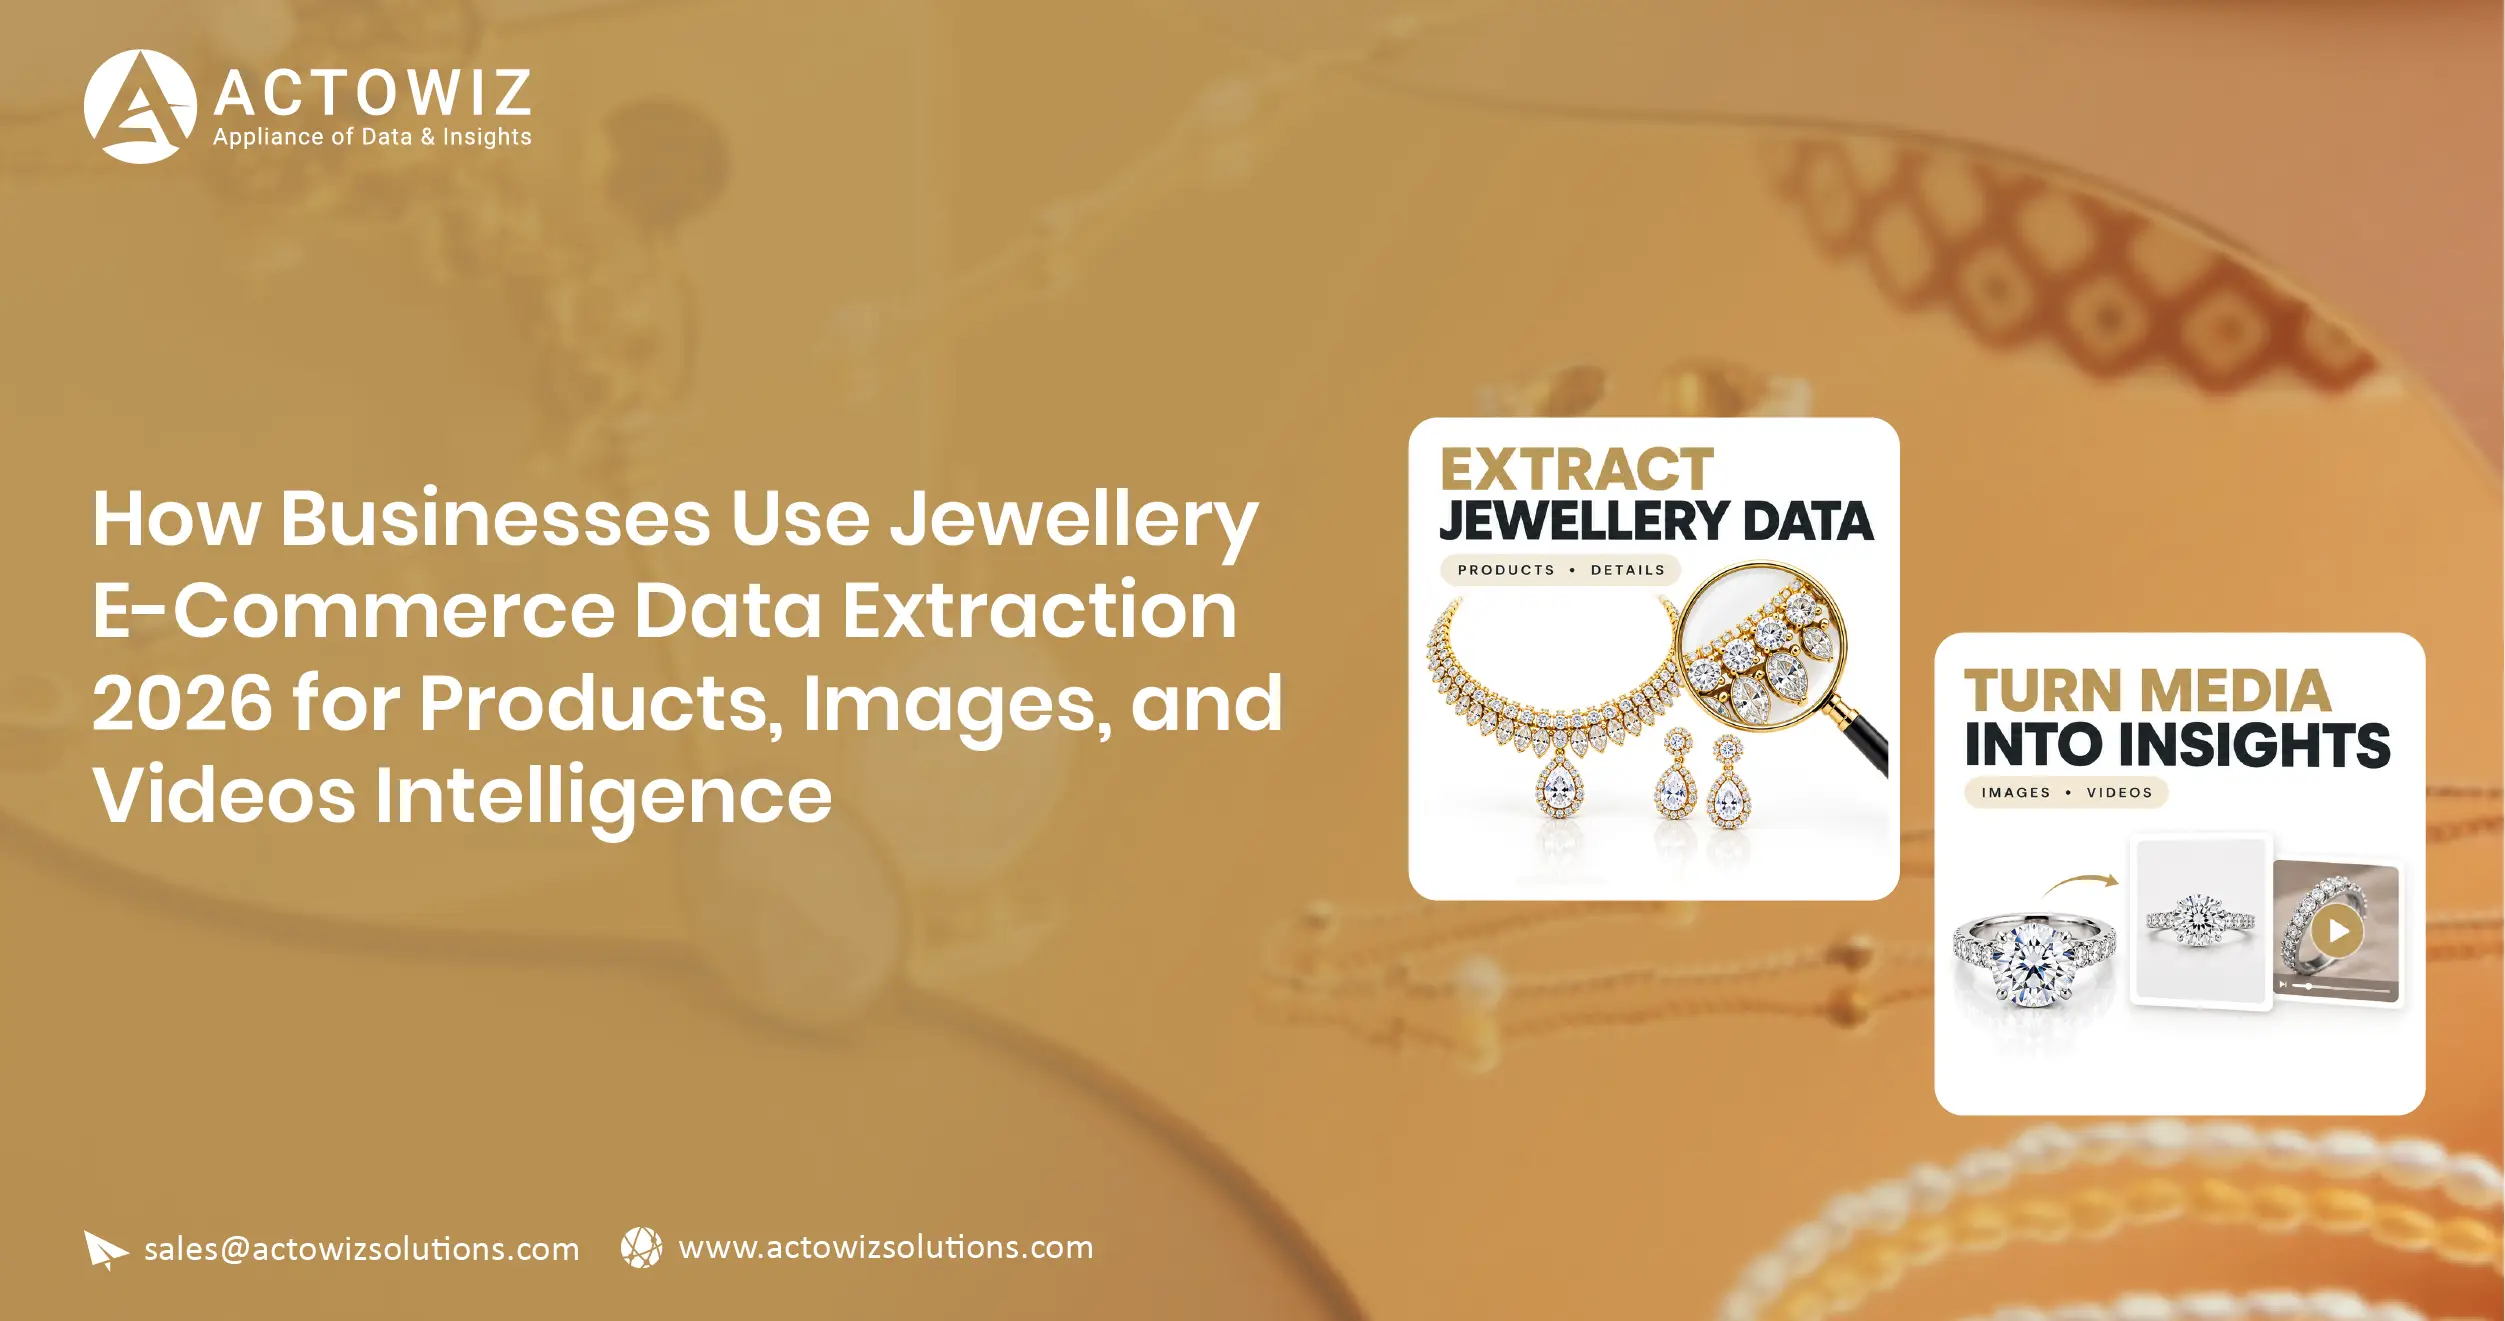
Jewellery E-Commerce Data Extraction 2026 helps brands turn fragmented online product, pricing, image, video, and listing information into structured datasets for competitive analysis, catalog management, merchandising, and market intelligence. The core challenge is not simply finding jewellery products online; it is continuously organizing changing product attributes, visual assets, prices, availability, and marketplace listings into a usable intelligence layer.
E-commerce has become a major digital sales channel. UN Trade and Development (UNCTAD) reports that business e-commerce sales across 45 developed and developing economies reached approximately $28 trillion in 2024, while its latest analysis shows that sales remained 4.4% higher than in 2023. (UNCTADstat)
For jewellery businesses, the need for structured data is particularly important because purchasing decisions depend on both measurable attributes and visual presentation. Gold purity, weight, gemstone details, dimensions, price, discounts, product photography, videos, collections, and availability can all influence product discovery and comparison.
Ecommerce Data Scraping enables retailers, jewellery manufacturers, marketplaces, agencies, and investment or research teams to collect these attributes systematically from publicly accessible digital sources, subject to applicable website terms, laws, and technical restrictions.
The resulting dataset can support:
- Competitor assortment monitoring
- Product and SKU benchmarking
- Jewellery price comparison
- Image and video intelligence
- Digital shelf monitoring
- Catalog enrichment
- New product discovery
- Promotion tracking
- Marketplace analysis
- Brand and collection research
- Historical trend analysis
The target buyer is usually a jewellery retailer, D2C brand, marketplace operator, manufacturer, analytics company, or research team that needs reliable information across hundreds or thousands of product listings instead of manually checking individual pages.
How Can Businesses Improve Product-Level Market Visibility?
Jewellery E-Commerce Product Data Scraping gives jewellery businesses a structured way to monitor the product attributes that matter for assortment, benchmarking, catalog intelligence, and competitive research.
A typical jewellery product dataset can include:
| Product Attribute |
Intelligence Use |
| Product name |
Product discovery and matching |
| SKU/product ID |
Product-level tracking |
| Brand |
Brand benchmarking |
| Category |
Assortment analysis |
| Metal type |
Material comparison |
| Purity/carat |
Product specification analysis |
| Weight |
Value and affordability analysis |
| Gemstone |
Product segmentation |
| Dimensions |
Catalog enrichment |
| Price |
Competitive benchmarking |
| Discount |
Promotion monitoring |
| Product URL |
Source traceability |
| Availability |
Stock visibility |
| Images |
Visual catalog intelligence |
| Videos |
Content and merchandising analysis |
The main advantage is consistency. Instead of collecting product information manually in different formats, businesses can normalize fields into a common schema.
For example, one retailer may describe a product as “18K Gold Ring,” another as “18 Carat Gold Ring,” and another as “750 Gold Ring.” A structured data pipeline can normalize these values so that analysts can compare equivalent products more effectively.
What changed between 2020 and 2026?
The 2020–2026 period shows why digital product intelligence has become more important. In 2020, pandemic restrictions accelerated online retail adoption. UNCTAD reported that online retail sales increased substantially across several major economies, while the share of online retail in total retail sales rose from 16% to 19% globally. (UNCTAD) In 2021, online retail continued expanding, with online retail sales across seven major economies reaching approximately $2.9 trillion. (UNCTAD) By 2022, business e-commerce sales across 43 economies approached $27 trillion. (UNCTAD) UNCTAD's later database shows continued expansion through 2024, reaching $28 trillion across its broader 45-economy dataset. (UNCTADstat) By 2025–2026, jewellery businesses are operating in an environment where digital catalogs are no longer static brochures; they are continuously changing commercial datasets. The World Gold Council's 2025 data also illustrates why product-level monitoring matters: global jewellery demand volume fell 18% to 1,542 tonnes, while demand value increased 18% to a record $172 billion. (World Gold Council)
Actionable insight: Build the dataset around SKU or product ID first. This makes historical comparison more reliable than matching products only by names.
How Can Jewellery Brands Turn Product Images Into Business Intelligence?
E-Commerce Jewellery images Data Extraction focuses on collecting and organizing the visual assets associated with jewellery products.
Jewellery is highly visual. Customers need to understand shape, finish, stone placement, color, scale, styling, and presentation before purchasing. As a result, image intelligence can complement conventional product and pricing datasets.
A visual data collection workflow can capture:
| Visual Data Point |
Possible Business Application |
| Main product image |
Catalog comparison |
| Alternate images |
Content completeness |
| Image URL |
Asset management |
| Image count |
Catalog quality |
| Image dimensions |
Media quality analysis |
| Product angle |
Visual merchandising |
| Model/lifestyle image |
Presentation analysis |
| Collection image |
Campaign research |
| Image sequence |
Merchandising analysis |
| Alt text where available |
Content analysis |
Businesses can use this information to identify which products receive richer visual treatment and which competitors use more lifestyle-oriented presentation.
For example, a jewellery retailer may discover that competing brands consistently use close-up product images, model photography, and multiple viewing angles for high-value products. That observation can inform the retailer's own digital merchandising strategy.
Image extraction also creates a foundation for AI-assisted visual classification. Depending on the project, businesses can categorize images according to attributes such as product type, presentation style, background type, gemstone visibility, or lifestyle versus studio photography.
What changed between 2020 and 2026?
The shift from physical-first retail toward digital discovery accelerated during 2020. Jewellery was particularly affected because consumers traditionally rely on physical inspection and store visits. The World Gold Council noted that India's online jewellery market had already been expanding due to internet penetration and smartphone adoption, while pandemic restrictions accelerated online purchasing. (World Gold Council) Between 2020 and 2022, broader e-commerce expansion increased the importance of digital catalogs and product presentation. By 2023–2024, businesses were increasingly competing through richer digital storefronts rather than text-only product descriptions. UNCTAD's data shows that e-commerce sales across its measured economies continued growing, reaching $28 trillion in 2024. (UNCTADstat) During 2025 and 2026, visual data has become increasingly useful for AI-supported catalog analysis, product matching, and merchandising workflows. For jewellery brands, the practical implication is clear: product images should be treated as structured business data rather than merely media files.
Actionable insight: Store image URLs alongside SKU IDs, timestamps, category, and product attributes so that visual changes can be analyzed historically.
How Can Video Data Reveal New Jewellery Merchandising Opportunities?
E-commerce jewellery Video Data Intelligence extends product intelligence beyond static images by examining how jewellery is demonstrated, promoted, and positioned through video content.
Videos can communicate details that conventional product images may not show clearly. Movement can demonstrate how a necklace sits, how a bracelet reflects light, how earrings move, or how a product appears when worn.
A structured video dataset can contain:
| Video Attribute |
Intelligence Opportunity |
| Product/SKU ID |
Product-video matching |
| Video URL |
Asset tracking |
| Video type |
Content classification |
| Duration |
Content benchmarking |
| Thumbnail |
Creative analysis |
| Product category |
Category-level comparison |
| Collection |
Campaign monitoring |
| Publication date |
Timeline analysis |
| Source page |
Traceability |
| Caption/title |
Content intelligence |
Video intelligence can help businesses understand which products receive video support, how collections are promoted, and which content formats competitors use.
For instance, a brand may identify that competitors use short videos for new collections while relying on static images for evergreen products. Another brand may discover that high-value products receive demonstrations, styling clips, or close-up visual presentations.
This data can be combined with product and pricing information to create richer commercial intelligence.
What changed between 2020 and 2026?
From 2020 onward, consumers increasingly encountered products through digital channels, accelerating the importance of multimedia commerce. UNCTAD reported that 2.3 billion people shopped online in 2021, a 68% increase from 2017. (UNCTAD) By 2022, e-commerce sales across the UNCTAD sample approached $27 trillion, demonstrating the scale of the digital marketplace. (UNCTAD) In 2023 and 2024, digital storefronts continued evolving toward richer product experiences, while UNCTAD's comparable index showed e-commerce sales in its 36-economy sample rising substantially from the 2016 baseline. (UNCTAD) In 2025, jewellery demand showed an important divergence between volume and value: global jewellery consumption fell to a five-year low of 1,542 tonnes, but value reached a record $172 billion. (World Gold Council) In 2026, that divergence makes multimedia intelligence particularly relevant because brands need to understand not only what products are listed but also how products are digitally presented to consumers.
Actionable insight: Connect every video asset to its product ID and capture timestamps. This allows brands to identify when competitors launch, replace, or remove promotional content.
How Can Brands Build a More Complete Digital Jewellery Catalog?
Extract E-commerce Jewellery Catalog Data creates a unified view of products distributed across jewellery websites, marketplaces, and other digital storefronts.
A catalog dataset should go beyond product names and prices. It should capture the attributes necessary to identify, compare, and segment products.
A practical catalog schema may include:
| Catalog Layer |
Example Fields |
| Identity |
SKU, product ID, URL |
| Product |
Name, title, description |
| Brand |
Brand/manufacturer |
| Category |
Ring, necklace, bracelet, earrings |
| Material |
Gold, silver, platinum |
| Purity |
14K, 18K, 22K, etc. |
| Gemstones |
Diamond, ruby, sapphire |
| Weight |
Product/metal weight |
| Dimensions |
Length, width, size |
| Commercial |
Price, discount, offer |
| Inventory |
Availability/status |
| Media |
Images, videos |
| Reviews |
Rating/review count where available |
| Metadata |
Collection, tags, timestamp |
The value of catalog extraction increases when the information is normalized.
A retailer can standardize category names, currencies, units, purity formats, gemstone names, and product identifiers. It can then compare products across different websites using consistent fields.
This can also support assortment-gap analysis. A business could compare its own catalog against competitors and identify categories, price bands, materials, or styles that appear frequently in competitor catalogs but are underrepresented in its own assortment.
What changed between 2020 and 2026?
The growth of online commerce during and after the pandemic increased the importance of complete digital catalogs. In 2020, many businesses were primarily responding to a rapid migration toward online shopping. UNCTAD estimated that online retail's share of total retail sales increased from 16% to 19% during the year. (UNCTAD) By 2021, online shopping had expanded further, with 2.3 billion people purchasing online according to UNCTAD. (UNCTAD) E-commerce sales then approached $27 trillion across 43 economies in 2022. (UNCTAD) The 2023–2024 period brought greater emphasis on structured digital product information, while UNCTAD reported $28 trillion in business e-commerce sales across 45 economies in 2024. (UNCTADstat) In 2025 and 2026, jewellery businesses are also navigating substantial changes in consumer affordability and product mix. The World Gold Council reported that Indian jewellery demand fell from 563.4 tonnes in 2024 to 430.5 tonnes in 2025, while value reached a record $49 billion. (World Gold Council) This makes structured catalog data valuable for understanding product-level changes beneath headline market trends.
Actionable insight: Design catalog extraction around a stable schema before collecting data. A consistent schema makes cross-site matching, historical analysis, and downstream AI processing significantly easier.
How Can Jewellery Retailers Monitor Price Changes More Precisely?
Scrape Jewellery Products pricing Data to create historical price records that help businesses compare product prices, discounts, promotions, and changes across digital channels.
Jewellery pricing is more complex than conventional retail pricing because the final price can reflect metal type, purity, weight, gemstones, craftsmanship, making charges, discounts, taxes, and promotional offers.
A pricing dataset can therefore contain:
| Pricing Field |
Purpose |
| Product/SKU |
Product matching |
| Listed price |
Current benchmark |
| Original price |
Discount calculation |
| Discount |
Promotion monitoring |
| Currency |
Market normalization |
| Metal |
Pricing context |
| Purity |
Specification comparison |
| Weight |
Unit-value analysis |
| Gemstone |
Product valuation context |
| Timestamp |
Historical tracking |
| Availability |
Price-status interpretation |
| Seller |
Competitive comparison |
Historical timestamps are especially important. A current price alone tells a retailer what a product costs now. A time-series dataset can show when the price changed and how frequently it changed.
Businesses can calculate metrics such as:
- Price Change % = ((Current Price − Previous Price) / Previous Price) × 100
- They can also monitor:
- Price increases
- Price reductions
- Discount frequency
- Promotion duration
- Price volatility
- Competitor price gaps
- Price changes by category
- Price changes by material
- Price changes by SKU
What changed between 2020 and 2026?
Price intelligence became more important as online retail expanded and consumers gained greater access to competitive information. In 2020, the pandemic accelerated digital shopping and online retail penetration. (UNCTAD) In 2021, online retail continued growing substantially across major economies. (UNCTAD) By 2022, business e-commerce sales across 43 economies approached $27 trillion. (UNCTAD) In 2023–2024, businesses increasingly operated in marketplaces where customers could compare products and prices quickly; UNCTAD's latest dataset places business e-commerce sales at $28 trillion across 45 economies in 2024. (UNCTADstat) Jewellery pricing became especially dynamic during 2024 and 2025 because of elevated gold prices. The World Gold Council reported that 2024 global jewellery demand volume fell 11%, while value increased 9% to a record $144 billion. (World Gold Council) In 2025, volume fell another 18% while value increased 18% to $172 billion. (World Gold Council) By 2026, retailers therefore need historical product-level pricing data to distinguish market-wide commodity movements from individual retailer pricing strategies.
Actionable insight: Do not overwrite yesterday's price with today's price. Store each observation with a timestamp, source, SKU, currency, and location or market where applicable.
How Can Businesses Monitor Changing Jewellery Listings in Near Real Time?
Real-Time Jewellery Products listings Data enables businesses to monitor changes in online assortments, product availability, pricing, promotions, and newly published products.
A listing-monitoring system can detect events such as:
- New product added
- Product removed
- Product price changed
- Discount introduced
- Discount removed
- Product marked unavailable
- Product returned to stock
- New image added
- Image replaced
- Video added
- Product description changed
- Collection assignment changed
The key difference between one-time extraction and continuous monitoring is historical visibility.
For example, suppose a competitor introduces 50 new jewellery products in a month. A one-time dataset may show those products after the fact. A recurring monitoring system can identify when each product appeared, how its price evolved, whether visual assets changed, and whether it remained available.
What changed between 2020 and 2026?
The 2020–2026 period demonstrates the move from occasional online catalog collection toward continuous digital monitoring. In 2020, e-commerce experienced a rapid pandemic-driven acceleration, with online retail's share of total retail increasing materially. (UNCTAD) In 2021, UNCTAD recorded 2.3 billion online shoppers globally. (UNCTAD) By 2022, business e-commerce sales across the measured economies reached almost $27 trillion. (UNCTAD) UNCTAD's latest analysis indicates that business e-commerce sales reached $28 trillion in 2024 and continued to grow compared with 2023. (UNCTADstat) Meanwhile, jewellery markets have experienced significant shifts in both volume and value. Global jewellery demand reached a record $172 billion in value in 2025 even as consumption volume fell to a five-year low. (World Gold Council) The World Gold Council's Q1 2026 India analysis also reports that digital channels continued to gain momentum among leading listed jewellery retailers. (World Gold Council) This combination of expanding digital commerce and changing jewellery economics makes recurring listing monitoring increasingly valuable for businesses that need current market visibility.
Actionable insight: Set monitoring frequency according to the business question. Daily collection can support price and assortment monitoring, while more frequent collection may be appropriate for rapidly changing marketplaces or promotional campaigns.
How Can Actowiz Solutions Help Jewellery Businesses Build a Data Intelligence Pipeline?
Actowiz Solutions can help businesses design structured data workflows around product discovery, catalog extraction, pricing intelligence, visual assets, and recurring monitoring.
AI-Powered Scraping can be incorporated into a broader workflow where automated collection is combined with normalization, validation, classification, and delivery.
A typical workflow can include:
1. Source discovery Identify relevant jewellery websites, marketplaces, mobile applications, category pages, product pages, and other permitted digital sources.
2. Schema design Define the fields required for the business use case, such as SKU, product title, category, material, purity, weight, price, availability, images, videos, and product URLs.
3. Data collection Collect publicly accessible information through appropriate web or mobile application data extraction methods while respecting applicable terms and regulations.
4. Data normalization Standardize product names, categories, units, currencies, purity formats, prices, and other attributes.
5. Entity matching Match similar products across sources using SKU, product identifiers, normalized titles, specifications, or other relevant attributes.
6. Visual intelligence Organize product images and videos against product IDs to support catalog analysis and visual merchandising research.
7. Validation Apply quality checks for missing fields, duplicate products, malformed records, price anomalies, and inconsistent attributes.
8. Recurring monitoring Schedule extraction according to the required business frequency and maintain historical observations.
9. Dataset delivery Provide structured data through formats and delivery mechanisms aligned with the client's workflow, including databases, files, APIs, or cloud environments where appropriate.
For businesses operating across websites and mobile applications, the same intelligence framework can be extended across multiple digital touchpoints. This is useful when a jewellery brand's website contains one catalog while marketplace or mobile-app listings contain additional products, prices, or promotional information.
The resulting data infrastructure can support dashboards, BI systems, pricing engines, catalog management platforms, AI models, and internal research teams.
Conclusion
Jewellery E-Commerce Data Extraction 2026 gives jewellery businesses a structured foundation for understanding products, images, videos, prices, catalogs, and online listings at scale.
The business value comes from connecting these datasets rather than analyzing each element independently.
A product record can connect to its:
- Current and historical price
- SKU
- Category
- Material
- Purity
- Weight
- Images
- Videos
- Availability
- Competitor listings
- Collection
- Timestamp
This creates a richer intelligence layer for competitive benchmarking, digital shelf monitoring, assortment planning, catalog optimization, pricing analysis, and market research.
The wider e-commerce market provides strong context for this shift. UNCTAD estimates business e-commerce sales across 45 economies at $28 trillion in 2024. (UNCTADstat) At the same time, jewellery markets are experiencing substantial changes in the relationship between volume, value, consumer affordability, and product mix. The World Gold Council reported record global jewellery demand value of $172 billion in 2025 despite a five-year-low consumption volume. (World Gold Council)
For businesses operating in this environment, relying on manually collected or isolated product information can make it difficult to understand market changes quickly.
A structured data strategy can provide a more consistent foundation for decision-making.
Actowiz Solutions supports businesses with Web Scraping, Mobile App Scraping, structured extraction workflows, historical monitoring, and Real-time dataset requirements designed around specific business use cases.
Ready to turn jewellery product, visual, pricing, and listing information into actionable business intelligence? Contact Actowiz Solutions to discuss your custom data collection and scraping requirements!
You can also reach us for all your mobile app scraping, data collection, web scraping , and instant data scraper service requirements!
 Actowiz Solutions

 By industry
 Pricing & Promotions
 Brand & Intelligence
 Digital Shelf & Search
 Assortment
 For Retailers
 E-Commerce Dashboard
 Flipkart Insights (Live)
 Grocery Intelligence
.svg) Grocery Price (U.S.)
.svg) Quick Commerce (India)
 Food & Restaurant
 Fashion Intelligence
 Automotive
 Travel & Hospitality
 Real Estate
 Food Delivery Intelligence
 OTT & Streaming
 Fuel & EV Charging Price Tracker
 By Use Case
 Pricing Intelligence
 Digital Shelf Analytics
 MAP Monitoring
 Cross-Border Price Parity
 Share of Search
 Review Sentiment
 Kitchen Market Gaps
 Dynamic Pricing / AI Repricing
 Promotions & Deals Alerts
 B2B / POI & Lead Data
 AI Search Visibility Dashboard
 Baby Products on Quick Commerce
 Hotel & Flight Rate Parity
 By Region
 Flipkart Real-Time Insights
 Quick Commerce — Zepto · Blinkit
 Pincode Price Tracker
 GCC Q-Commerce — Talabat · Noon
 UK Grocery — Tesco, Sainsbury's, Asda
 AU Grocery — Coles & Woolworths
 Marketplace Scrapers
 Developer APIs
 Universal APIs
 Delivery & SDKs
 Knowledge Center
 Guides & Playbooks
 Downloads & Tools
 Trust & Company


 4.8/5 Average Rating
 50+ Video Testimonials
 92% Client Retention
 50+ Countries Served