Introduction
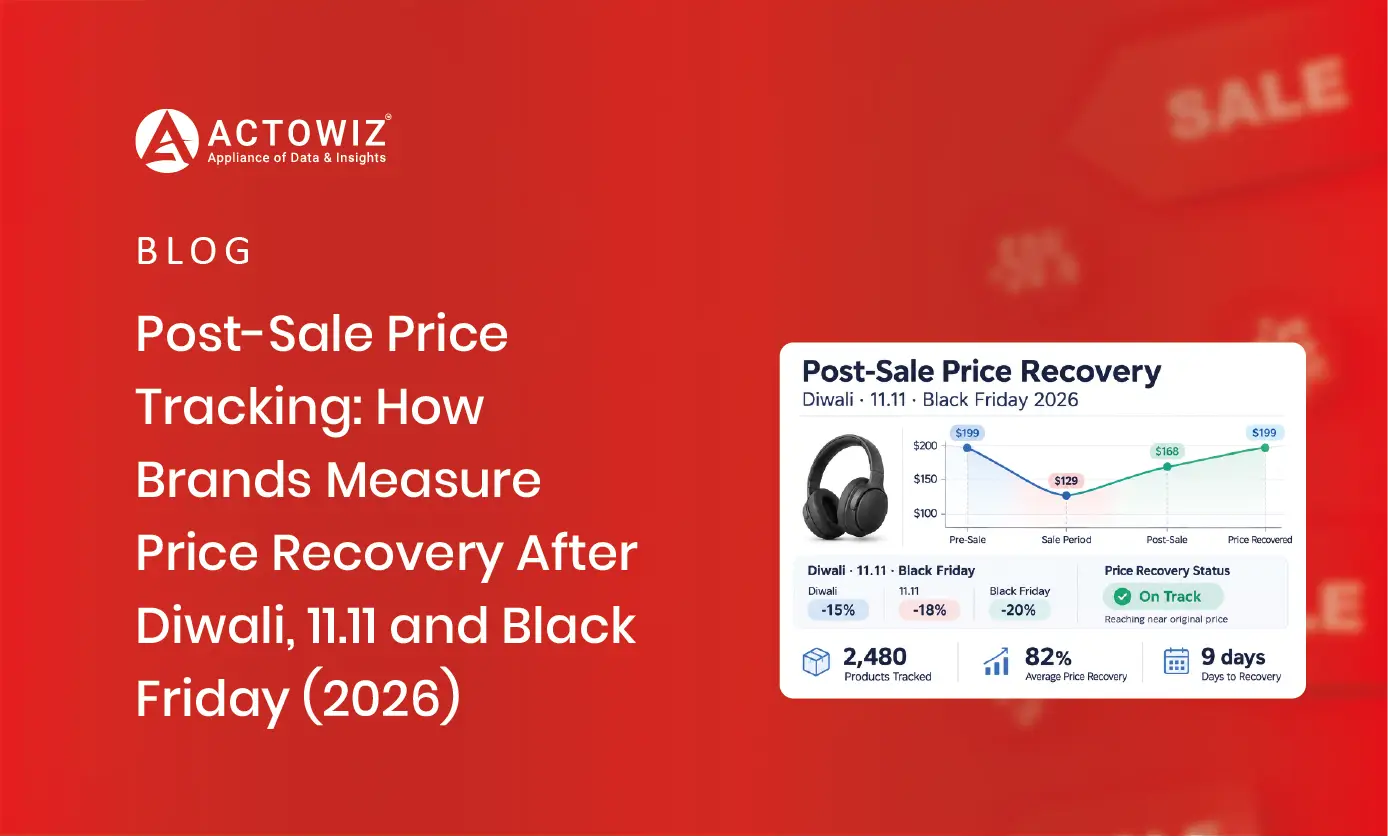
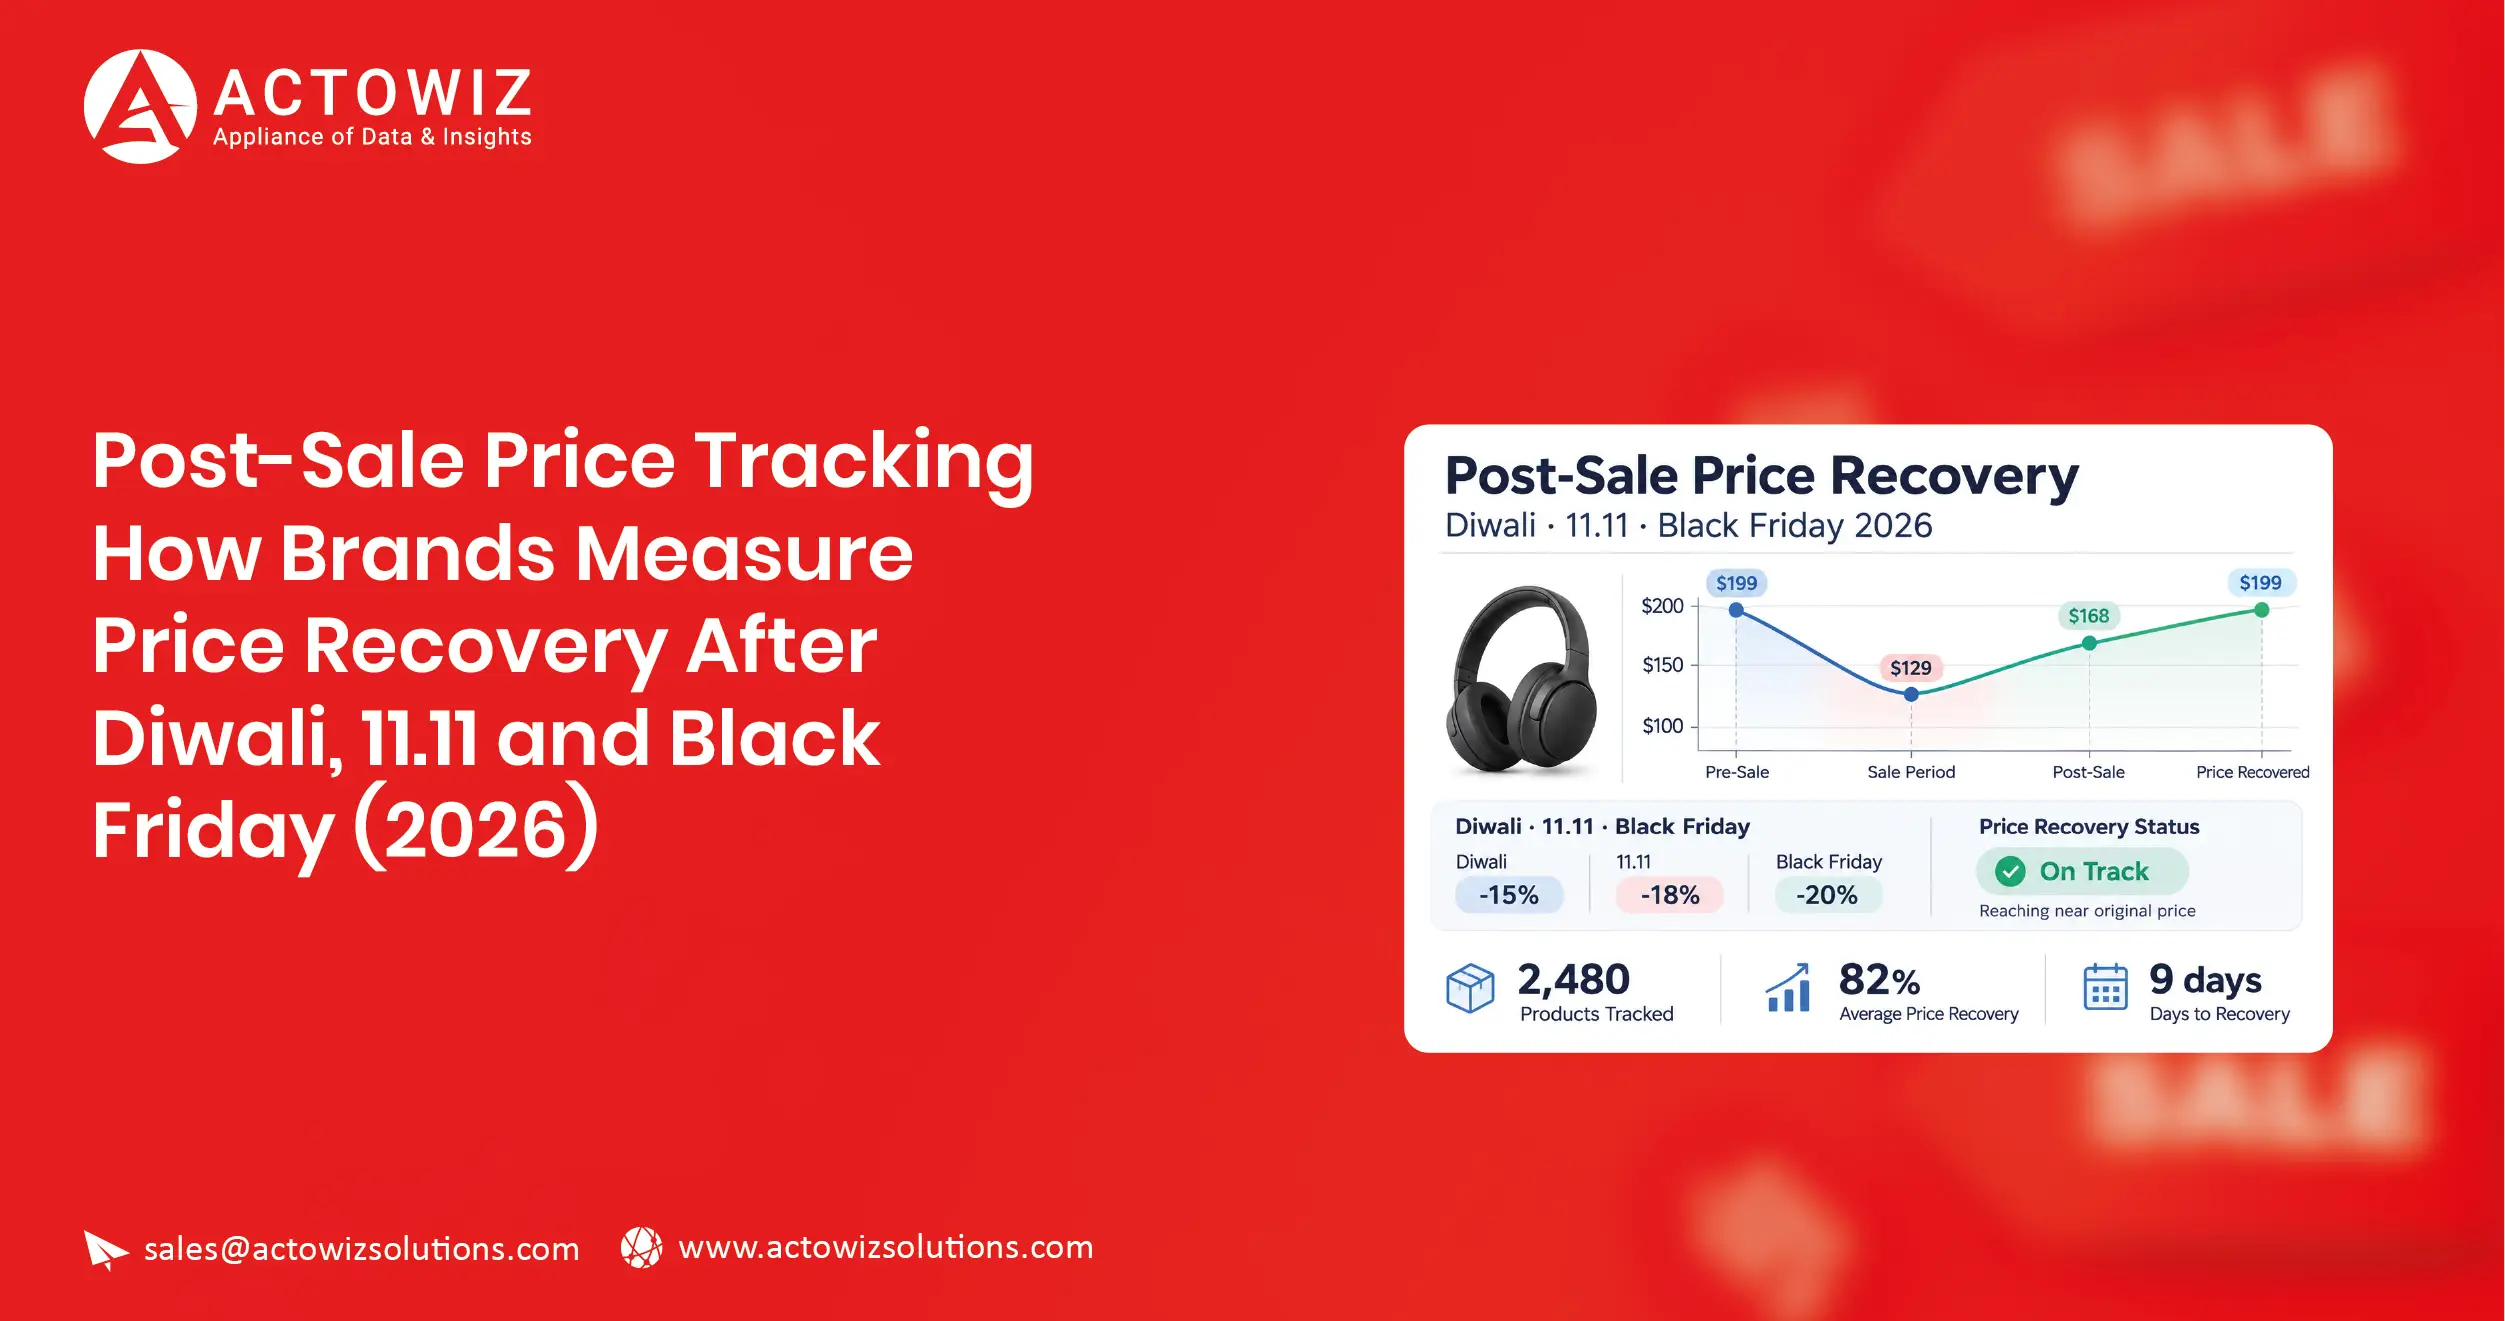
Post-sale price tracking means following the same SKUs daily from before a big sale until weeks after it ends, to see how fast prices return to normal. Brands use it to measure price recovery after Diwali, 11.11 and Black Friday, spot sellers who keep sale prices too long and plan the next event.
Most price tracking stops when the sale ends. That is when the hard questions start. Did the price go back up on day one or drift for weeks? Did one marketplace stay low and drag others down? Did a reseller keep the sale price as its new normal?
The post-sale window is not quiet. One public analysis of more than 430 products tracked from Black Friday 2025 found that 74% hit their lowest price on Black Friday itself, but 111 items, about one in four, got cheaper after Black Friday ended (Decodo, updated 5 December 2025). Without tracking after the event, those moves stay invisible.
Why price recovery matters to brands
- Margin: Every extra day at sale price costs margin. Recovery speed turns that into a number.
- Price perception: If shoppers see the sale price for weeks, it becomes the reference price for the next event.
- Channel conflict: One retailer slow to recover pushes others to match, and the whole channel resets lower.
- Reseller behaviour: Marketplace sellers who stay at sale prices may breach price policies once the agreed event is over. Brands can also use MAP violation monitoring and brand protection to review potential reseller pricing issues.
- Planning: Knowing how each category and channel recovers helps set depth and length for the next sale.
The 2026 event calendar and what to track
| Event |
Main markets |
Typical channels |
Tracking window to use |
| Diwali (8 November 2026) and festive sales |
India |
Amazon.in, Flipkart, quick commerce, brand D2C |
From 2 weeks before the first festive sale to 30 days after Diwali |
| 11.11 (Singles' Day, 11 November) |
Southeast Asia |
Shopee, Lazada, brand stores |
14 days before to 30 days after |
| Black Friday (27 November 2026) and Cyber Monday |
US, UK, EU |
Amazon, major retailers, brand D2C |
14 days before to early January |
| 12.12 |
Southeast Asia |
Shopee, Lazada |
Runs into the post-11.11 window; track both |
In 2026 the events sit close together. Diwali falls on 8 November, 11.11 three days later and Black Friday on 27 November. For brands selling in several regions, the recovery from one event overlaps with the run-up to the next. Keep one baseline per market.
For additional context on regional sale activity, see the 11.11 Sale 2026 discount preview report and the Amazon vs Flipkart festive sale price war analysis. For the November event period, the Black Friday price tracker 2026 provides a related view of promotional pricing.
The 10 fields every post-sale tracker needs
- SKU, platform, country and seller – the key for every row.
- Capture date – daily, with time and time zone.
- Selling price and list or "was" price – as shown on the page.
- Baseline price – your reference, for example the median price in the 14–30 days before the event.
- Event flag – pre-event, event, post-event.
- Discount vs baseline – calculated from selling price and baseline.
- Promotion labels – deal badges, coupons or bank offers, stored as shown.
- Stock status – in stock or not; stock-outs change what recovery means.
- Seller type – first-party retailer or marketplace seller.
- Search rank or best seller position – to see if visibility drops when prices recover.
How to set up post-sale price tracking (6 steps)
Step 1 – Pick the SKUs. Your top sellers, the SKUs that ran deep discounts and key competitor SKUs.
Step 2 – Lock the baseline. Capture daily prices for at least two weeks before the first event. History builds from the start of collection, so this step cannot be added later.
Step 3 – Track the event. Capture several times a day for priority SKUs during the sale itself, so you record the true lowest price.
Step 4 – Keep tracking after. Stay at daily captures for at least 30 days after the event. For Black Friday, keep going until early January.
Step 5 – Calculate recovery. For each SKU and channel, compare daily prices with the baseline and record when each threshold is reached.
Step 6 – Report and act. Share a weekly recovery view with pricing, sales and channel teams. Flag sellers and channels that stay low.
The right capture schedule is important throughout this process. Read the price monitoring frequency guide for additional context on how often prices should be collected.
Recovery KPIs and how to read them
| KPI |
How to calculate |
What it tells you |
| Event depth |
Lowest event price vs baseline |
How much discount was really given |
| Days to 90% recovery |
First day price reaches 90% of baseline |
Speed of the main bounce-back |
| Days to full recovery |
First day price is back at baseline |
Whether the event left a lasting lower price |
| Post-event dip |
Lowest price after the event vs event price |
Clearance or follow-on discounts |
| Recovery gap by channel |
Days to recovery, channel A vs channel B |
Which retailer or marketplace lags |
| Seller lag |
Days a marketplace seller stays at sale price after first-party recovery |
Possible price policy issue |
| New baseline |
Median price days 21–30 after event vs old baseline |
Whether the market has reset lower |
Report KPIs by category and channel. A fast recovery in electronics and a slow one in beauty are different stories that need different actions.
Use cases
- Event review: A one-page summary of depth and recovery for each event, used to plan next year.
- Channel conversations: Evidence for retailer and marketplace teams when one channel recovers slower than others.
- Price policy checks: Time-stamped proof of resellers staying below agreed prices after the event window.
- Revenue management: Feed recovery curves into forecasts so January volume and margin plans are realistic.
- Competitor reading: See which rivals return to full price quickly and which keep discounts running.
Common mistakes
- No baseline: Without pre-event data you cannot measure depth or recovery.
- Stopping on the last sale day: The interesting moves happen in the following weeks.
- One price per day during the event: Flash deals can start and end within hours; you miss the true low.
- Mixing first-party and seller prices: Retailer prices and marketplace seller prices recover at different speeds. Keep them apart.
- Ignoring stock-outs: A product out of stock shows no real price. Do not count it as recovered.
- One region, one calendar: Diwali, 11.11 and Black Friday overlap in 2026. Use a baseline per market.
Legal and compliance basics
Collect only public product pages and search results. Do not log in, do not collect shopper data and respect each site's terms and robots rules. Keep request rates gentle, especially during peak events. Retailers set their own prices; price policies apply to resellers you supply, so treat findings as evidence for your channel team, not automatic violations.
EU prior-price rules: why the baseline matters
In the EU, Article 6a of Directive 98/6/EC, added by Directive (EU) 2019/2161, says any announcement of a price reduction must show the prior price. The prior price means the lowest price the trader applied in a period of at least 30 days before the reduction. Member States may set different rules for goods that spoil quickly, for products on the market less than 30 days and for progressive reductions (EUR-Lex, Directive 2019/2161, opened 17 November 2026).
For brands selling in the EU, this makes post-sale data more important. If prices stay low after Black Friday and a new promotion starts in December, the "prior price" retailers can show may be the low post-sale price. Daily data across the 30-day window lets you see that effect. This is a summary, not legal advice; check national rules with your legal team.
Build vs buy
A simple script can read today's price. Post-sale price tracking needs steady daily history across several markets, sub-daily captures during events, seller separation and clean baselines. Actowiz Solutions delivers event and post-event price data as CSV, JSON, dashboard or API, with recovery KPIs and alerts. Typical coverage per event: [Insert Actowiz dataset value] SKUs across [Insert Actowiz dataset value] channels.
Frequently Asked Questions
What is post-sale price tracking?
It is daily tracking of the same SKUs before, during and after a sale event, to measure discount depth and how fast prices return to normal.
How long should we track after a sale?
At least 30 days. For Black Friday, keep going until early January.
When is Diwali in 2026?
Diwali falls on Sunday, 8 November 2026, with some regional variation.
Can we get prices from before we started tracking?
No. History builds from the start of collection, so begin at least two weeks before the event.
Does post-sale tracking help with EU prior-price rules?
Yes. Daily data across the 30-day window shows the lowest prior price that may apply to the next promotion. Check national rules with your legal team.
 Actowiz Solutions

 By industry
 Pricing & Promotions
 Brand & Intelligence
 Digital Shelf & Search
 Assortment
 For Retailers
 E-Commerce Dashboard
 Flipkart Insights (Live)
 Grocery Intelligence
.svg) Grocery Price (U.S.)
.svg) Quick Commerce (India)
 Food & Restaurant
 Fashion Intelligence
 Automotive
 Travel & Hospitality
 Real Estate
 Food Delivery Intelligence
 OTT & Streaming
 Fuel & EV Charging Price Tracker
 By Use Case
 Pricing Intelligence
 Digital Shelf Analytics
 MAP Monitoring
 Cross-Border Price Parity
 Share of Search
 Review Sentiment
 Kitchen Market Gaps
 Dynamic Pricing / AI Repricing
 Promotions & Deals Alerts
 B2B / POI & Lead Data
 AI Search Visibility Dashboard
 Baby Products on Quick Commerce
 Hotel & Flight Rate Parity
 By Region
 Flipkart Real-Time Insights
 Quick Commerce — Zepto · Blinkit
 Pincode Price Tracker
 GCC Q-Commerce — Talabat · Noon
 UK Grocery — Tesco, Sainsbury's, Asda
 AU Grocery — Coles & Woolworths
 Marketplace Scrapers
 Developer APIs
 Universal APIs
 Delivery & SDKs
 Knowledge Center
 Guides & Playbooks
 Downloads & Tools
 Trust & Company


 4.8/5 Average Rating
 50+ Video Testimonials
 92% Client Retention
 50+ Countries Served