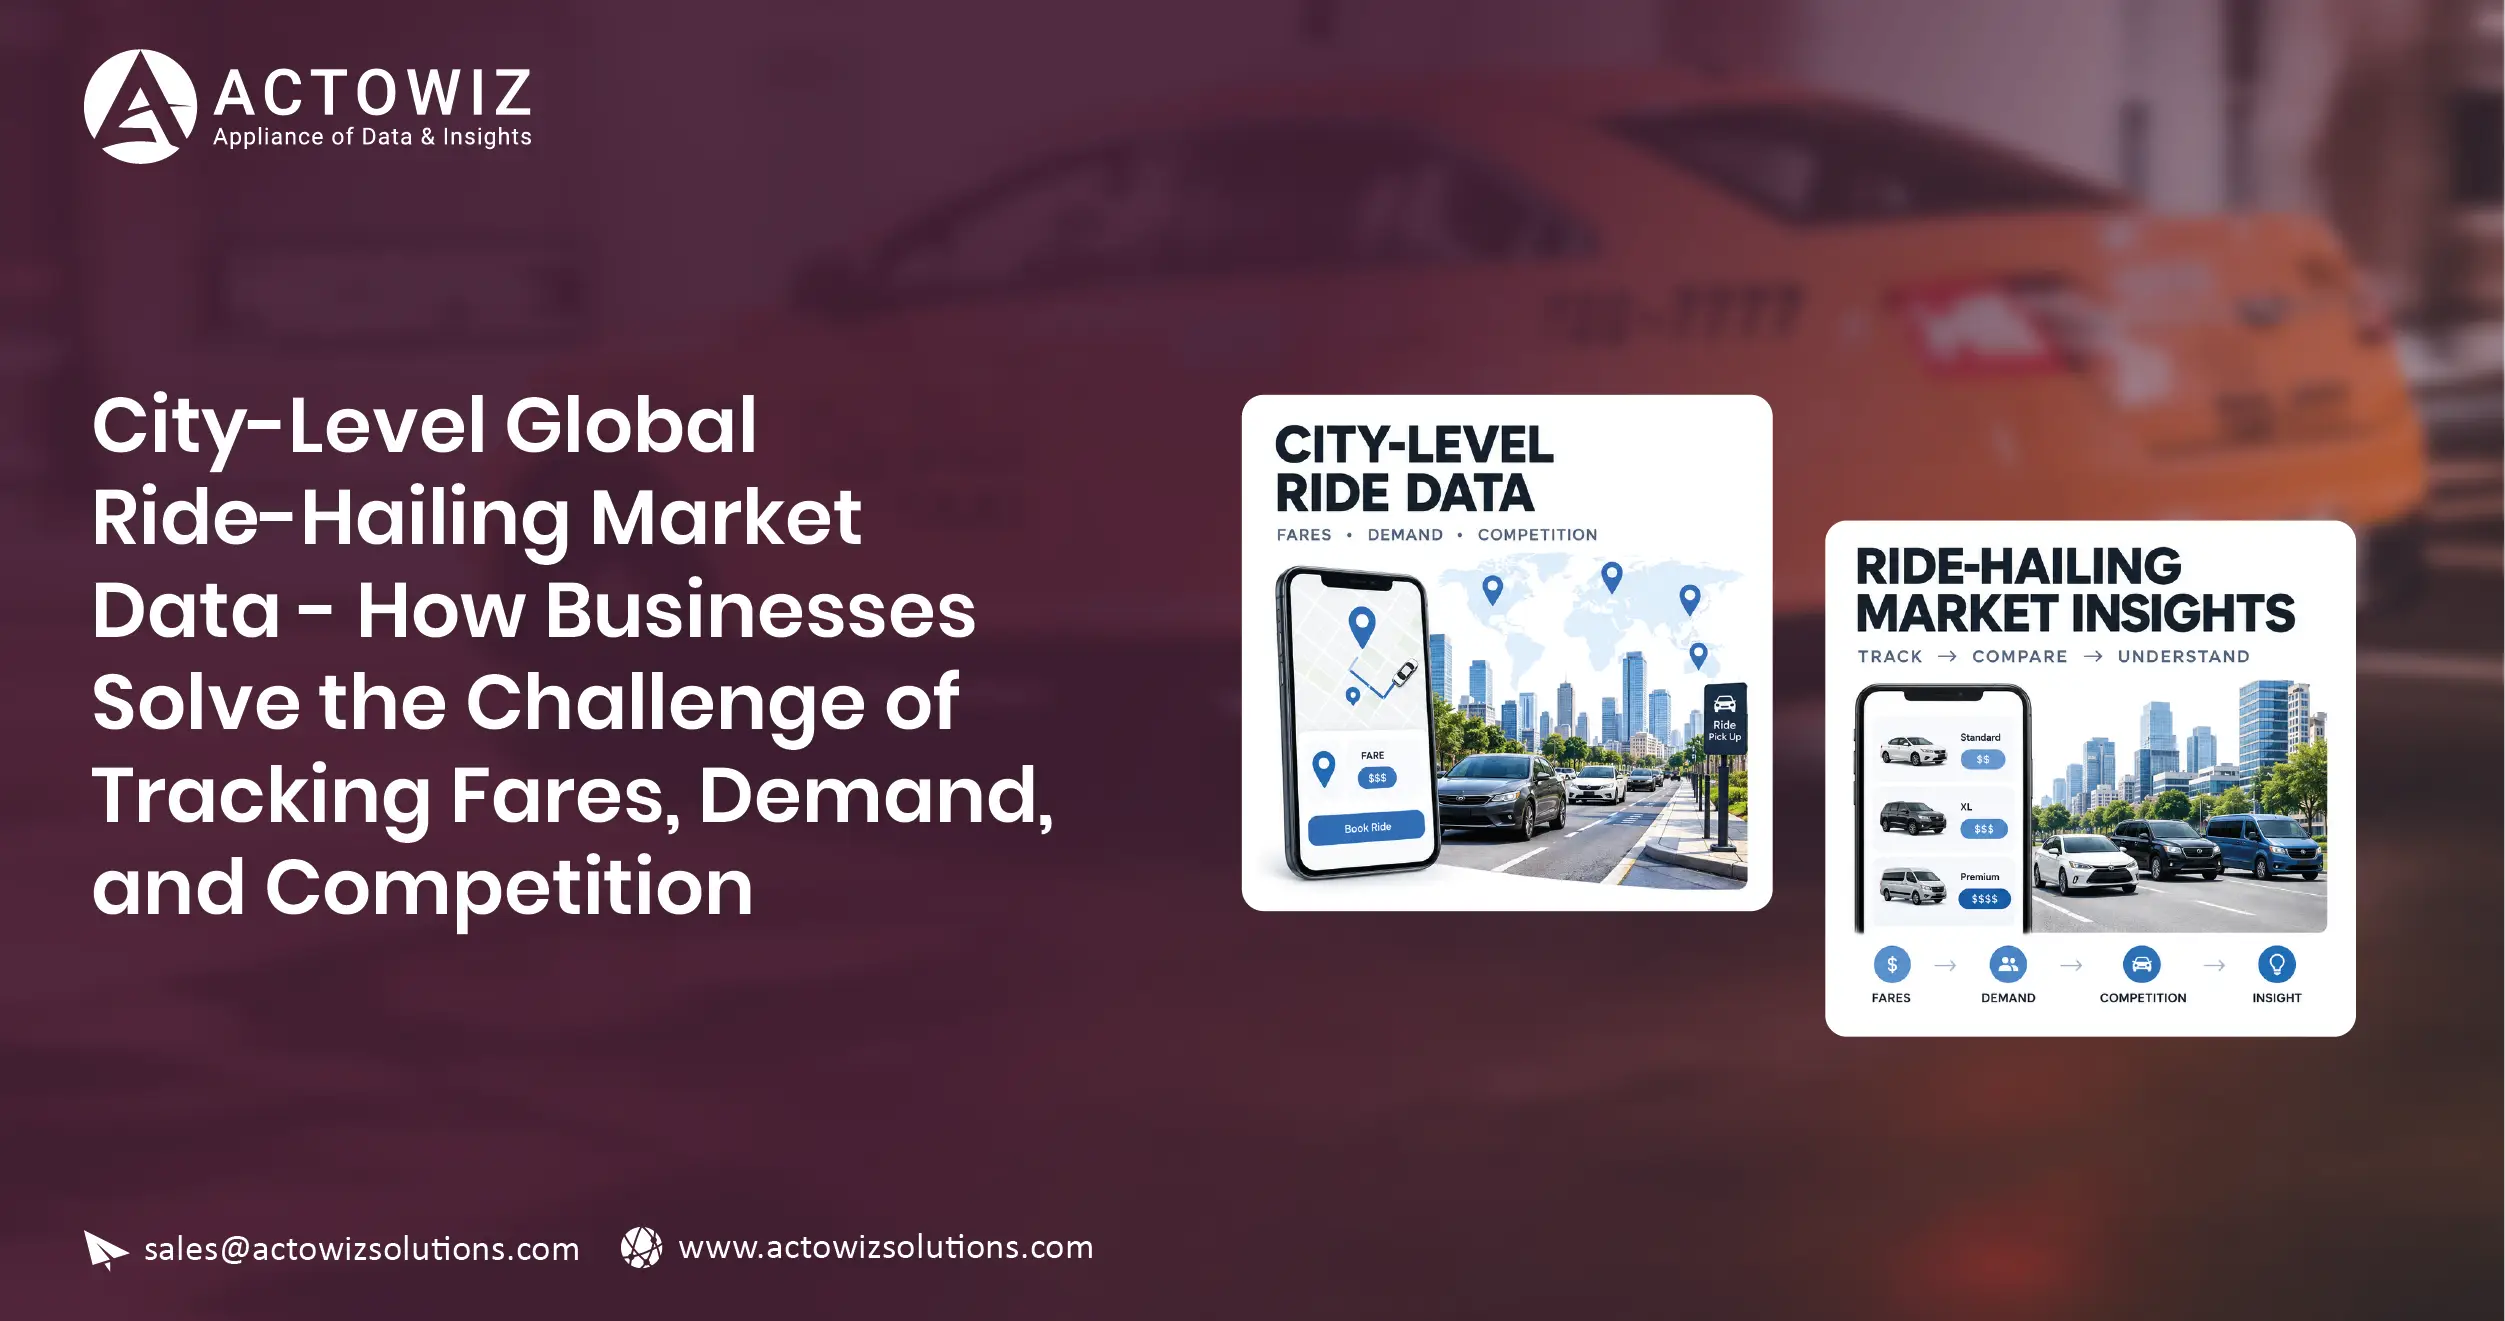
Ride-hailing businesses operate in highly localized markets where fares, demand, driver availability, competition, and service categories can change by city and even by time of day. City-Level Global Ride-Hailing Market Data gives mobility companies, transportation researchers, investors, and travel businesses a structured way to compare these market conditions and identify meaningful changes.
The challenge is not simply collecting a fare from one application. Businesses need recurring, comparable information across cities, platforms, vehicle categories, routes, time windows, and service types. Travel Data Scraping Services can help convert fragmented mobility information into structured datasets for pricing analysis, competitor benchmarking, demand research, and market monitoring.
The scale of the industry makes this increasingly important. The Business Research Company estimated the global ride-hailing market at approximately $150.35 billion in 2024, while Fortune Business Insights estimated the market at $284.74 billion in 2025 using a different market definition and methodology. These differences demonstrate why organizations should document their data definitions before comparing market-size estimates.

For a mobility business, the practical question is therefore:
How can businesses turn city-level ride, fare, and availability observations into a consistent competitive intelligence system?
The answer is a structured pipeline that collects permitted data, normalizes it by city and time, stores historical observations, and transforms those observations into comparable market indicators.
Global Ride-Hailing Competitor Pricing Intelligence helps companies compare fare structures across competing platforms, cities, routes, and time periods. Instead of looking at an isolated displayed price, analysts can create standardized observations containing origin, destination, timestamp, vehicle category, estimated fare, estimated travel time, availability, and promotional conditions.
This matters because a fare comparison is meaningful only when the underlying journey conditions are comparable.
| Pricing Variable | Example Data Point | Business Use |
|---|---|---|
| Pickup city | London | Market segmentation |
| Destination | Central business district | Route benchmarking |
| Vehicle type | Economy | Service comparison |
| Displayed fare | Local currency | Price benchmarking |
| Estimated distance | 12 km | Fare normalization |
| Estimated duration | 35 minutes | Value comparison |
| Collection time | 8:30 AM | Peak-period analysis |
| Availability | Available | Supply monitoring |
Between 2020 and 2026, the importance of recurring price observations increased as digital mobility platforms expanded their use of dynamic pricing and differentiated service categories. The pandemic disrupted travel patterns in 2020, while subsequent years brought changes in commuting, tourism, airport travel, and urban mobility. By 2024, Uber reported 3.1 billion total trips in Q4 alone, averaging approximately 33 million trips per day across its platform. Its Q4 2024 Mobility Gross Bookings reached $22.8 billion, up 18% year over year.
Lyft also reported 828.3 million rides in 2024, compared with 709.0 million in 2023, while Gross Bookings increased 17% to $16.1 billion.
These figures illustrate the scale of platform activity, but they do not provide city-level pricing detail. Businesses therefore need granular observations to understand how market conditions vary locally.
From 2020 through 2026, a useful pricing dataset should retain historical timestamps rather than overwrite previous values. This enables analysts to distinguish persistent pricing patterns from temporary surges caused by weather, events, commuting peaks, airport demand, or supply constraints.
For competitive teams, the most useful metric is often not the cheapest displayed fare. A normalized fare index can compare the same route, vehicle class, and time window across multiple platforms. This creates a more reliable foundation for competitive benchmarking.
Ride-Hailing Demand & Market Data Across Global Cities allows businesses to examine how mobility requirements differ between urban markets. Demand analysis can combine ride availability, estimated pickup time, trip frequency, service categories, search observations, geographic coverage, and time-of-day patterns.
A city-level demand dataset can be organized around several dimensions:
| Demand Dimension | Example Signal | Potential Analysis |
|---|---|---|
| Time | 7–9 AM | Commuter demand |
| Day | Monday | Weekly pattern |
| Location | Airport zone | Travel demand |
| Vehicle type | Economy | Service preference |
| Availability | High/Low | Supply-demand conditions |
| Pickup ETA | 4 minutes | Marketplace liquidity |
| Event period | Concert evening | Demand spike |
| Season | Holiday period | Tourism activity |
The period from 2020 to 2026 shows why historical demand analysis needs context. In 2020, mobility behavior was heavily affected by pandemic-related restrictions and changes in commuting. Subsequent years brought the return of travel and broader adoption of app-based transportation. By 2024, Uber's platform recorded 3.1 billion trips during the fourth quarter, while Lyft reported 828.3 million rides for the full year.
By 2025, Lyft reported 945.5 million rides for the year, a 14% increase from 2024, and 51.3 million annual riders. Uber's 2025 results also showed significant platform-scale growth, with 13.567 billion annual trips reported across its overall platform compared with 11.273 billion in 2024.
These company-level figures cannot be treated as city-specific demand measurements. However, they demonstrate why city-level research needs continuous collection rather than one-time snapshots.
From 2020 to 2026, demand monitoring also became more useful when connected with local events, weather, airport activity, tourism seasons, and commuting schedules. Analysts can compare recurring demand windows and identify abnormal changes.
Businesses can create a city demand index using standardized indicators such as observed availability, pickup time, number of available vehicle categories, and fare changes. This makes different cities easier to compare without assuming that raw ride volume alone represents demand.
Global Ride-Hailing Pricing & Fare Data by City provides the granular foundation required to compare transportation costs between urban markets. A useful dataset should capture the fare displayed for a standardized journey while also recording currency, distance, duration, vehicle type, timestamp, and applicable fees.
This prevents a common analytical problem: comparing two prices that represent different service conditions.
| Comparison Factor | City A | City B | Why It Matters |
|---|---|---|---|
| Trip distance | 10 km | 10 km | Standardizes route |
| Estimated duration | 30 min | 42 min | Shows congestion |
| Economy fare | Local value | Local value | Core comparison |
| Premium fare | Local value | Local value | Service segmentation |
| Pickup ETA | 5 min | 8 min | Availability signal |
| Currency | Local | Local | Conversion required |
| Timestamp | 08:30 | 08:30 | Controls time |
| Surge indicator | Yes/No | Yes/No | Explains price variation |
From 2020 to 2026, ride-hailing pricing became increasingly important as platforms responded to changing demand, driver supply, fuel costs, competition, and marketplace conditions. Lyft's 2024 filing specifically noted that competitive dynamics and pricing pressure affected Gross Bookings toward the end of the year.
The broader market also expanded during this period. The Business Research Company estimated that the global ride-hailing market grew from approximately $150.35 billion in 2019 to $150.34 billion in 2024 under its stated market definition, with a historical CAGR of 4.77%. Another 2026 estimate from the same company placed 2025 market size at $163.55 billion.


Meanwhile, Fortune Business Insights published a substantially different estimate of $284.74 billion for 2025. Such differences are not necessarily contradictory because market research firms can use different inclusions, geographic coverage, service categories, and revenue definitions.
Therefore, between 2020 and 2026, businesses increasingly need transparent data definitions alongside pricing datasets. A fare should be stored with its timestamp and journey characteristics so that historical comparisons remain reproducible.
Create a route-level fare benchmark rather than relying on city averages alone. Comparing the same airport-to-business-district or residential-to-CBD journey at multiple times can reveal pricing behavior that city-wide averages hide.
Global ride-hailing market intelligence connects individual observations into a broader view of how transportation platforms operate across regions. It can combine pricing, service coverage, availability, estimated pickup times, vehicle categories, promotions, ratings, and market presence.
For decision-makers, the objective is not simply to collect more records. It is to identify patterns that answer operational questions:
The 2020–2026 period transformed the way mobility businesses interpret market intelligence. In 2020, historical comparisons were strongly affected by unusual mobility restrictions. By 2023 and 2024, ride volumes and platform activity had recovered substantially. Lyft's rides increased from 709.0 million in 2023 to 828.3 million in 2024, while Gross Bookings increased from $13.775 billion to $16.099 billion.
In 2025, Lyft reported 945.5 million rides and $18.507 billion in Gross Bookings, while its annual rider count reached 51.3 million.
Uber's 2025 results also demonstrate the scale of digital mobility platforms. Its reported annual trips increased from 11.273 billion in 2024 to 13.567 billion in 2025.
However, these global platform metrics do not explain local competitive structures. A mobility company entering a particular city needs city-level observations covering the specific services available there.


From 2020 to 2026, the stronger analytical approach has therefore shifted toward combining macro market reports with granular observations. This allows organizations to use global market statistics for context while using city-level data for operational decisions.
Build a city scorecard containing normalized fare, service coverage, availability, pickup time, and competitor presence. Keep the scorecard descriptive rather than relying on a single composite metric that can conceal important differences.
City-Level Ride-Hailing Market Data Intelligence helps organizations move from broad regional assumptions to location-specific evidence. A global mobility strategy can fail if it treats every city as having identical pricing, consumer behavior, competition, and transportation infrastructure.
A structured city dataset can answer questions such as:
| Business Question | Required Data |
|---|---|
| What does a typical trip cost? | Fare + route + timestamp |
| Which services are available? | Vehicle/service category |
| How competitive is the market? | Platform and seller/service coverage |
| When does pricing change? | Historical fare observations |
| Where are pickup times longer? | ETA + location |
| Which areas have limited coverage? | Geographic availability |
| How does demand vary? | Time-series observations |
Between 2020 and 2026, urban mobility became increasingly dependent on digital platforms, but the underlying market remained geographically fragmented. The global ride-hailing market includes different service models such as e-hailing, car sharing, two-wheelers, four-wheelers, and other transportation categories depending on the market definition used. Fortune Business Insights' 2026 market framework explicitly separates service types, vehicle types, booking modes, and end-user groups.
This segmentation matters because a city with strong two-wheeler adoption cannot be directly compared with a market dominated by sedan-based services without adjusting the analytical framework.
Platform results also show that market scale does not translate automatically into uniform local conditions. Lyft's 2025 filing attributed ride growth partly to international expansion and improvements in marketplace health.
From 2020 through 2026, city-level datasets therefore became particularly valuable for businesses evaluating expansion, competitor activity, route economics, and local travel behavior.
The practical improvement is straightforward: store every observation with a city, geographic coordinates or area identifier where appropriate, timestamp, service type, fare, and availability status. This transforms scattered observations into a longitudinal market dataset.
Segment cities by comparable characteristics—population scale, airport presence, tourism intensity, service mix, and pricing structure—before benchmarking them. This produces more meaningful comparisons than ranking every city against one global average.
Ride-Hailing Market Data becomes significantly more useful when it is designed around specific business questions rather than generic scraping fields. City-Level Global Ride-Hailing Market Data can combine multiple dimensions into a historical research layer covering fares, service availability, competitors, locations, timestamps, and market conditions.
A practical dataset may contain:
| Dataset Field | Purpose |
|---|---|
| City | Geographic segmentation |
| Country | Regional comparison |
| Platform | Competitor identification |
| Pickup location | Origin analysis |
| Drop-off location | Destination analysis |
| Vehicle type | Service segmentation |
| Fare | Price analysis |
| Currency | Financial normalization |
| Distance | Route normalization |
| Duration | Travel-time comparison |
| Pickup ETA | Availability analysis |
| Timestamp | Historical tracking |
| Promotion | Offer analysis |
| Availability | Supply signal |
The 2020–2026 period demonstrates the value of historical mobility datasets. Platform-level indicators expanded considerably after the disruption of 2020. Uber reported 3.1 billion trips in Q4 2024, while Lyft reported 828.3 million rides across 2024. In 2025, Lyft reached 945.5 million rides, and Uber reported 13.567 billion annual trips across its platform.
These numbers provide useful context, but businesses often need a more granular layer: what happened in a specific city, on a particular route, during a particular hour?
That is where historical data collection becomes valuable. A 2020–2026 dataset can help distinguish long-term market changes from temporary events. Analysts can compare pre-disruption observations with recovery periods and more recent market behavior while retaining timestamps and methodological notes.
The dataset should also preserve raw observations alongside normalized values. For example, storing both the original currency fare and converted benchmark value allows analysts to reproduce calculations later.
By 2026, the practical objective is therefore not simply to obtain a large volume of ride-hailing records. It is to maintain a reliable historical structure that supports repeatable city, route, platform, and time-based analysis.
Maintain three layers: raw collection data, standardized records, and analytics-ready tables. This separation makes it easier to correct parsing issues, update currency conversions, audit historical observations, and create new analytical models without recollecting the entire dataset.
Actowiz Solutions can support businesses that need structured mobility datasets across cities, platforms, routes, and time periods. Real-Time Price Monitoring can be incorporated into recurring workflows where permitted data sources provide current fare observations.
A practical solution can include:
For mobility operators and travel businesses, the main advantage is consistency. A recurring pipeline can produce comparable records instead of requiring analysts to manually check multiple platforms every day.
For researchers, the same infrastructure can support longitudinal market studies. For investors and strategy teams, it can provide a structured evidence layer for evaluating city-level market conditions.
The methodology should always distinguish between observed data and inferred indicators. For example, an observed fare is a direct dataset field, while a calculated price index is an analytical measure derived from multiple observations. Keeping this distinction improves transparency and makes datasets easier to audit.
Ride-hailing markets are inherently local. Fares, service categories, availability, pickup times, and competitive conditions can differ substantially between cities and change throughout the day. City-Level Global Ride-Hailing Market Data gives businesses the structured foundation required to compare these variables consistently.
The most useful approach combines recurring collection, route-level normalization, historical snapshots, city segmentation, and transparent methodology. Global platform statistics provide market context, while granular city observations explain what is actually happening at the local level. Uber and Lyft's recent reported growth illustrates the scale of the mobility ecosystem, but their global figures cannot substitute for city-specific research.
For organizations building these systems, Web Scraping can support structured collection from permitted web sources, while Mobile App Scraping can be considered for accessible app-based data where collection is authorized and technically appropriate. The resulting Real-time dataset can support fare monitoring, competitive benchmarking, service availability analysis, route research, and mobility intelligence.
The strongest datasets are not necessarily the largest. They are the ones with consistent definitions, timestamps, geographic context, validation rules, and a clear connection to business questions.
You can also reach us for all your mobile app scraping, data collection, web scraping , and instant data scraper service requirements!
Our web scraping expertise is relied on by 4,000+ global enterprises including Zomato, Tata Consumer, Subway, and Expedia — helping them turn web data into growth.
Watch how businesses like yours are using Actowiz data to drive growth.
From Zomato to Expedia — see why global leaders trust us with their data.
Backed by automation, data volume, and enterprise-grade scale — we help businesses from startups to Fortune 500s extract competitive insights across the USA, UK, UAE, and beyond.
We partner with agencies, system integrators, and technology platforms to deliver end-to-end solutions across the retail and digital shelf ecosystem.
Tour operator data scraping across 10+ sites: prices, availability calendars and inventory from Viator, GetYourGuide, Klook and more.
Sensitive Skin Skincare Product Data API helps brands track cleansers, serums, moisturizers, and sunscreens with structured product data.
Quick commerce availability index for Q4 2026: OOS rate, listing coverage and price index for 50 FMCG brands across 10 Indian cities.
Whether you're a startup or a Fortune 500 — we have the right plan for your data needs.