Core services
Enterprise Data Extraction

Scalable web, app and AI-powered collection across 40+ countries.

All 58 services →
New 2026
AI Training Data

Corpus building with provenance and opt-out compliance.

Learn more →
Free pilot
24-hour sample

We run collection on your own sources before you commit.

Get a sample →
58Services
40+Countries
DEVELOPER

Ready-Made Scrapers

Pre-built for top platforms. Self-serve, no setup.

View All →
TRY FREE

API Playground

Test endpoints instantly. No credit card.

Start Free →
28Tools
2SDKs
icons Delivery & SDKs
Streaming Crawl API Scheduler Realtime Alerts Webhook Delivery 🐍 Python SDK 💚 Node.js SDK

Need it managed instead?

Fixed monthly retainer, named engineer, no per-request metering.

Managed Data API →
HOT

Case Studies

How brands use Actowiz, with named outcomes.

Read →
FREE

Sample Datasets

Real output, no signup.

Download →
NEW

ROI Calculator

Model the return on a data engagement.

Calculate →

Introduction

Quick commerce has become a primary shelf for many FMCG brands in Indian metros. Yet most published benchmarks look at platforms or cities, not at brands. This quick commerce availability index fills that gap for Q4 2026 (October–December).

Direct answer: The Quick Commerce Availability Index Q4 2026 measures, for 50 leading FMCG brands in 10 Indian cities, how often their products are listed and in stock on Blinkit, Swiggy Instamart and Zepto. It reports listing coverage, availability rate, out-of-stock (OOS) rate and a price index by brand, city, category and platform.

Market context in this report comes from company filings and published research, each cited. Actowiz measurements for Q4 2026 are captured from 1 October to 31 December 2026: capture parameters below are the planned design, city-level figures are marked "Est." as indicative ranges until the dataset is reviewed, and the brand ranking is published only from measured data in January 2027.

How big is India's quick-commerce market going into Q4 2026?

The three largest platforms all reported strong growth in the April–June 2026 quarter (Q1 FY27). Eternal said Blinkit's net order value (NOV) reached ₹17,132 crore, up 86% year on year, and Eternal has moved from gross order value to NOV as its main metric (Kotak Neo, 22 Jul 2026). Blinkit's network reached 2,443 stores after 200 net additions in the quarter, as reported by Outlook Business citing CNBC-TV18 (Outlook Business, 23 Jul 2026).

Swiggy's shareholder letter reported Instamart gross order value (GOV) of ₹7,907 crore in Q1 FY27, up 39.8% year on year, with 1,171 active dark stores across 131 cities. Contribution margin improved to −0.2% of GOV for the quarter (Swiggy letter to shareholders, 30 Jul 2026) Inc42 reported that Instamart reached contribution breakeven during the quarter. Zepto's updated draft red herring prospectus showed 1,139 dark stores as of 31 March 2026, FY26 operating revenue of ₹22,623.6 crore and more than 640 million orders (Outlook Business, 9 Jun 2026).

At market level, Bain and Flipkart estimate quick-commerce GMV at $10–11 billion in 2025, delivered from more than 7,000 micro-fulfilment centres in over 200 cities. Their forecast is $65–70 billion by 2030 (Bain, Apr 2026). That forecast is an estimate, not a reported figure.

Platform / market Metric Value Period Source
Blinkit (Eternal) Net order value ₹17,132 crore (+86% YoY) Q1 FY27 (Apr–Jun 2026) Kotak Neo report of Eternal results
Blinkit (Eternal) Stores 2,443 (200 net added in quarter) Jun 2026 Outlook Business citing CNBC-TV18
Swiggy Instamart Gross order value ₹7,907 crore (+39.8% YoY) Q1 FY27 Swiggy shareholder letter (NSE filing)
Swiggy Instamart Active dark stores; cities 1,171; 131 Jun 2026 Swiggy shareholder letter (NSE filing)
Zepto Dark stores 1,139 31 Mar 2026 Outlook Business on Zepto UDRHP
Zepto Revenue from operations ₹22,623.6 crore FY26 Outlook Business on Zepto UDRHP
India quick commerce GMV $10–11 billion 2025 (estimate) Bain & Flipkart
India quick commerce GMV forecast $65–70 billion 2030 (forecast) Bain & Flipkart

Sources: see Sources 1–7. Estimate / forecast rows are based on Bain & Company with Flipkart, How India Shops Online 2026.

Why do FMCG brands need a brand-level availability index?

Dark-store networks keep growing, and each store carries a curated range. Outlook Money, citing Zepto's prospectus, reported Zepto at about 2,140 orders per dark store per day in the March quarter, with its own estimates of roughly 1,357 for Blinkit and 1,095 for Instamart (Outlook Money, 9 Jun 2026). At that throughput, a brand that is missing from a store for even a few hours loses orders to whoever is on the shelf.

Platform-level studies cannot show which brands are winning that shelf. Our existing India dark store coverage and availability benchmark tracks the network itself, and the quick-commerce price and assortment index compares platforms. This report goes one level down: brand by city by platform, every quarter.

Investors use the same view differently. Brand availability across cities is an outside-in signal of distribution strength and supply discipline, which complements company disclosures rather than replacing them.

Benchmark view Unit of analysis Answers Where to find it
Network benchmark Platform × city Where are dark stores and how wide is coverage? India dark store availability benchmark
Price & assortment index Platform Which platform is cheaper or broader? Quick-commerce price & assortment index
Brand listings report Brand × platform Which SKUs are listed, added or removed? Quick-commerce brand listings report
This index (Q4 2026) Brand × city × platform × quarter How available is each top brand, where, and at what price? This report

How is the Q4 2026 quick commerce availability index built?

Brand selection. The top 50 FMCG brands are chosen from brands visible on all three core platforms in the sample cities, ranked by the number of distinct SKUs listed in a baseline capture in the first week of October 2026. Private labels owned by platforms are reported separately and do not enter the top 50. The final list will be published with the report The list is fixed after the baseline capture and published with the full report; brands are named only alongside measured results..

Categories. Brands are grouped into eight categories: dairy and breakfast; packaged foods and snacks; beverages; staples and cooking essentials; personal care; home care; baby care; and health and OTC wellness. A brand with SKUs in several categories is measured in each.

Cities and pincodes. Ten cities: Delhi NCR, Mumbai, Bengaluru, Hyderabad, Chennai, Pune, Kolkata, Ahmedabad, Jaipur and Lucknow . Within each city, pincodes are sampled across central, residential and peripheral zones so that results are not driven by a single dense area.

Capture times. Each sampled pincode is captured at fixed slots across the day, covering the morning, midday, evening peak and late-night windows, on weekdays and weekends. Only publicly visible listing pages are collected, without logins or personal data.

Parameter Specification
Capture window 1 October – 31 December 2026 (Q4 2026)
Platforms Blinkit, Swiggy Instamart, Zepto – core index; BB Now and Flipkart Minutes are tracked as context only and do not enter the index score
Brands Top 50 FMCG brands (selection rule above)
Categories 8 category groups
Cities 10 cities
Pincodes sampled Planned: about 200 (about 20 per city across central, residential and peripheral zones)
Capture slots per day Planned: 4 (morning, midday, evening peak, late night)
Distinct SKUs tracked Planned: about 2,500 matched SKUs across the 50 brands
Total observations Planned: about 2 million per capture day (2,500 SKUs × 200 pincodes × 4 slots), on 2–3 days a week – roughly 60–70 million over the quarter
Matching method Brand + variant + net quantity matched to a master SKU list, with manual review of low-confidence matches

How are availability, OOS rate, listing coverage and price index defined?

Clear definitions are the foundation of any quick commerce availability index, because 'availability' is used loosely in this market. Some benchmarks merge 'not listed' with 'out of stock', which hides very different problems. Here the two are always kept apart.

A listing that shows 'notify me' or 'out of stock' counts as listed but unavailable. A product that does not appear at all for a pincode counts as not listed. Prices are compared on a per-unit basis (per 100 g, per 100 ml or per piece), so pack-size differences do not distort the price index.

Metric Definition Formula
Listing coverage Share of a brand's tracked SKUs that are listed in a pincode Listed SKU-pincode pairs ÷ tracked SKU-pincode pairs
Availability rate Share of listed observations that are in stock In-stock observations ÷ listed observations
OOS rate Share of listed observations that are out of stock 1 − availability rate
Effective availability Combined view of listing and stock Listing coverage × availability rate
Price index Brand's average per-unit selling price vs the category median in the same city and platform (Brand unit price ÷ category median unit price) × 100
Discount depth Average gap between MRP and selling price (MRP − selling price) ÷ MRP
Index score Composite ranking score 0.7 × effective availability (scaled 0–100) + 0.3 × price score, where price score = 100 − |price index − 100|

Which brands lead the quick commerce availability index in Q4 2026?

This section will rank all 50 brands by index score, with listing coverage, availability, OOS rate and price index shown for each. The ranking table will be filled from the reviewed Q4 dataset; no brand positions are stated until then.

Commentary on the top five brands, the largest gaps between listing coverage and availability, and brands whose OOS rate differs sharply between platforms will be added after the Q4 data review in January 2027. Brand positions are not estimated in advance.

Rank Brand Category Listing coverage Availability OOS rate Price index
1 Published Jan 2027 Pending Pending Pending Pending Pending
2 Published Jan 2027 Pending Pending Pending Pending Pending
3 Published Jan 2027 Pending Pending Pending Pending Pending
4 Published Jan 2027 Pending Pending Pending Pending Pending
5 Published Jan 2027 Pending Pending Pending Pending Pending
… … … … … … …
50 Published Jan 2027 Pending Pending Pending Pending Pending

Source: Actowiz Solutions Q4 2026 quick-commerce capture. Full 50-row table in the downloadable report.

How does availability vary by city, platform and category?

City results show whether a brand's distribution is consistent outside its strongest markets. Tier-1 metros generally have denser dark-store networks, but density alone does not guarantee that a specific brand is stocked.

Platform results compare the same brands across Blinkit, Swiggy Instamart and Zepto in the same pincodes and time slots. Category results show where shelf pressure is highest, for example in fast-moving dairy versus slower home-care lines.

City Blinkit availability (Est.) Instamart availability (Est.) Zepto availability (Est.) Median OOS rate (all brands) (Est.)
Delhi NCR 93–95% 90–93% 91–94% 6–8%
Mumbai 92–94% 90–93% 91–94% 6–9%
Bengaluru 92–95% 91–94% 92–95% 5–8%
Hyderabad 91–94% 89–92% 90–93% 7–9%
Chennai 90–93% 89–92% 89–92% 7–10%
Pune 90–93% 89–92% 90–93% 7–10%
Kolkata 89–92% 87–90% 87–90% 8–11%
Ahmedabad 89–92% 87–90% 87–91% 8–11%
Jaipur 87–90% 85–89% 85–89% 10–13%
Lucknow 86–90% 84–88% 84–88% 10–14%

Source: Actowiz Solutions Q4 2026 capture. Category-level table (8 categories × 3 platforms) included in the full report.

Time-of-day results will be reported as a separate cut: availability by capture slot, to show whether stock-outs cluster around evening peaks or late-night windows. Indicative pattern (Est.): stock-outs are expected to cluster in the evening peak (about 6–10 pm), at roughly 1.5–2× the morning OOS rate, with fresh dairy and breakfast lines most affected.

How should brand teams and investors use the index?

Brand teams can use the index to set availability targets per city and platform, and to hold distributors and platform account managers to them. A gap between high listing coverage and low availability usually points to replenishment, not listing, as the problem.

Investors can read the quick commerce availability index alongside company filings. A brand's effective availability across ten cities, tracked quarter on quarter, is a consistent outside-in measure of distribution execution in the fastest-growing channel.

Audience Question Metric to use
Brand sales / key accounts Where are we listed but not stocked? Listing coverage vs availability rate by city
Supply chain / distributors When do stock-outs happen? OOS rate by capture slot and pincode zone
Revenue management Are we priced above the category? Price index and discount depth
Category / insights How do we compare with peers? Index score and rank within category
Investors / analysts Is distribution improving quarter on quarter? Effective availability trend by brand

How Actowiz Solutions Helps

  1. Multi-platform data collection – Public listing capture from Blinkit, Swiggy Instamart, Zepto and other grocery apps at pincode level, on a schedule you choose.
  2. SKU matching and pack-size normalisation – Listings mapped to your master SKU list, with prices converted to per-100 g, per-100 ml or per-piece values.
  3. Availability and OOS metrics – Listing coverage, availability rate and OOS rate kept as separate measures, by city, platform, category and time slot.
  4. Custom brand panels – Run this index for your own brand set, competitor list or city mix, and track it monthly or weekly.
  5. Delivery that fits your stack – CSV, Excel, API or a dashboard, with alerts for stock-outs in priority pincodes.
  6. Responsible collection – Public business data only, no logins, no personal data, and respect for site terms.

Conclusion

Company filings show quick commerce scaling fast in 2026, with Blinkit, Instamart and Zepto together running thousands of dark stores. What filings do not show is how reliably individual brands are on those shelves, city by city and hour by hour. A brand-level quick commerce availability index answers that.

The Q4 2026 edition will rank 50 FMCG brands across 10 cities on listing coverage, availability, OOS rate and price position, using the definitions above. Brand teams get targets they can manage against; investors get a consistent quarterly signal.

Download the report using the form on the right, or contact sales to run the index for your own brand set.

Frequently Asked Questions

What is a quick commerce availability index?

It is a benchmark that measures how often products are listed and in stock on quick-commerce apps. This edition scores 50 FMCG brands across 10 Indian cities on Blinkit, Swiggy Instamart and Zepto for Q4 2026.

How is OOS rate different from listing coverage?

Listing coverage shows whether a product appears for a pincode at all. OOS rate shows how often a listed product is marked out of stock. Keeping them apart separates listing problems from replenishment problems.

Which cities and platforms are covered?

Ten cities – Delhi NCR, Mumbai, Bengaluru, Hyderabad, Chennai, Pune, Kolkata, Ahmedabad, Jaipur and Lucknow – on Blinkit, Swiggy Instamart and Zepto. Additional platforms are listed in the methodology if included.

How are brands selected for the top 50?

Brands visible on all three core platforms in the sample cities are ranked by distinct SKUs listed in a baseline capture in early October 2026. Platform private labels are reported separately.

Can I get the index for my own brand and competitors?

Yes. Actowiz can run the same methodology for a custom brand set, city list or capture frequency and deliver it as a file, API or dashboard.

Is the data collected from public pages only?

Yes. Only publicly visible listing information is captured, without logins or personal data, and in line with site terms.

Social Proof That Converts

Trusted by Global Leaders Across Q-Commerce, Travel, Retail, and FoodTech

Our web scraping expertise is relied on by 4,000+ global enterprises including Zomato, Tata Consumer, Subway, and Expedia — helping them turn web data into growth.

4,000+ Enterprises Worldwide
50+ Countries Served
20+ Industries
Join 4,000+ companies growing with Actowiz →
Real Results from Real Clients

Hear It Directly from Our Clients

Watch how businesses like yours are using Actowiz data to drive growth.

▶
1 min
★★★★★
"Actowiz Solutions offered exceptional support with transparency and guidance throughout. Anna and Saga made the process easy for a non-technical user like me. Great service, fair pricing!"
TG
Thomas Galido
Co-Founder / Head of Product at Upright Data Inc.
▶
2 min
★★★★★
"Actowiz delivered impeccable results for our company. Their team ensured data accuracy and on-time delivery. The competitive intelligence completely transformed our pricing strategy."
II
Iulen Ibanez
CEO / Datacy.es
▶
1:30
★★★★★
"What impressed me most was the speed — we went from requirement to production data in under 48 hours. The API integration was seamless and the support team is always responsive."
FC
Febbin Chacko
-Fin, Small Business Owner
icons 4.8/5 Average Rating
icons 50+ Video Testimonials
icons 92% Client Retention
icons 50+ Countries Served

Join 4,000+ Companies Growing with Actowiz

From Zomato to Expedia — see why global leaders trust us with their data.

Why Global Leaders Trust Actowiz

Backed by automation, data volume, and enterprise-grade scale — we help businesses from startups to Fortune 500s extract competitive insights across the USA, UK, UAE, and beyond.

icons
7+
Years of Experience
Proven track record delivering enterprise-grade web scraping and data intelligence solutions.
icons
4,000+
Projects Delivered
Serving startups to Fortune 500 companies across 50+ countries worldwide.
icons
200+
In-House Experts
Dedicated engineers across scrapers, AI/ML models, APIs, and data quality assurance.
icons
9.2M
Automated Workflows
Running weekly across eCommerce, Quick Commerce, Travel, Real Estate, and Food industries.
icons
270+ TB
Data Transferred
Real-time and batch data scraping at massive scale, across industries globally.
icons
380M+
Pages Crawled Weekly
Scaled infrastructure for comprehensive global data coverage with 99% accuracy.

AI Solutions Engineered
for Your Needs

→
LLM-Powered Attribute Extraction: High-precision product matching using large language models for accurate data classification.
→
Advanced Computer Vision: Fine-grained object detection for precise product classification using text and image embeddings.
→
GPT-Based Analytics Layer: Natural language query-based reporting and visualization for business intelligence.
→
Human-in-the-Loop AI: Continuous feedback loop to improve AI model accuracy over time.
icons Product Matching icons Attribute Tagging icons Content Optimization icons Sentiment Analysis icons Prompt-Based Reporting

Connect the Dots Across
Your Retail Ecosystem

We partner with agencies, system integrators, and technology platforms to deliver end-to-end solutions across the retail and digital shelf ecosystem.

icons
Analytics Services
icons
Ad Tech
icons
Price Optimization
icons
Business Consulting
icons
System Integration
icons
Market Research
Become a Partner →

Popular Datasets — Ready to Download

Browse All Datasets →
icons
Amazon
eCommerce
Free 100 rows
icons
Zillow
Real Estate
Free 100 rows
icons
DoorDash
Food Delivery
Free 100 rows
icons
Walmart
Retail
Free 100 rows
icons
Booking.com
Travel
Free 100 rows
icons
Indeed
Jobs
Free 100 rows

Latest Insights & Resources

View All Resources →
thumb
Blog

Tour Operator Data Scraping: Prices, Availability and Inventory Across 10+ Sites (2026 Guide)

Tour operator data scraping across 10+ sites: prices, availability calendars and inventory from Viator, GetYourGuide, Klook and more.

thumb
Case Study

How Sensitive Skin Skincare Product Data API Helps Brands Track Cleansers, Serums, Moisturizers, and Sunscreens

Sensitive Skin Skincare Product Data API helps brands track cleansers, serums, moisturizers, and sunscreens with structured product data.

thumb
Report

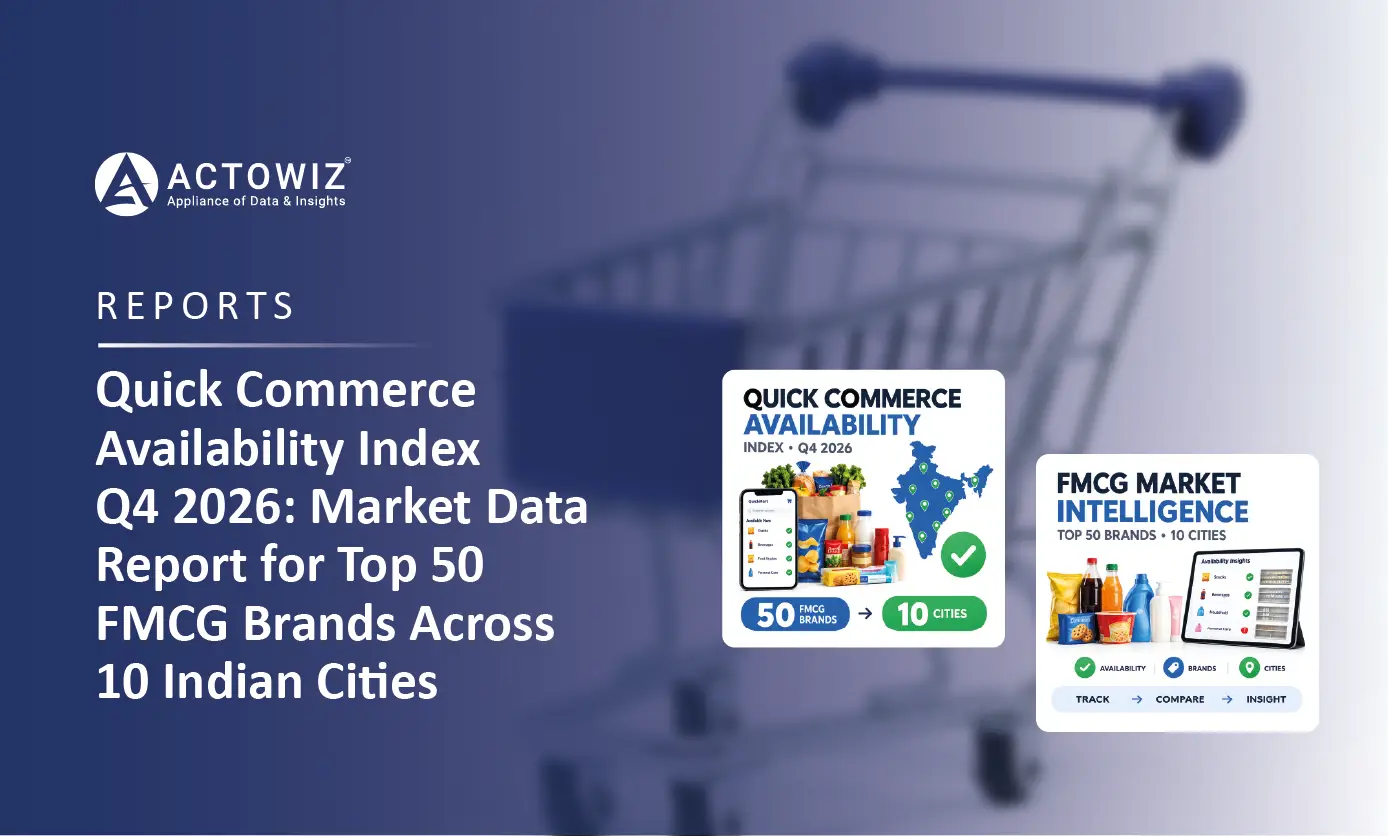
Quick Commerce Availability Index Q4 2026: Market Data Report for Top 50 FMCG Brands Across 10 Indian Cities

Quick commerce availability index for Q4 2026: OOS rate, listing coverage and price index for 50 FMCG brands across 10 Indian cities.

Start Where It Makes Sense for You

Whether you're a startup or a Fortune 500 — we have the right plan for your data needs.

icons
Enterprise
Book a Strategy Call
Custom solutions, dedicated support, volume pricing for large-scale needs.
icons
Growing Brand
Get Free Sample Data
Try before you buy — 500 rows of real data, delivered in 2 hours. No strings.
icons
Just Exploring
View Plans & Pricing
Transparent plans from $500/mo. Find the right fit for your budget and scale.

Request Free Sample Data

Our team will reach out within 2 hours with 500 rows of real data — no credit card required.

+1 ▼
✓ Free 500-row sample · No credit card · Response within 2 hours