Introduction
Businesses can make better expansion decisions by comparing ride-hailing fares, trip demand, driver availability, service coverage, and competitor positioning across Colombian cities. Colombia Ride-Hailing Market Data 2026 provides a framework for organizing these indicators into actionable market intelligence, helping mobility platforms, transport operators, investors, and market researchers assess opportunities using measurable evidence rather than assumptions.
Colombia’s mobility sector is shaped by urban travel demand, digital connectivity, local transport conditions, and competition between app-based services and traditional transport. The country’s Ministry of Information and Communications Technologies reported more than 48 million mobile internet accesses in the third quarter of 2024, providing important context for businesses evaluating app-based service accessibility. However, mobile internet connections are not equivalent to unique ride-hailing customers. Source: Colombia’s MinTIC.
For Actowiz Solutions, the objective is to help businesses structure relevant, authorized data into a consistent analytical resource. Data Intelligence Services can support research into city-level pricing, visible service availability, competitor offerings, and market changes. The resulting insights can inform expansion priorities, pricing reviews, and operational planning, provided that the underlying data is sufficiently representative and its limitations are clearly documented.
A critical starting point is to distinguish ride-hailing-specific statistics from broader transport indicators. Colombia’s national statistics agency, DANE, publishes urban passenger transport data covering vehicle fleets, journeys, kilometres travelled, passengers transported, and fares across selected cities. Its urban transport survey excludes taxi services, so it cannot independently measure the entire ride-hailing market. Source: DANE’s urban passenger transport statistics.
Which data points help identify the strongest expansion opportunities?
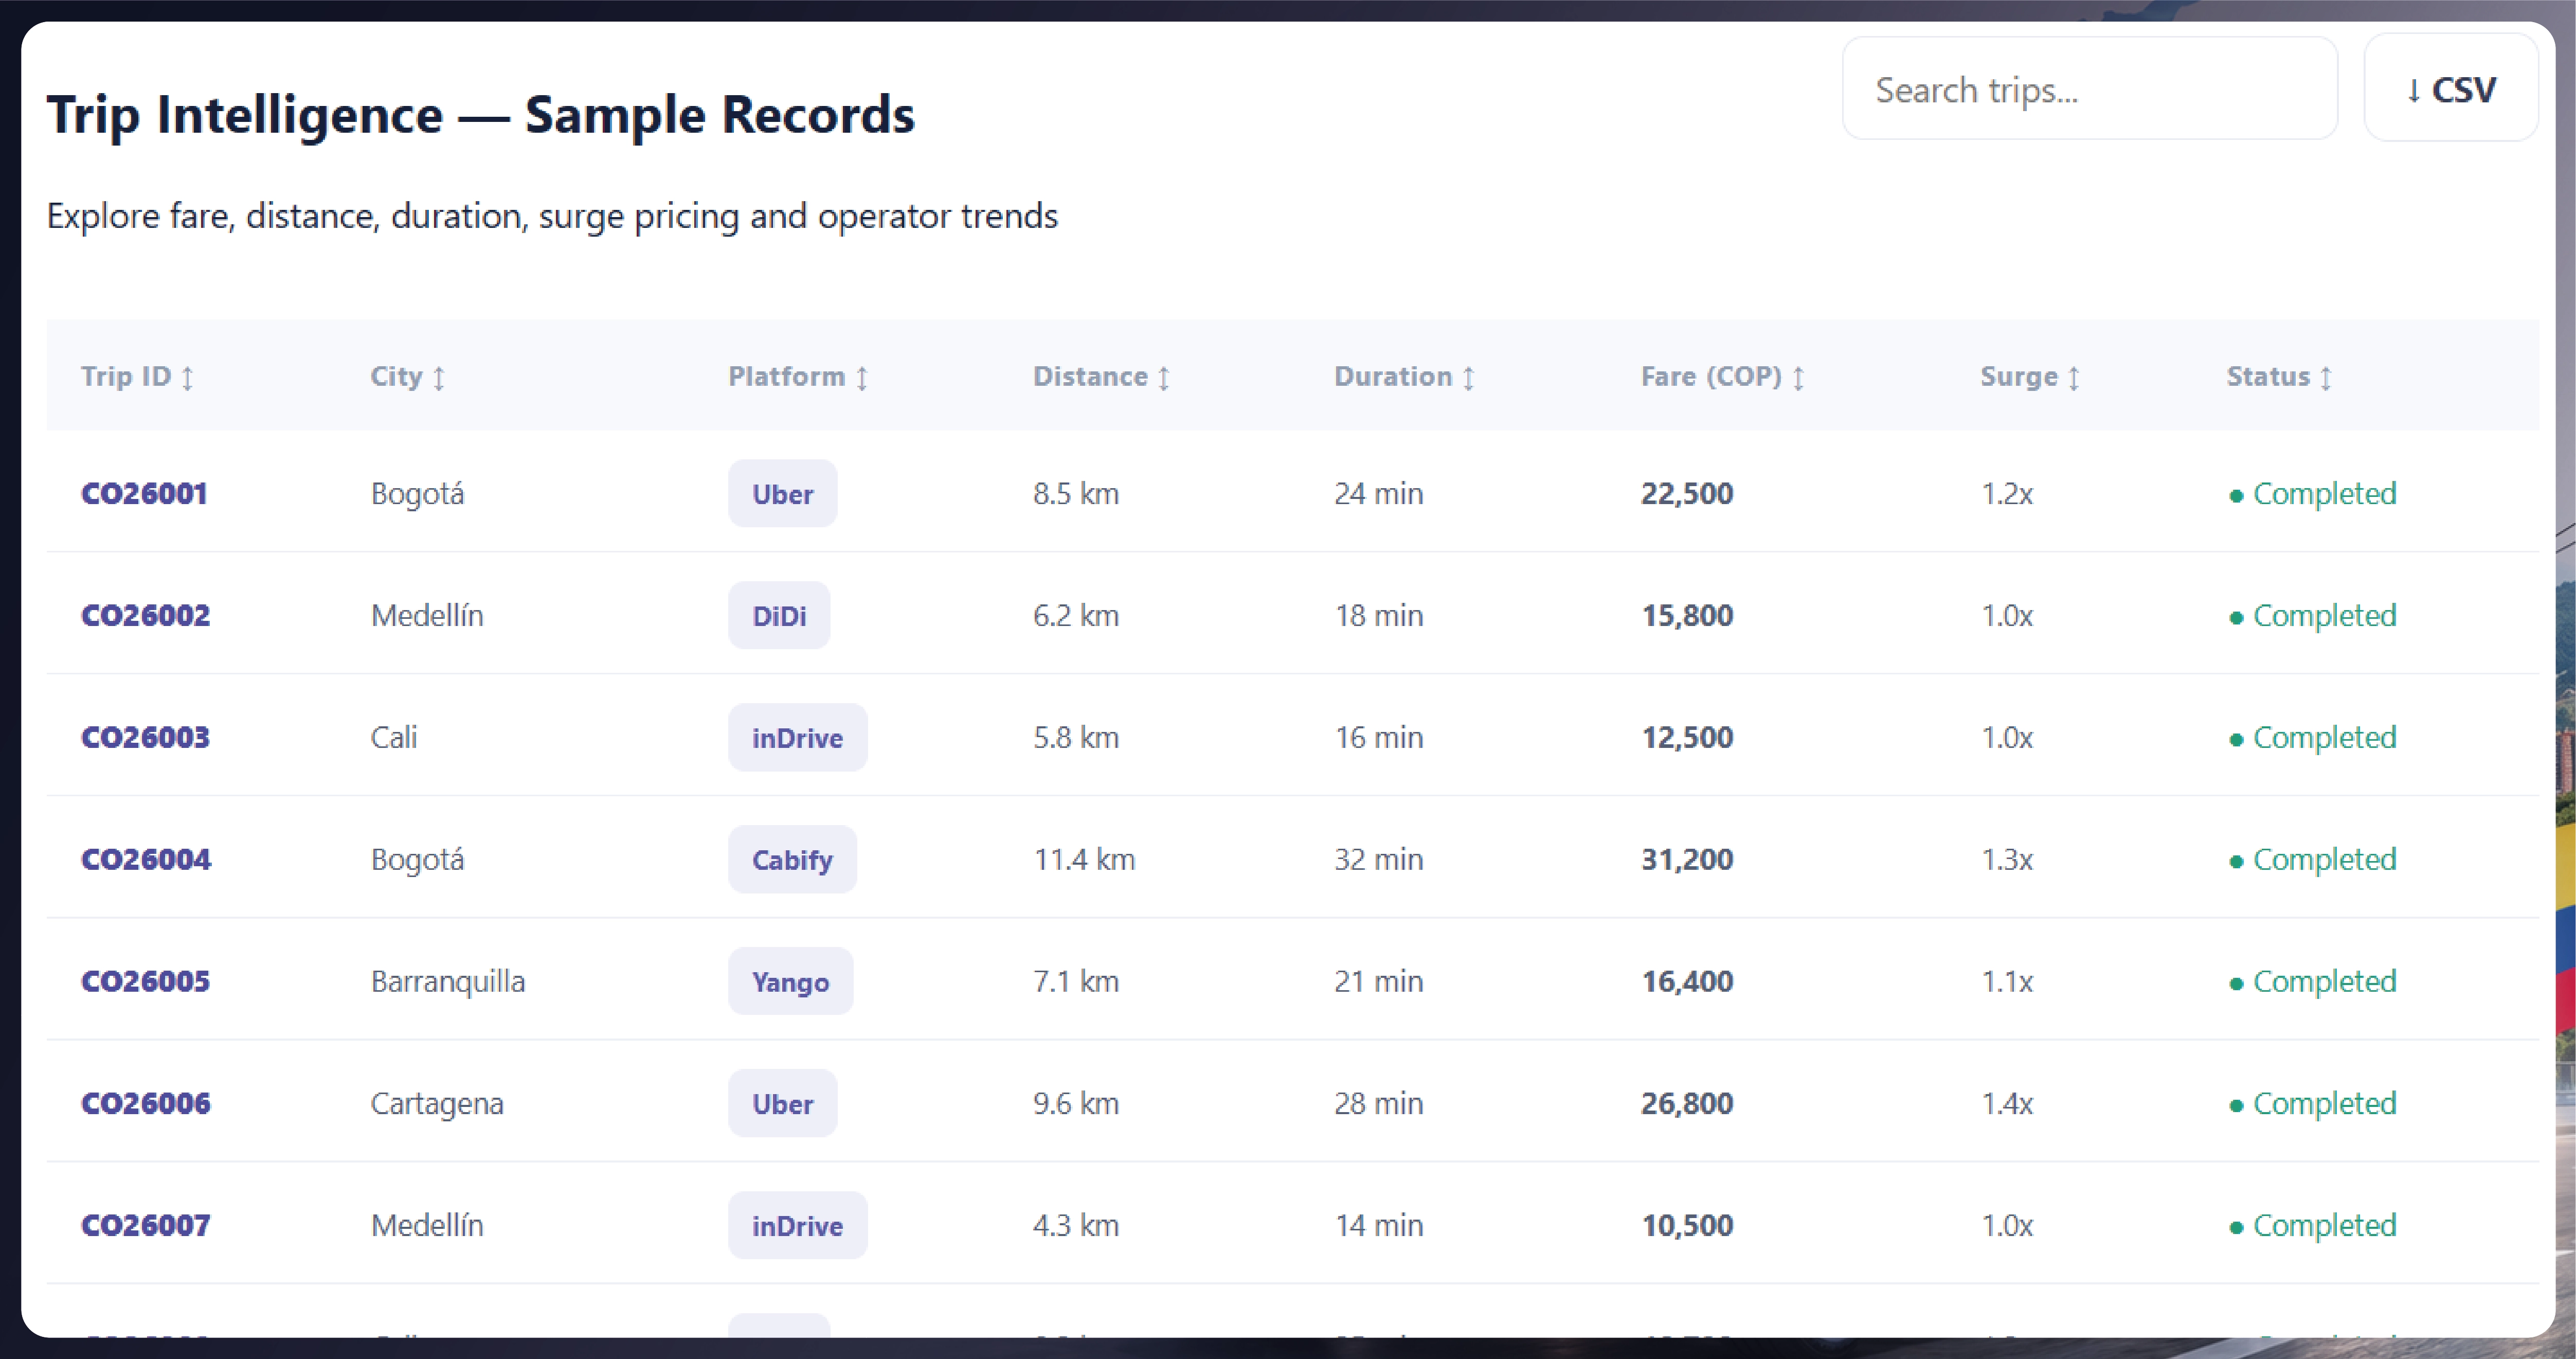
Colombia ride-hailing data Scraping can support market research when it uses authorized sources and focuses on clearly defined indicators. Businesses assessing a new city need more than a general estimate of market growth. They need comparable observations about displayed fares, estimated journey times, service coverage, ride options, and competitor presence. These indicators help identify where further investigation may be worthwhile, although app-visible information alone cannot prove demand, profitability, or market share.
The Colombia Ride-Hailing Market Data 2026 approach should combine platform observations with official population, connectivity, and transport statistics. DANE’s urban passenger transport survey provides historical quarterly data for selected cities and excludes taxi services. This distinction matters: official public-transport statistics can help describe the wider mobility environment, but they should not be presented as ride-hailing trip counts.
| Period |
Verifiable indicator |
How businesses can use it |
| 2020 |
DANE publishes historical urban passenger transport statistics for this year. |
Establish a pre- or early-pandemic baseline for covered transport modes. |
| 2021 |
DANE continues its quarterly urban passenger transport series. |
Examine recovery patterns in the transport modes included in the survey. |
| 2022 |
Historical quarterly transport statistics remain available. |
Compare city-level indicators with earlier periods. |
| 2023 |
DANE publishes quarterly urban transport results. |
Assess changes in the wider mobility environment. |
| 2024 |
DANE data and national connectivity statistics provide current contextual indicators. |
Compare transport trends with digital accessibility. |
| 2025 |
Transport-sector historical reporting is available through official sources. |
Extend the baseline while checking definitions and coverage. |
| 2026 |
DANE lists quarterly results, including the first and second quarters. |
Use the available period rather than assuming full-year results. |
Source: DANE, Urban Passenger Transport Survey—historical results.
For expansion planning, businesses should compare locations using the same definitions and observation periods. Useful questions include whether fares differ at comparable times, whether certain journey types are consistently available, and whether competitor services appear across the areas being evaluated. Population, tourism, employment patterns, and public transport can provide additional context, but each indicator should be sourced independently.
The most actionable output is a city-screening report that separates verified statistics, observed platform information, and unanswered questions. That structure helps decision-makers prioritize validation before investing in new operations.
How can businesses compare prices across cities and time periods?
Real-time ride-hailing price monitoring across Colombian cities helps businesses understand how displayed fares vary by route, time, service type, and booking conditions. For mobility platforms and market researchers, the central challenge is making valid comparisons. A fare displayed for a short urban trip during off-peak hours cannot be compared fairly with a longer journey requested during high demand without accounting for those differences.
A structured monitoring process should record the observation timestamp, origin and destination area, quoted fare, currency, ride category, estimated pickup time, estimated journey duration, and any visible fees. Where an app presents a range instead of a fixed quote, the dataset should preserve that distinction. A quoted fare is an observation at a particular moment, not proof of the amount ultimately paid.
Colombia’s digital infrastructure is an important part of the context. MinTIC reported that mobile internet access reached more than 48 million connections in the third quarter of 2024. It also reported 90.5 million mobile telephone lines in that quarter. These are connections and lines, not counts of unique people or ride-hailing users. Source: MinTIC’s third-quarter 2024 connectivity report.
| Monitoring dimension |
What to record |
Why it matters |
| Price |
Displayed quote and currency |
Enables comparable fare observations |
| Route |
Origin and destination areas |
Prevents unlike journeys from being compared |
| Time |
Date, time, and time zone |
Identifies time-dependent fare changes |
| Service |
Ride category displayed by the platform |
Separates different service options |
| Pickup |
Estimated wait, where shown |
Adds context to the price comparison |
| Quote conditions |
Visible fees, surcharges, or limitations |
Reduces misleading comparisons |
| Source |
Platform, permitted access method, and timestamp |
Supports auditability and validation |
A useful report should calculate changes only between comparable observations. For example, analysts can compare repeated quotes for the same route, service category, and time window. If the route or conditions change, the record should be flagged rather than treated as a clean price movement.
This method helps business development teams assess pricing positions and identify questions requiring deeper research. It does not establish a competitor’s internal pricing algorithm, driver earnings, or trip profitability. Those conclusions require additional evidence beyond displayed quotes.
What does fare analysis reveal about competitive positioning?
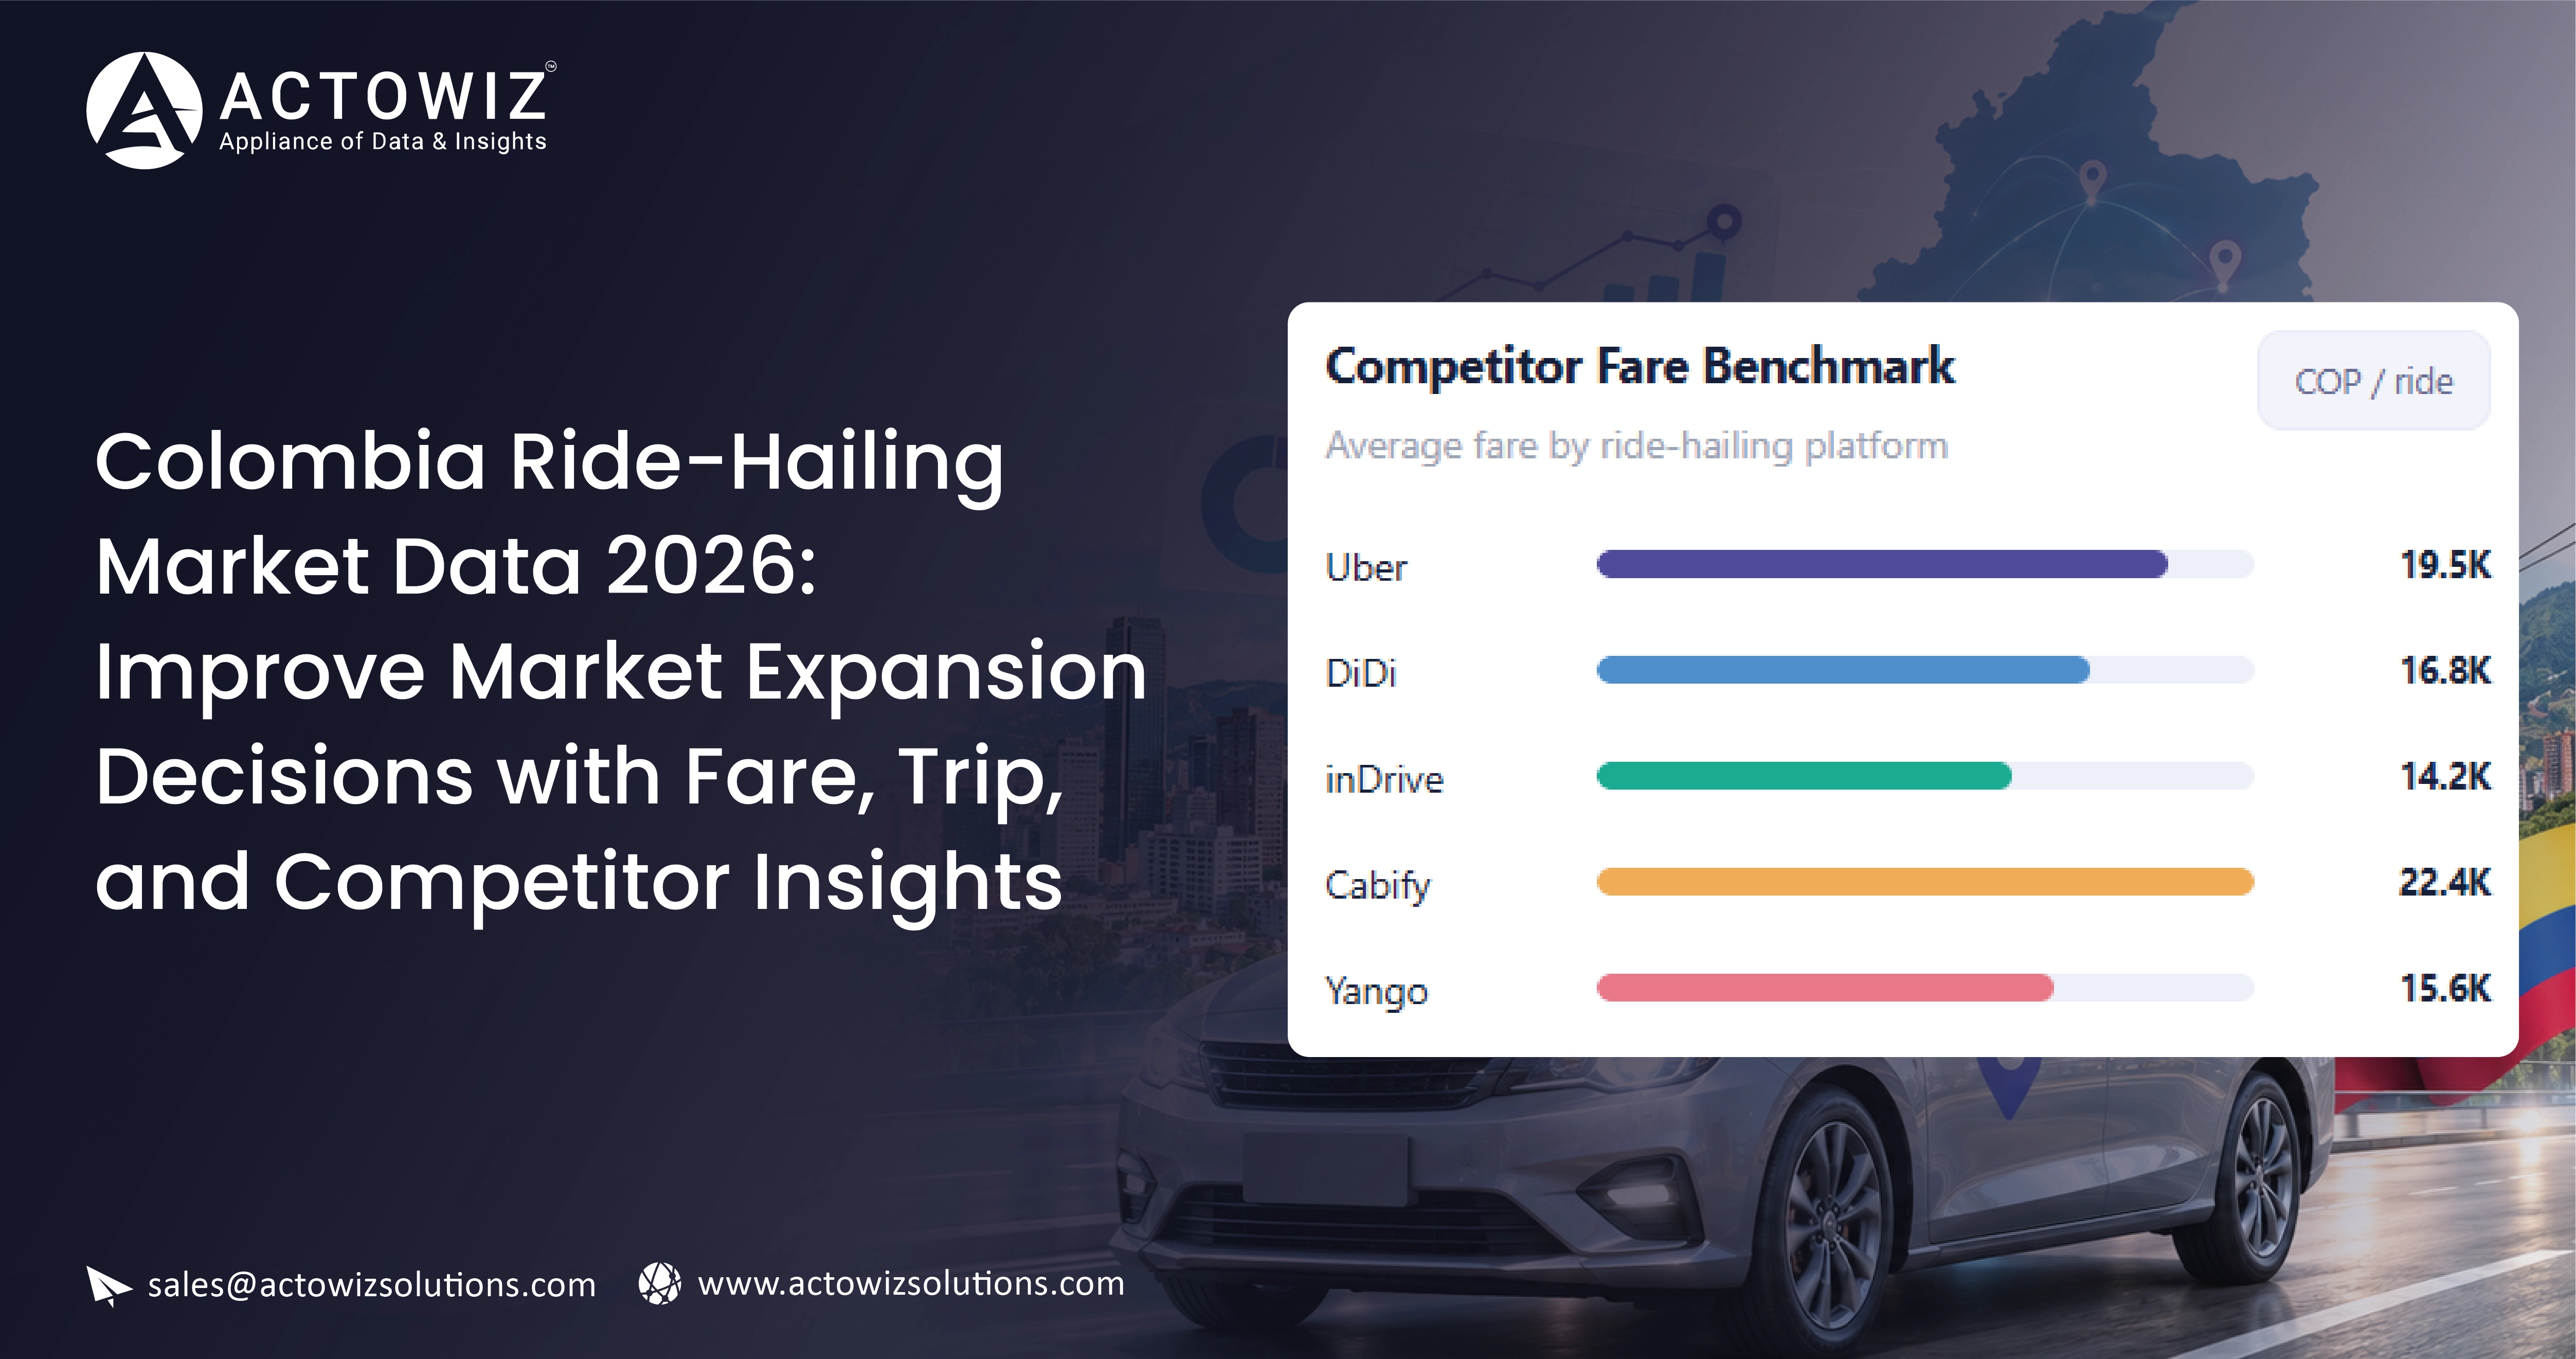
Colombia ride-hailing fare Data intelligence can help mobility businesses understand how prices differ across service types, routes, and competing platforms. Its value comes from consistent measurement rather than simply collecting large numbers of fare quotes. When the same journey is observed under comparable conditions, analysts can study differences in displayed prices and determine whether those differences persist across multiple observations.
The market context matters because Colombia’s transport ecosystem includes public transport, taxis, private vehicles, and app-based mobility services. DANE’s urban passenger transport survey provides a useful official reference for selected public transport modes, but the agency explicitly excludes taxi services from this survey. Ride-hailing fares therefore need to be collected or obtained from a separate authorized source. Source: DANE’s survey methodology and historical data.
| Year |
Official context available |
Fare-analysis recommendation |
| 2020 |
DANE historical urban transport data available |
Record the limitations of pandemic-era comparisons. |
| 2021 |
Quarterly public transport observations available |
Compare only matching transport measures and periods. |
| 2022 |
Historical observations available |
Build consistent route and service definitions. |
| 2023 |
Quarterly transport data available |
Compare observed fares with broader transport context. |
| 2024 |
Transport and connectivity reports available |
Evaluate digital accessibility alongside fare observations. |
| 2025 |
Official transport statistics available |
Extend time series using the same collection methodology. |
| 2026 |
First- and second-quarter DANE releases listed |
Clearly label partial-year observations. |
Source: DANE’s historical transport data.
A practical fare-analysis workflow should account for at least four factors:
- Route comparability: Compare the same origin and destination or clearly defined equivalent routes.
- Time sensitivity: Keep weekday, weekend, peak, and off-peak observations separate.
- Service differences: Compare similar ride categories instead of mixing different vehicle or service options.
- Data completeness: Preserve unavailable quotes and collection errors rather than silently excluding them.
Teams can then evaluate median observed fares, changes over time, and price differences between comparable services. The median can be useful when occasional extreme quotes would distort an average, but neither measure should be described as the market-wide average without representative sampling.
For expansion decisions, fare intelligence is most useful when interpreted alongside wait times, service coverage, and available demand indicators. A lower displayed price alone does not establish stronger competitiveness: reliability, pickup availability, journey duration, and service conditions can also affect customer choice. Businesses should use fare analysis to identify competitive patterns and research priorities, not to infer unobserved customer behaviour.
How can a centralized dashboard improve market decisions?
A Colombia mobility market intelligence Data dashboard can bring together authorized fare observations, route comparisons, competitor information, and official transport indicators in one reporting environment. Instead of reviewing separate spreadsheets, analysts can filter observations by city, date, service category, and route. This makes it easier to find gaps, investigate changes, and communicate findings to commercial and operational teams.
The dashboard should clearly separate three types of information: official statistics, platform-observed information, and calculated metrics. Official statistics may describe transport activity or connectivity at a national or city level. Platform observations may capture a fare or estimated pickup time displayed during a particular session. Calculated metrics may show changes between observations. Keeping these categories separate helps prevent a single platform quote from being misrepresented as a market-wide statistic.
DANE provides historical urban transport data, while MinTIC publishes telecommunications indicators. These sources can help establish context, but neither is a substitute for a representative ride-hailing dataset. DANE transport statistics and MinTIC connectivity statistics offer complementary measures with different definitions and coverage.
| Dashboard component |
Suggested indicator |
Decision supported |
| Fare trends |
Median observed quote for comparable routes |
Pricing review |
| Route coverage |
Routes and areas with valid observations |
Market screening |
| Pickup estimates |
Displayed wait time where available |
Service comparison |
| Competitor overview |
Observed services and ride categories |
Positioning research |
| Data quality |
Missing records and collection success rates |
Confidence in reporting |
| Historical changes |
Difference between comparable observations |
Trend investigation |
| Official context |
DANE transport and MinTIC connectivity indicators |
Broader market interpretation |
For reliable reporting, each record should retain a timestamp, source, observation conditions, and collection status. A dashboard should also flag incomplete data and show the reporting period prominently. If observations cover only a few routes or hours, the interface should not imply full-city or full-market coverage.
Business teams can use this framework to compare candidate markets, prioritize further field research, and identify areas where more data is needed. The dashboard supports decisions; it does not automatically establish demand, profitability, or market share without the corresponding evidence.
Why should businesses compare multiple platforms using consistent methods?
A Multi-platform ride-hailing pricing dataset for Colombia can help businesses compare displayed fares and service information across participating platforms, provided that the collection method and intended use are authorized. The key benefit is consistency: without standardized routes, observation times, ride categories, and fee treatment, a platform comparison can reflect differences in the test conditions rather than genuine differences between services.
For a useful comparison, analysts should define a common set of routes and collect observations within comparable time windows. Records should retain the platform name, timestamp, displayed fare, ride category, estimated pickup time, estimated journey duration, and any visible restrictions. When a platform does not return a quote, the dataset should record the outcome rather than assume the service is unavailable across the entire city.
| Year |
Context for multi-platform research |
Recommended treatment |
| 2020 |
DANE’s historical transport series covers the period. |
Preserve pandemic-era conditions as a separate context. |
| 2021 |
Official quarterly urban transport observations are available. |
Compare only equivalent measures. |
| 2022 |
Historical transport reporting continues. |
Standardize route and service definitions. |
| 2023 |
Official transport indicators can support contextual analysis. |
Maintain separate fields for official and platform data. |
| 2024 |
MinTIC reports more than 48 million mobile internet accesses in Q3. |
Use connectivity as context, not as a ride-hailing user count. |
| 2025 |
Official transport-sector statistics are available. |
Extend comparable observations with documented methodology. |
| 2026 |
DANE lists Q1 and Q2 releases for urban transport. |
Label partial-year data and avoid unsupported annual estimates. |
Sources: DANE historical transport statistics and MinTIC’s Q3 2024 report.
Multi-platform research should also account for differences in what each service displays. Some quotes may include particular fees or promotional adjustments, while others may show a fare range or different service conditions. Analysts should document these differences and avoid ranking platforms using unmatched observations.
For market expansion, the resulting comparison can highlight where prices differ consistently, which routes need more observations, and where a service appears in the sampled data. It cannot prove total platform availability, market share, or customer preference unless supported by additional representative data.
A strong dataset therefore includes both results and limitations. It identifies what was observed, when it was observed, how comparable the records are, and what further evidence is required before making a commercial decision.
How can market analysis turn raw observations into expansion priorities?
Colombia ride-hailing market Data analysis should connect observed marketplace conditions with clearly defined business decisions. A collection of fare quotes is only the starting point. Analysts need to validate records, standardize routes, distinguish ride categories, and examine changes across comparable time periods before drawing conclusions about competitive positioning.
For example, a business evaluating Bogotá, Medellín, or Cali should not assume that a few low fare quotes indicate a profitable market. It should assess the quality and coverage of its observations, review available transport context, and identify the additional demand or operating-cost data required. City-level expansion decisions may depend on several factors that are not visible in a consumer-facing app, including driver supply, insurance, local operating requirements, incentives, and actual trip economics.
Official data can help establish context. DANE’s transport series reports selected urban public transport indicators, while MinTIC’s telecommunications reporting describes internet access and mobile connectivity. These datasets use different definitions and should not be combined as if they measure the same population or activity. DANE transport data; MinTIC telecommunications report.
| Period |
Available evidence |
How to interpret it |
| 2020 |
Historical official transport series |
Baseline with pandemic-related limitations |
| 2021 |
Quarterly transport observations |
Recovery context for covered modes |
| 2022 |
Historical transport reporting |
Compare equivalent indicators |
| 2023 |
Official transport data |
Identify wider mobility patterns |
| 2024 |
Transport and connectivity indicators |
Review digital access and mobility context |
| 2025 |
Official historical statistics |
Extend the baseline where comparable data exists |
| 2026 |
First- and second-quarter releases listed by DANE |
Use partial-year data with explicit labels |
Source: DANE’s historical urban passenger transport survey.
A useful analysis process has five stages:
- Define the decision. Specify whether the research concerns city entry, fare positioning, service coverage, or competitor benchmarking.
- Collect comparable observations. Set consistent routes, time windows, service categories, and authorized source methods.
- Validate the records. Review missing quotes, duplicates, inconsistent conditions, and unusual changes.
- Add contextual indicators. Use official statistics and appropriately sourced operating data without mixing incompatible measures.
- Translate findings into priorities. Identify the strongest evidence, unresolved questions, and next steps for commercial or operational validation.
The final report should distinguish findings from hypotheses. It can show that sampled fares differ across specified routes or that observed pickup estimates vary by time. It should not claim that a city has stronger demand or higher profitability unless those conclusions are supported by suitable demand and cost data.
How can Actowiz Solutions support mobility market research?
Actowiz Solutions can help businesses plan data collection, organize permitted mobility information, and prepare structured datasets for pricing research, competitor analysis, and expansion planning. The right solution depends on the required locations, platforms, fields, refresh frequency, and access permissions.
AI-Powered Scraping Services can be considered for suitable sources where automated collection is permitted. Before implementation, businesses should confirm the platform’s terms, applicable privacy requirements, and any contractual or legal restrictions. Where direct automated collection is not permitted, authorized APIs, licensed data providers, or other approved access methods should be considered.
A project built around Colombia Ride-Hailing Market Data 2026 can be scoped around the following deliverables:
- Fare observations: Timestamped quotes for defined routes and service categories.
- Competitor comparisons: Structured records of publicly displayed services and pricing, subject to authorized access.
- Location-level analysis: Coverage of agreed cities, zones, or routes.
- Historical records: Comparable observations that support trend analysis.
- Data validation: Checks for missing fields, duplicates, inconsistent routes, and incomplete collection periods.
- Business-ready reporting: Tables, dashboards, and summaries designed around the client’s decision-making needs.
The first step is to define the questions the data must answer. A company assessing a new city may prioritize route coverage and observed fares, while an established platform may need consistent competitor comparisons and historical pricing changes. Defining these requirements in advance helps avoid collecting large volumes of information that do not support a clear business objective.
Actowiz Solutions can work with businesses to establish a practical data specification, document coverage limitations, and determine which findings can be supported by the available evidence. This approach gives commercial, strategy, and operations teams a clearer basis for evaluating opportunities without overstating what the dataset can establish.
Conclusion
Reliable mobility research starts with comparable data, transparent methodology, and a clear understanding of what each indicator measures. For Colombian ride-hailing businesses, structured fare observations, route comparisons, and competitor information can support expansion screening and pricing research when interpreted alongside official transport and connectivity statistics.
A carefully designed Ride-Hailing Market Data project can help teams identify pricing differences, review observed service coverage, and prioritize additional research. The most valuable output is not simply a large dataset; it is a validated resource that connects evidence to specific business decisions.
Actowiz Solutions can help you plan a suitable data collection and analytics workflow based on your target cities, required fields, and authorized sources.
Explore Web scraping API options for supported and permitted data access, request Custom Datasets aligned with your research needs, and evaluate an instant data scraper workflow where appropriate and authorized.
Ready to make better-informed mobility market decisions? Contact Actowiz Solutions to discuss your data requirements and build a research approach aligned with your expansion goals.
You can also reach us for all your mobile app scraping, data collection, web scraping, and instant data scraper service requirements!
 Actowiz Solutions

 By industry
 Pricing & Promotions
 Brand & Intelligence
 Digital Shelf & Search
 Assortment
 For Retailers
 E-Commerce Dashboard
 Flipkart Insights (Live)
 Grocery Intelligence
.svg) Grocery Price (U.S.)
.svg) Quick Commerce (India)
 Food & Restaurant
 Fashion Intelligence
 Automotive
 Travel & Hospitality
 Real Estate
 Food Delivery Intelligence
 OTT & Streaming
 Fuel & EV Charging Price Tracker
 By Use Case
 Pricing Intelligence
 Digital Shelf Analytics
 MAP Monitoring
 Cross-Border Price Parity
 Share of Search
 Review Sentiment
 Kitchen Market Gaps
 Dynamic Pricing / AI Repricing
 Promotions & Deals Alerts
 B2B / POI & Lead Data
 AI Search Visibility Dashboard
 Baby Products on Quick Commerce
 Hotel & Flight Rate Parity
 By Region
 Flipkart Real-Time Insights
 Quick Commerce — Zepto · Blinkit
 Pincode Price Tracker
 GCC Q-Commerce — Talabat · Noon
 UK Grocery — Tesco, Sainsbury's, Asda
 AU Grocery — Coles & Woolworths
 Marketplace Scrapers
 Developer APIs
 Universal APIs
 Delivery & SDKs
 Knowledge Center
 Guides & Playbooks
 Downloads & Tools
 Trust & Company


 4.8/5 Average Rating
 50+ Video Testimonials
 92% Client Retention
 50+ Countries Served