India Grocery Price Comparison for Sugar, Dal & Rice helps FMCG brands, retailers, distributors, and market researchers compare staple-grocery prices across digital channels such as Swiggy Instamart, Blinkit, and Zepto. It identifies price gaps, promotions, SKU differences, and market movements so teams can make faster pricing decisions.
India's digital grocery environment is expanding rapidly. NIQ reported in 2026 that e-commerce accounted for 7% of FMCG sales nationally, while its share reached 18% across India's top eight metros in OND 2025. Quick commerce contributed more than three-fourths of e-commerce FMCG sales in that period.
This matters particularly for staple categories such as sugar, dal, and rice because consumers frequently compare prices, pack sizes, brands, and promotional offers before purchasing. A product priced competitively on one platform can simultaneously appear more expensive on another.
For pricing teams, manually checking these differences is difficult to scale. A structured data pipeline can continuously capture product-level information, normalize comparable SKUs, preserve historical observations, and feed an actionable Grocery Price Dashboard.
The core question is simple: How can brands know whether their grocery pricing remains competitive across India's fast-changing digital retail ecosystem? The answer is consistent, SKU-level, cross-platform price intelligence.
Sugar, pulses, and rice are high-frequency grocery categories where small price differences can become commercially significant when multiplied across large order volumes.
The comparison problem is more complex than simply checking the displayed price. A useful monitoring system must consider:
India's official Consumer Price Index framework separately tracks categories including cereals and products, pulses and products, and sugar and confectionery. This highlights the importance of treating these products as distinct pricing categories rather than combining them into a single grocery benchmark.
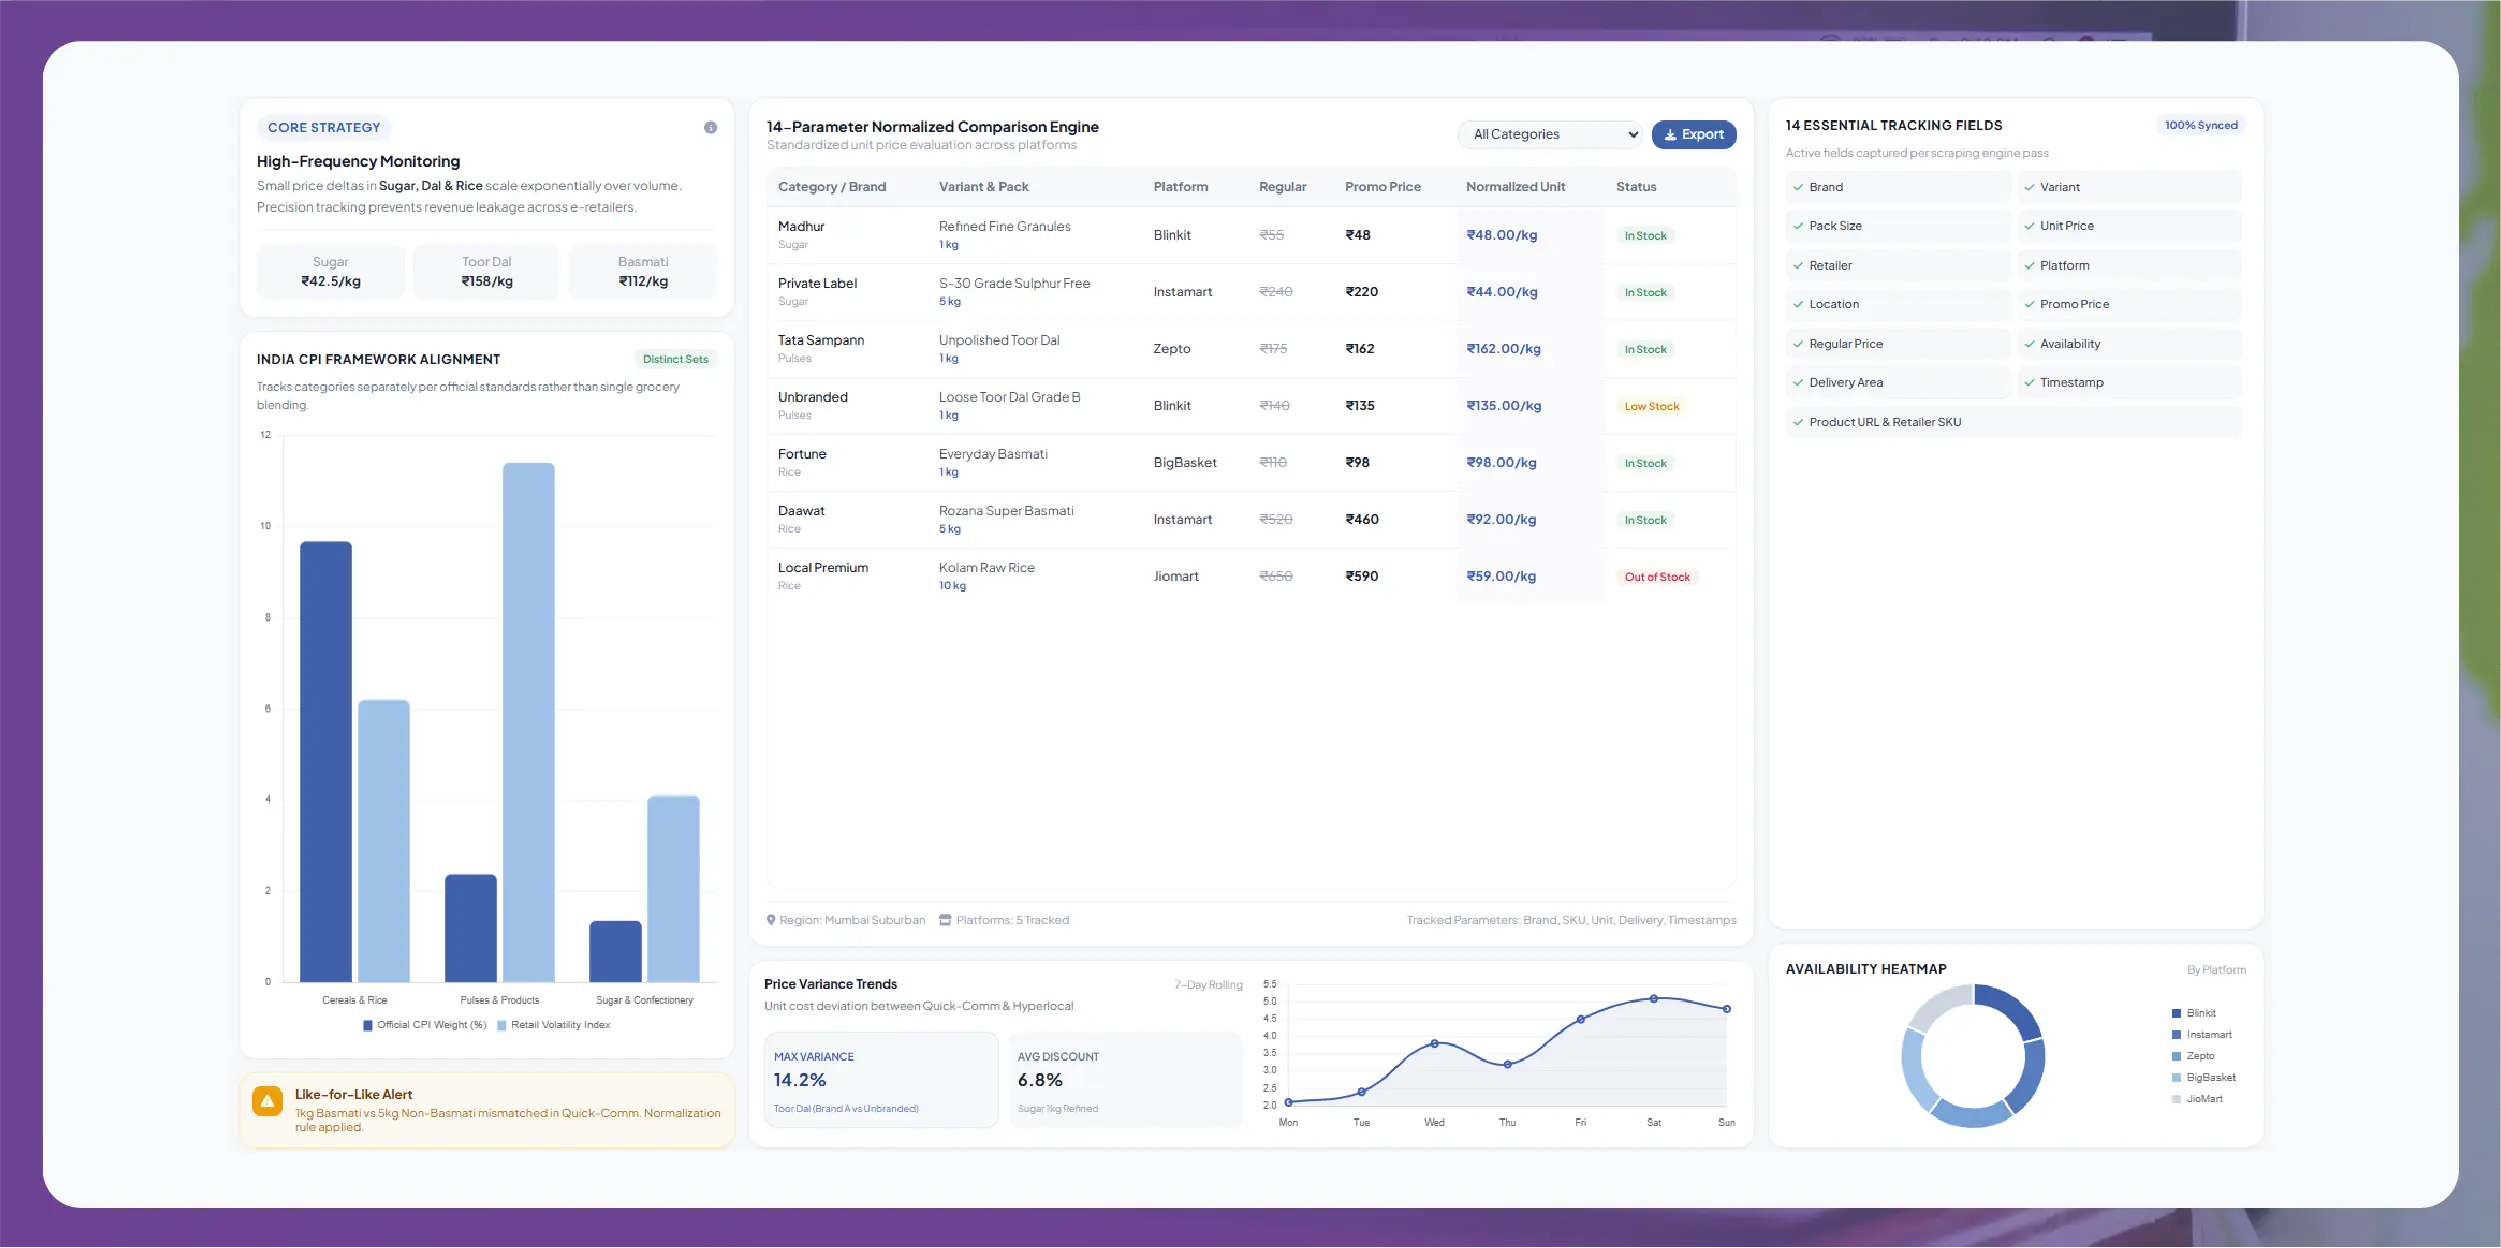
For FMCG brands, the biggest challenge is often like-for-like comparison. A 1 kg basmati rice SKU should not be benchmarked directly against a 5 kg non-basmati rice product. Likewise, branded toor dal and unbranded pulses may serve different consumer segments.
A reliable comparison therefore starts with product normalization.
India Grocery Price Data Scraping Across Platforms provides the structured input required to compare grocery prices across digital retail channels. Real-Time Price Monitoring then allows businesses to identify important movements without waiting for periodic manual research.
A typical collection framework can capture:
| Data Field | Purpose |
|---|---|
| Platform | Identifies sales channel |
| Retailer | Identifies seller/store |
| Product name | Product matching |
| Brand | Brand benchmarking |
| Category | Grocery classification |
| SKU/ID | Product identification |
| Pack size | Like-for-like comparison |
| Regular price | Baseline pricing |
| Sale price | Promotion tracking |
| Discount | Promotional analysis |
| Availability | Stock monitoring |
| Location | Regional comparison |
| Product URL | Verification |
| Timestamp | Historical analysis |
The system can then normalize the data into a common structure.
For example, if the same 1 kg sugar SKU appears on three platforms, the dataset can associate the three observations with one canonical product record. This makes the resulting comparison much more useful than simply storing three independent web pages.
The shift has been substantial.
In 2020, digital grocery adoption accelerated as consumers increasingly relied on online channels. By 2025, India's quick-commerce market had become a major part of digital grocery. IBEF reports that India's quick-commerce segment reached approximately US$7–8 billion in FY25, with the segment expanding rapidly between 2021 and 2025.
NIQ's 2026 research further shows that e-commerce accounted for 7% of FMCG sales nationally, demonstrating that online channels now represent a meaningful portion of the FMCG market.
| Period | Key Development | Pricing Impact |
|---|---|---|
| 2020 | Digital grocery adoption accelerated | Online price visibility became important |
| 2021 | Online shopping habits strengthened | More products required monitoring |
| 2022 | Quick commerce expanded | Faster price changes became visible |
| 2023 | Multi-platform grocery competition intensified | Cross-platform comparison became valuable |
| 2024 | Digital grocery matured | SKU-level monitoring became more practical |
| 2025 | Quick commerce became a major e-grocery channel | Frequent price monitoring gained importance |
| 2026 | E-commerce reached 7% of FMCG sales nationally | Structured pricing intelligence became strategic |
Market figures are sourced from published industry research; the pricing implications are Actowiz Solutions analysis.
Extract India Grocery Sugar & Dal & Rice Pricing Data enables businesses to create a focused dataset around India's most frequently purchased staple categories.
The objective should not be to collect every grocery product immediately. A better approach is to create a defined monitoring universe.
For example:
The dataset can then compare equivalent pack sizes and variants.
| Category | Example SKU | Pack | Platform A | Platform B | Platform C |
|---|---|---|---|---|---|
| Sugar | Brand A Sugar | 1 kg | ₹52 | ₹49 | ₹51 |
| Toor Dal | Brand B Toor Dal | 1 kg | ₹145 | ₹139 | ₹149 |
| Rice | Brand C Basmati | 5 kg | ₹620 | ₹599 | ₹635 |
The critical insight is the price gap. If a SKU costs ₹49 on one platform and ₹52 on another, the absolute difference is ₹3. But if a brand tracks that difference over weeks, it can determine whether the gap is persistent, promotional, or temporary.
Pack-size normalization is essential for grocery benchmarking.
A retailer might sell:
Comparing absolute prices across those products would be misleading.
Instead, businesses can calculate a unit price:
This creates a more meaningful benchmark.
For rice and dal, normalization can also account for product type, brand, grade, and variant before calculating a comparison.
India FMCG pricing Data intelligence transforms raw observations into commercial signals. Data Intelligence Services can combine collection, normalization, validation, historical storage, and analytics into one workflow.
The repeated use of India Grocery Price Comparison for Sugar, Dal & Rice within the analytical model allows businesses to understand not just the current price but the relative position of each SKU across competing platforms.
A pricing intelligence framework can answer:
| Metric | Example Result | Business Interpretation |
|---|---|---|
| Market Average | ₹112 | Reference benchmark |
| Lowest Price | ₹105 | Competitive low |
| Highest Price | ₹119 | Premium/high position |
| Price Spread | ₹14 | Cross-platform gap |
| Brand Price Index | 96 | Below market benchmark |
| Promotional Discount | 8% | Active promotion |
| SKU Volatility | Medium | Requires monitoring |
This approach gives pricing managers a common language for evaluating competitive positions.
NIQ reported that India's FMCG sector grew 7.8% year over year in OND 2025, while e-commerce accounted for 18% of FMCG sales across the top eight metros.
NIQ's Q2 2026 report subsequently put e-commerce's national FMCG share at 7%. It also noted that pricing continued to influence performance across food and home/personal-care categories.
For FMCG brands, these numbers reinforce the need to understand channel-specific pricing rather than relying on one national average.
India FMCG Grocery Product Price Dataset should be designed around the questions that commercial teams need to answer.
A high-quality dataset can include:
| Dataset Layer | Recommended Fields |
|---|---|
| Product | Name, brand, category |
| SKU | Product ID, retailer SKU |
| Variant | Flavor/type/grade |
| Pack | Quantity and unit |
| Pricing | MRP, selling price |
| Promotion | Discount, offer |
| Retailer | Platform and store |
| Geography | City, PIN code/market |
| Availability | In stock/out of stock |
| Source | Product URL |
| Timing | Date and timestamp |
| Benchmark | Market average/median |
| Change | Price difference and % |
| Validation | Matching/quality status |
The dataset should also preserve the original observation before transformation. This creates an audit trail for validating unusual results.
For example, if a platform suddenly shows a ₹20 price for a product normally sold for ₹120, the system should flag the observation rather than automatically treating it as a genuine 83% price reduction.
The data requirements have expanded as digital grocery became more sophisticated.
In the early stages, a basic dataset might have contained product name and price. Modern pricing intelligence requires additional context such as location, stock, promotions, pack size, product ID, and timestamp.
NIQ's 2026 research shows that India's e-commerce channel now has measurable national FMCG significance, while quick commerce remains a major growth engine.
This means a modern grocery dataset must be designed for comparability and historical analysis, not simply collection.
Indian Grocery Pricing Analytics converts collected observations into trends, rankings, alerts, and competitive benchmarks.
For sugar, dal, and rice, analytics can calculate:
Price Gap = Platform A Price − Platform B Price
Percentage Difference = Price Gap ÷ Benchmark Price × 100
A dashboard can convert these calculations into actionable views.
| Dashboard View | What It Shows |
|---|---|
| Platform Comparison | Lowest/highest prices |
| SKU Tracker | Individual product movement |
| Category View | Sugar vs dal vs rice |
| Promotion Monitor | Active discounts |
| Geography View | City-level differences |
| Historical Trend | Price movement over time |
| Alert Center | Significant changes |
A category manager can identify products where the business consistently loses price competitiveness.
A brand manager can identify retailers that discount its products more aggressively than others.
A sales team can use the data to prepare retailer conversations.
An executive can monitor category-level trends without examining thousands of individual records.
The goal is to move from data collection to decision support.
FMCG SKU price tracking across multiple platforms provides the granularity required to monitor individual products rather than broad categories.
This is especially important in quick commerce because the same brand can appear differently across platforms and locations.
For each SKU, businesses can track:
A SKU-level alert might trigger when:
Current price is 7% below the 30-day average.
Or:
Three platforms change the same SKU within 12 hours.
Or:
A monitored SKU becomes unavailable on two platforms.
These rules make monitoring proactive.
India's quick-commerce market has moved from a convenience experiment to a major digital retail channel.
NIQ's 2026 commerce research says quick commerce was valued at around $3 billion in 2025 and that grocery drives the highest repeat buying in India's quick-commerce marketplace.
IBEF reports that quick commerce accounted for approximately 70–75% of e-grocery orders, compared with 35% in 2022.
The implication for brands is significant: monitoring only traditional e-commerce marketplaces may no longer provide a complete picture of online grocery pricing.
Price comparisons are not always nationally uniform.
A product can have different prices depending on:
This makes location-aware collection especially important for Blinkit, Zepto, and Swiggy Instamart.
For example, a 1 kg rice SKU may be available in Mumbai but unavailable in Ahmedabad. Another product may show a different price in Delhi because the platform serves the order from a different local inventory node.
A reliable comparison should therefore record where and when the price was observed.
This is also why historical datasets should preserve timestamps and geographic identifiers rather than storing only a product and price.
Actowiz Solutions develops customized data collection and market intelligence solutions for FMCG brands, retailers, distributors, and research teams.
Our Grocery Data Scraping solutions can be designed around specific categories, platforms, products, cities, and monitoring frequencies.
The objective is to create a reusable data architecture rather than a one-time extraction project.
The strongest systems combine breadth, accuracy, frequency, and context.
Breadth
Monitor the platforms and markets that actually influence the client's category.
Accuracy
Match equivalent products and normalize pack sizes before comparing prices.
Frequency
Collect often enough to detect meaningful changes without creating unnecessary noise.
Context
Capture promotions, availability, location, and timestamps alongside prices.
History
Preserve observations so current prices can be interpreted against previous periods.
Actionability
Convert data into benchmarks, alerts, rankings, and business recommendations.
This framework is particularly useful for FMCG organizations where a small price difference can become commercially significant across thousands of transactions.
India's grocery ecosystem has undergone a structural digital transformation.
In 2020, digital grocery became an important response to changing consumer behavior. Between 2021 and 2024, quick commerce expanded rapidly and introduced a faster purchasing model. By 2025, quick commerce had become a major component of online grocery, while e-commerce gained a measurable share of FMCG sales.
By 2026, the market is increasingly omnichannel.
NIQ reports that e-commerce represented 7% of FMCG sales nationally in Q2 2026. Its OND 2025 research showed e-commerce at 18% across India's top eight metros, with quick commerce contributing more than three-fourths of e-commerce FMCG sales.
At the same time, India's broader quick-commerce opportunity continues to expand. IBEF reports that India's online retail market reached approximately US$80 billion in FY26, while quick commerce remained one of its fastest-growing segments.
For FMCG brands, this creates a clear strategic requirement:
Price intelligence must follow the consumer across platforms.
Monitoring only one marketplace provides only one part of the picture.
India Grocery Price Comparison for Sugar, Dal & Rice gives FMCG brands and retailers a practical way to understand how staple products are positioned across digital channels.
The business value comes from more than finding the cheapest listing. A robust system connects product matching, pack-size normalization, price collection, promotional tracking, location, availability, historical records, and analytics.
That combination enables teams to answer commercially important questions:
As India's quick-commerce and e-commerce ecosystems continue to expand, cross-platform price visibility will become increasingly important for brands competing on everyday essentials.
Actowiz Solutions can help build a scalable data infrastructure that turns fragmented online grocery observations into structured, analytics-ready intelligence.
Ready to monitor grocery prices across India's leading digital platforms and turn price changes into actionable competitive insights? Contact Actowiz Solutions to build a customized grocery price intelligence solution for your brand!
You can also reach us for all your mobile app scraping, data collection, web scraping , and instant data scraper service requirements!
Our web scraping expertise is relied on by 4,000+ global enterprises including Zomato, Tata Consumer, Subway, and Expedia — helping them turn web data into growth.
Watch how businesses like yours are using Actowiz data to drive growth.
From Zomato to Expedia — see why global leaders trust us with their data.
Backed by automation, data volume, and enterprise-grade scale — we help businesses from startups to Fortune 500s extract competitive insights across the USA, UK, UAE, and beyond.
We partner with agencies, system integrators, and technology platforms to deliver end-to-end solutions across the retail and digital shelf ecosystem.
India Grocery Price Comparison for Sugar, Dal & Rice helps brands compare prices across BigBasket, Blinkit, Zepto, and JioMart for smarter pricing.
CarDekho Data API 2026 helps businesses track vehicle images, pricing, specs, and reviews for smarter automotive market and competitor analysis.
Taiwan & Japan marketplace price report compares Momo, Shopee TW, Rakuten, and Amazon JP for product prices, brands, deals, and trends.
Whether you're a startup or a Fortune 500 — we have the right plan for your data needs.