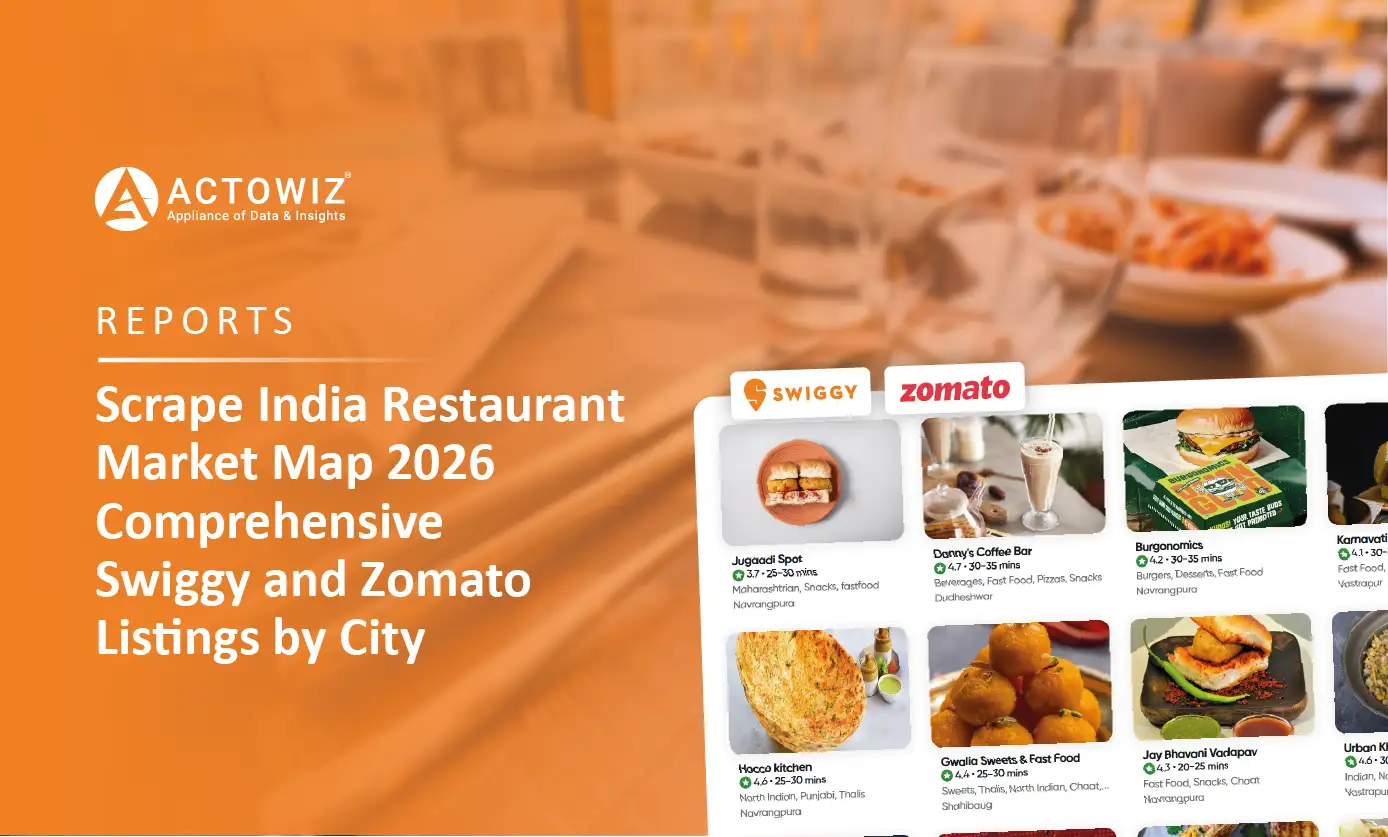
Scrape India Restaurant Market Map 2026: Swiggy & Zomato Restaurant Listings, Market Trends, City-Wise Data & Competitive Insights
India’s restaurant market is becoming increasingly digital, making city-level restaurant intelligence essential for brands, investors, aggregators, and market researchers. Scrape India Restaurant Market Map 2026 and Food Data Scraping Services can help businesses structure restaurant information across locations, cuisines, ratings, price bands, and platform presence for more systematic market analysis.
The Indian food-services industry was valued at approximately ₹5.69 lakh crore in FY2024, while newer 2026 estimates put the market at ₹7.95 lakh crore in FY2026. The online segment is also projected to increase its share of food services from 11% in FY2026 to 18% by FY2031. NRAI
For businesses evaluating restaurant expansion, competitive positioning, franchise opportunities, delivery-market coverage, or local demand, a structured city-wise dataset can turn fragmented platform information into actionable intelligence.
| Year | Market size / indicator | Source |
|---|---|---|
| 2020 | ₹4.23 lakh crore | NRAI / Business Standard Business Standard |
| 2021 | ₹2.00 lakh crore | NRAI / Business Standard Business Standard |
| 2022 | ₹4.96 lakh crore | NRAI data reproduced in industry reporting Business Standard |
| 2023 | ₹4.48 lakh crore | NRAI data reproduced in industry reporting Business Standard |
| 2024 | ₹5.69 lakh crore | NRAI India Food Services Report NRAI |
| 2025 | ₹6.96 lakh crore | Kearney-Swiggy / IBEF India Brand Equity Foundation |
| 2026 | ₹7.95 lakh crore | Redseer / IBEF India Brand Equity Foundation |
The sharp 2021 contraction reflects the pandemic, while subsequent figures show substantial recovery and expansion. For decision-makers, the key opportunity is no longer simply estimating the size of the restaurant industry; it is understanding where restaurants are located, what they offer, how consumers rate them, and how competitive each city has become.
Swiggy and Zomato restaurant data by city in India provides a foundation for mapping the digital restaurant ecosystem. A structured dataset can capture fields such as restaurant name, location, locality, cuisine, rating, review count, price range, platform availability, delivery information, and restaurant-category attributes where publicly available.
This matters because national market numbers do not reveal the differences between individual cities. Bengaluru, Delhi, Hyderabad, Mumbai, Pune, Ahmedabad, Jaipur, Lucknow, Chandigarh, and other markets can have substantially different restaurant ecosystems and consumer patterns.
Swiggy reported that its food-delivery service operated across 700+ Indian cities in FY2024-25. Its annual report also recorded 14.7 million monthly transacting food-delivery users and ₹28,783 crore in food-delivery GOV for FY2024-25. Swiggy
Swiggy's 2025 data also demonstrates the importance of emerging markets. Its Dineout activity identified Jaipur, Chandigarh, Kochi, Dehradun, Vadodara, and Mangalore among its top 20 cities using the service. Swiggy
| Metric | Period | Verified figure |
|---|---|---|
| Swiggy food-delivery cities | FY2025 | 700+ Swiggy |
| Swiggy food-delivery MTUs | FY2025 | 14.7 million Swiggy |
| Swiggy food-delivery GOV | FY2025 | ₹28,783 crore Swiggy |
| Swiggy Dineout monthly active restaurants | FY2025 | ~36,000 Swiggy |
| Zomato food-delivery monthly transacting customers | Q4 FY2025 | 20.9 million Zomato |
| Zomato food-delivery GOV | Q4 FY2025 | ₹9,778 crore Zomato |
For expansion teams, this information can support city prioritisation, competitor discovery, territory planning, and restaurant-density analysis. A continuously refreshed dataset can also identify new listings, removed listings, changing ratings, and shifts in cuisine or pricing.
A City-wise restaurant listing dataset for Indian markets, Scrape India Restaurant Market Map 2026 can move analysis from broad industry statistics toward granular competitive intelligence.
The value of such a dataset lies in standardisation. Restaurant information collected from publicly accessible sources can be organised into consistent fields and grouped by city, locality, cuisine, price category, rating, and platform. This allows analysts to compare markets using the same framework instead of manually reviewing individual listings.
India's broader food-service market provides the context for this analysis. NRAI's 2024 report estimated the industry at ₹5.69 lakh crore in FY2024 and projected ₹7.76 lakh crore by FY2028, representing an 8.1% CAGR. NRAI
| Fiscal year | Indian food-services market |
|---|---|
| FY2020 | ₹4.23 lakh crore Business Standard |
| FY2021 | ₹2.00 lakh crore Business Standard |
| FY2022 | ₹4.96 lakh crore Business Standard |
| FY2023 | ₹4.48 lakh crore Business Standard |
| FY2024 | ₹5.69 lakh crore NRAI |
| FY2025 | ₹6.96 lakh crore India Brand Equity Foundation |
| FY2026 | ₹7.95 lakh crore India Brand Equity Foundation |
These figures come from different industry studies and should not be treated as one perfectly comparable statistical series. They nevertheless demonstrate the scale and post-pandemic expansion of the sector.
For a restaurant brand, the practical application is straightforward: identify cities with relevant cuisine demand, benchmark competitors, compare price positioning, examine ratings, and locate underserved areas. Investors can use similar data to screen markets and assess competitive density before deeper due diligence.
Swiggy & Zomato restaurant competitive intelligence can help companies understand how restaurant businesses position themselves within India's increasingly digital food ecosystem.
Competitive analysis can examine observable attributes such as restaurant presence, cuisine categories, ratings, review volumes, pricing indicators, locality, delivery availability, and platform visibility. When collected consistently over time, these fields can support trend analysis rather than one-time competitor lists.
Swiggy's scale illustrates why platform intelligence has become important. Its FY2025 annual report recorded approximately 35.8 thousand monthly active restaurants for its Out-of-Home Consumption segment, compared with 26.6 thousand in FY2024 and 10.4 thousand in FY2023. Swiggy
| Fiscal year | Monthly active restaurants ('000) | Transactions (million) |
|---|---|---|
| FY2023 | 10.4 | 3.3 |
| FY2024 | 26.6 | 7.0 |
| FY2025 | 35.8 | 9.5 |
Source: Swiggy Annual Report FY2024-25. Swiggy
The competitive implications are significant. A growing restaurant ecosystem creates more alternatives for consumers while increasing the need for restaurants to differentiate through cuisine, pricing, service, location, ratings, promotions, and brand identity.
Swiggy's 2025 dining data further showed that seven million diners were seated through Dineout during the year, with Bengaluru, Delhi, and Hyderabad recording the highest numbers among the cities cited by the company. Swiggy
For restaurant groups, competitive intelligence can therefore support market-entry research, competitor benchmarking, location strategy, menu positioning, and acquisition screening. The data should complement—not replace—primary research and commercial due diligence.
Indian restaurant location & listing data scraping, Scrape India Restaurant Market Map 2026 can help convert restaurant discovery information into a geographic market layer.
Location is one of the most useful dimensions because restaurants compete within highly localised catchments. Two establishments in the same city may face completely different competitive conditions depending on locality, commercial density, residential concentration, office activity, tourist traffic, and access to delivery demand.
Public restaurant listings can potentially provide structured location fields such as city, neighbourhood, address, geographic coordinates where publicly exposed, cuisine, restaurant type, rating, price indicator, and platform presence. A dataset can then be grouped into city and locality clusters.
| Year | Unorganised market | Organised market | Total |
|---|---|---|---|
| FY2019 | ₹2,535 bn | ₹1,561 bn | ₹4,096 bn |
| FY2020 | ₹2,519 bn | ₹1,717 bn | ₹4,236 bn |
| FY2021 | ₹1,196 bn | ₹812 bn | ₹2,008 bn |
| FY2022 | ₹2,015 bn | ₹1,615 bn | ₹3,630 bn |
| FY2023 | ₹2,317 bn | ₹2,010 bn | ₹4,327 bn |
| FY2024 | ₹2,595 bn | ₹2,410 bn | ₹5,005 bn |
| FY2025E | ₹2,855 bn | ₹2,862 bn | ₹5,717 bn |
Source: Technopak analysis reproduced in Barbeque-Nation Hospitality's FY2024-25 reporting. Business Standard
The dataset and source methodology should be clearly documented because platform listings are dynamic and may contain duplicates, temporary closures, incomplete addresses, or changing availability.
For location strategy, businesses can use deduplicated listings to calculate restaurant density by locality, identify cuisine clusters, compare organised and independent competition, and shortlist potential expansion territories. The strongest workflow combines scraped public data with geographic analysis and validation.
A Restaurant ratings, cuisines and price range dataset by city enables more meaningful comparison than restaurant counts alone. A market containing 10,000 listings does not necessarily offer the same opportunity as another market with 5,000 listings. Cuisine mix, ratings, pricing, restaurant formats, and competitive concentration can materially change the interpretation.
India's consumer food-service market remains dominated by independent outlets. According to Euromonitor data cited by Agriculture and Agri-Food Canada, independent foodservice represented 90% of consumer foodservice value in 2024, while chained outlets accounted for 10%. Street stalls and kiosks represented 66.2% of value sales. Agriculture and Agri-Food Canada
| Category | 2024 value sales | Share |
|---|---|---|
| Consumer foodservice | US$57.47bn | 100% |
| Independent foodservice | US$51.73bn | 90.0% |
| Chained foodservice | US$5.73bn | 10.0% |
| Street stalls/kiosks | US$38.03bn | 66.2% |
| Full-service restaurants | US$9.44bn | 16.4% |
| Limited-service restaurants | US$5.49bn | 9.5% |
Source: Euromonitor International, cited by Agriculture and Agri-Food Canada. Agriculture and Agri-Food Canada
For analysts, ratings can indicate customer sentiment, review counts can provide a measure of engagement, cuisines reveal demand composition, and price bands provide positioning context. None of these fields should be interpreted independently.
A restaurant with a high rating but very few reviews should not automatically be ranked above a highly reviewed restaurant with a slightly lower score. Likewise, a cuisine with fewer listings may represent either an underserved niche or limited demand. Combining multiple variables produces stronger market intelligence.
Swiggy Data Scraping Services, Scrape India Restaurant Market Map 2026 can support businesses that need repeatable collection and structured analysis of publicly available restaurant information.
The commercial value comes from reducing manual research and creating datasets that can be refreshed according to business requirements. Depending on the permitted source and project scope, fields may include restaurant name, city, locality, cuisine, rating, review count, price indicator, address, restaurant category, and other publicly available attributes.
The wider market is moving toward greater digital adoption. RedSeer data reported by IBEF estimates that India's food-services market will rise from ₹7.95 lakh crore in FY2026 to ₹14.28 lakh crore by FY2031, while online food services' share is expected to increase from 11% to 18%. India Brand Equity Foundation
| Indicator | 2025 / FY2025 | 2026 / FY2026 |
|---|---|---|
| Food-services market | ₹6.96 lakh crore | ₹7.95 lakh crore |
| Online share | — | 11% |
| Organised market share | 45–50% | — |
| Projected FY2031 market | — | ₹14.28 lakh crore |
Sources: Kearney-Swiggy/IBEF and RedSeer/IBEF. India Brand Equity Foundation
An automated workflow can include source discovery, extraction, cleaning, deduplication, normalisation, validation, storage, and scheduled refreshes. For decision-makers, the output can become a reusable market database rather than a one-off spreadsheet.
Importantly, responsible data collection should respect applicable laws, platform terms, access controls, robots directives where applicable, and privacy requirements. The objective should be structured business intelligence from legitimately accessible information—not bypassing technical restrictions or collecting sensitive personal information.
Zomato Data Scraping can be part of a broader restaurant intelligence workflow when businesses require structured information from publicly accessible online sources.
Zomato Data Scraping can be part of a broader restaurant intelligence workflow when businesses require structured information from publicly accessible online sources. Actowiz Solutions can position the service around data quality, structured delivery, repeatable workflows, and business-specific schemas rather than simply providing raw extraction.
Scrape India Restaurant Market Map 2026 projects a practical use case: converting fragmented restaurant discovery information into a structured research asset for city expansion, competitor monitoring, market sizing, and food-sector intelligence.
A strong data project should define the required fields before collection begins. For restaurant research, this can include:
The methodology is particularly important because restaurant listings change frequently. Restaurants open and close, menus change, ratings move, and platform availability can vary by location and time.
Actowiz Solutions can therefore focus on delivering structured, validated, deduplicated, and analysis-ready datasets rather than unprocessed records.
India's restaurant sector has moved from pandemic disruption into a period of significant digital and market expansion. Industry estimates show the food-services market reaching ₹7.95 lakh crore in FY2026, while online food services are expected to become an increasingly important component of the overall ecosystem. India Brand Equity Foundation
For brands, investors, restaurant groups, consultants, and market researchers, the strategic question is increasingly where the opportunity exists and what the competitive landscape looks like at city and locality level.
AI-Powered Scraping Services can help transform publicly accessible restaurant information into structured datasets designed for market intelligence, competitor research, location analysis, and ongoing monitoring.
Businesses looking to build a scalable restaurant intelligence database can combine city-level listings, cuisine information, ratings, pricing indicators, and competitive signals with Web Crawling service and Web Data Mining to create one structured research framework.
Ready to map India's restaurant landscape? Contact Actowiz Solutions to discuss your restaurant data requirements and build a structured, analysis-ready market intelligence dataset powered by reliable Web Crawling service and Web Data Mining solutions.
Our web scraping expertise is relied on by 4,000+ global enterprises including Zomato, Tata Consumer, Subway, and Expedia — helping them turn web data into growth.
Watch how businesses like yours are using Actowiz data to drive growth.
From Zomato to Expedia — see why global leaders trust us with their data.
Backed by automation, data volume, and enterprise-grade scale — we help businesses from startups to Fortune 500s extract competitive insights across the USA, UK, UAE, and beyond.
We partner with agencies, system integrators, and technology platforms to deliver end-to-end solutions across the retail and digital shelf ecosystem.
Google SERP Data Collection 2026 helps businesses track rankings, competitors, keywords, and local search trends with geographically targeted search intelligence.
Simplify product data management with a Product database & storage API for organized storage, efficient access, and scalable business operations.
Scrape India Restaurant Market Map 2026: Swiggy & Zomato Restaurant Listings, Market Trends, City-Wise Data & Competitive Insights
Whether you're a startup or a Fortune 500 — we have the right plan for your data needs.