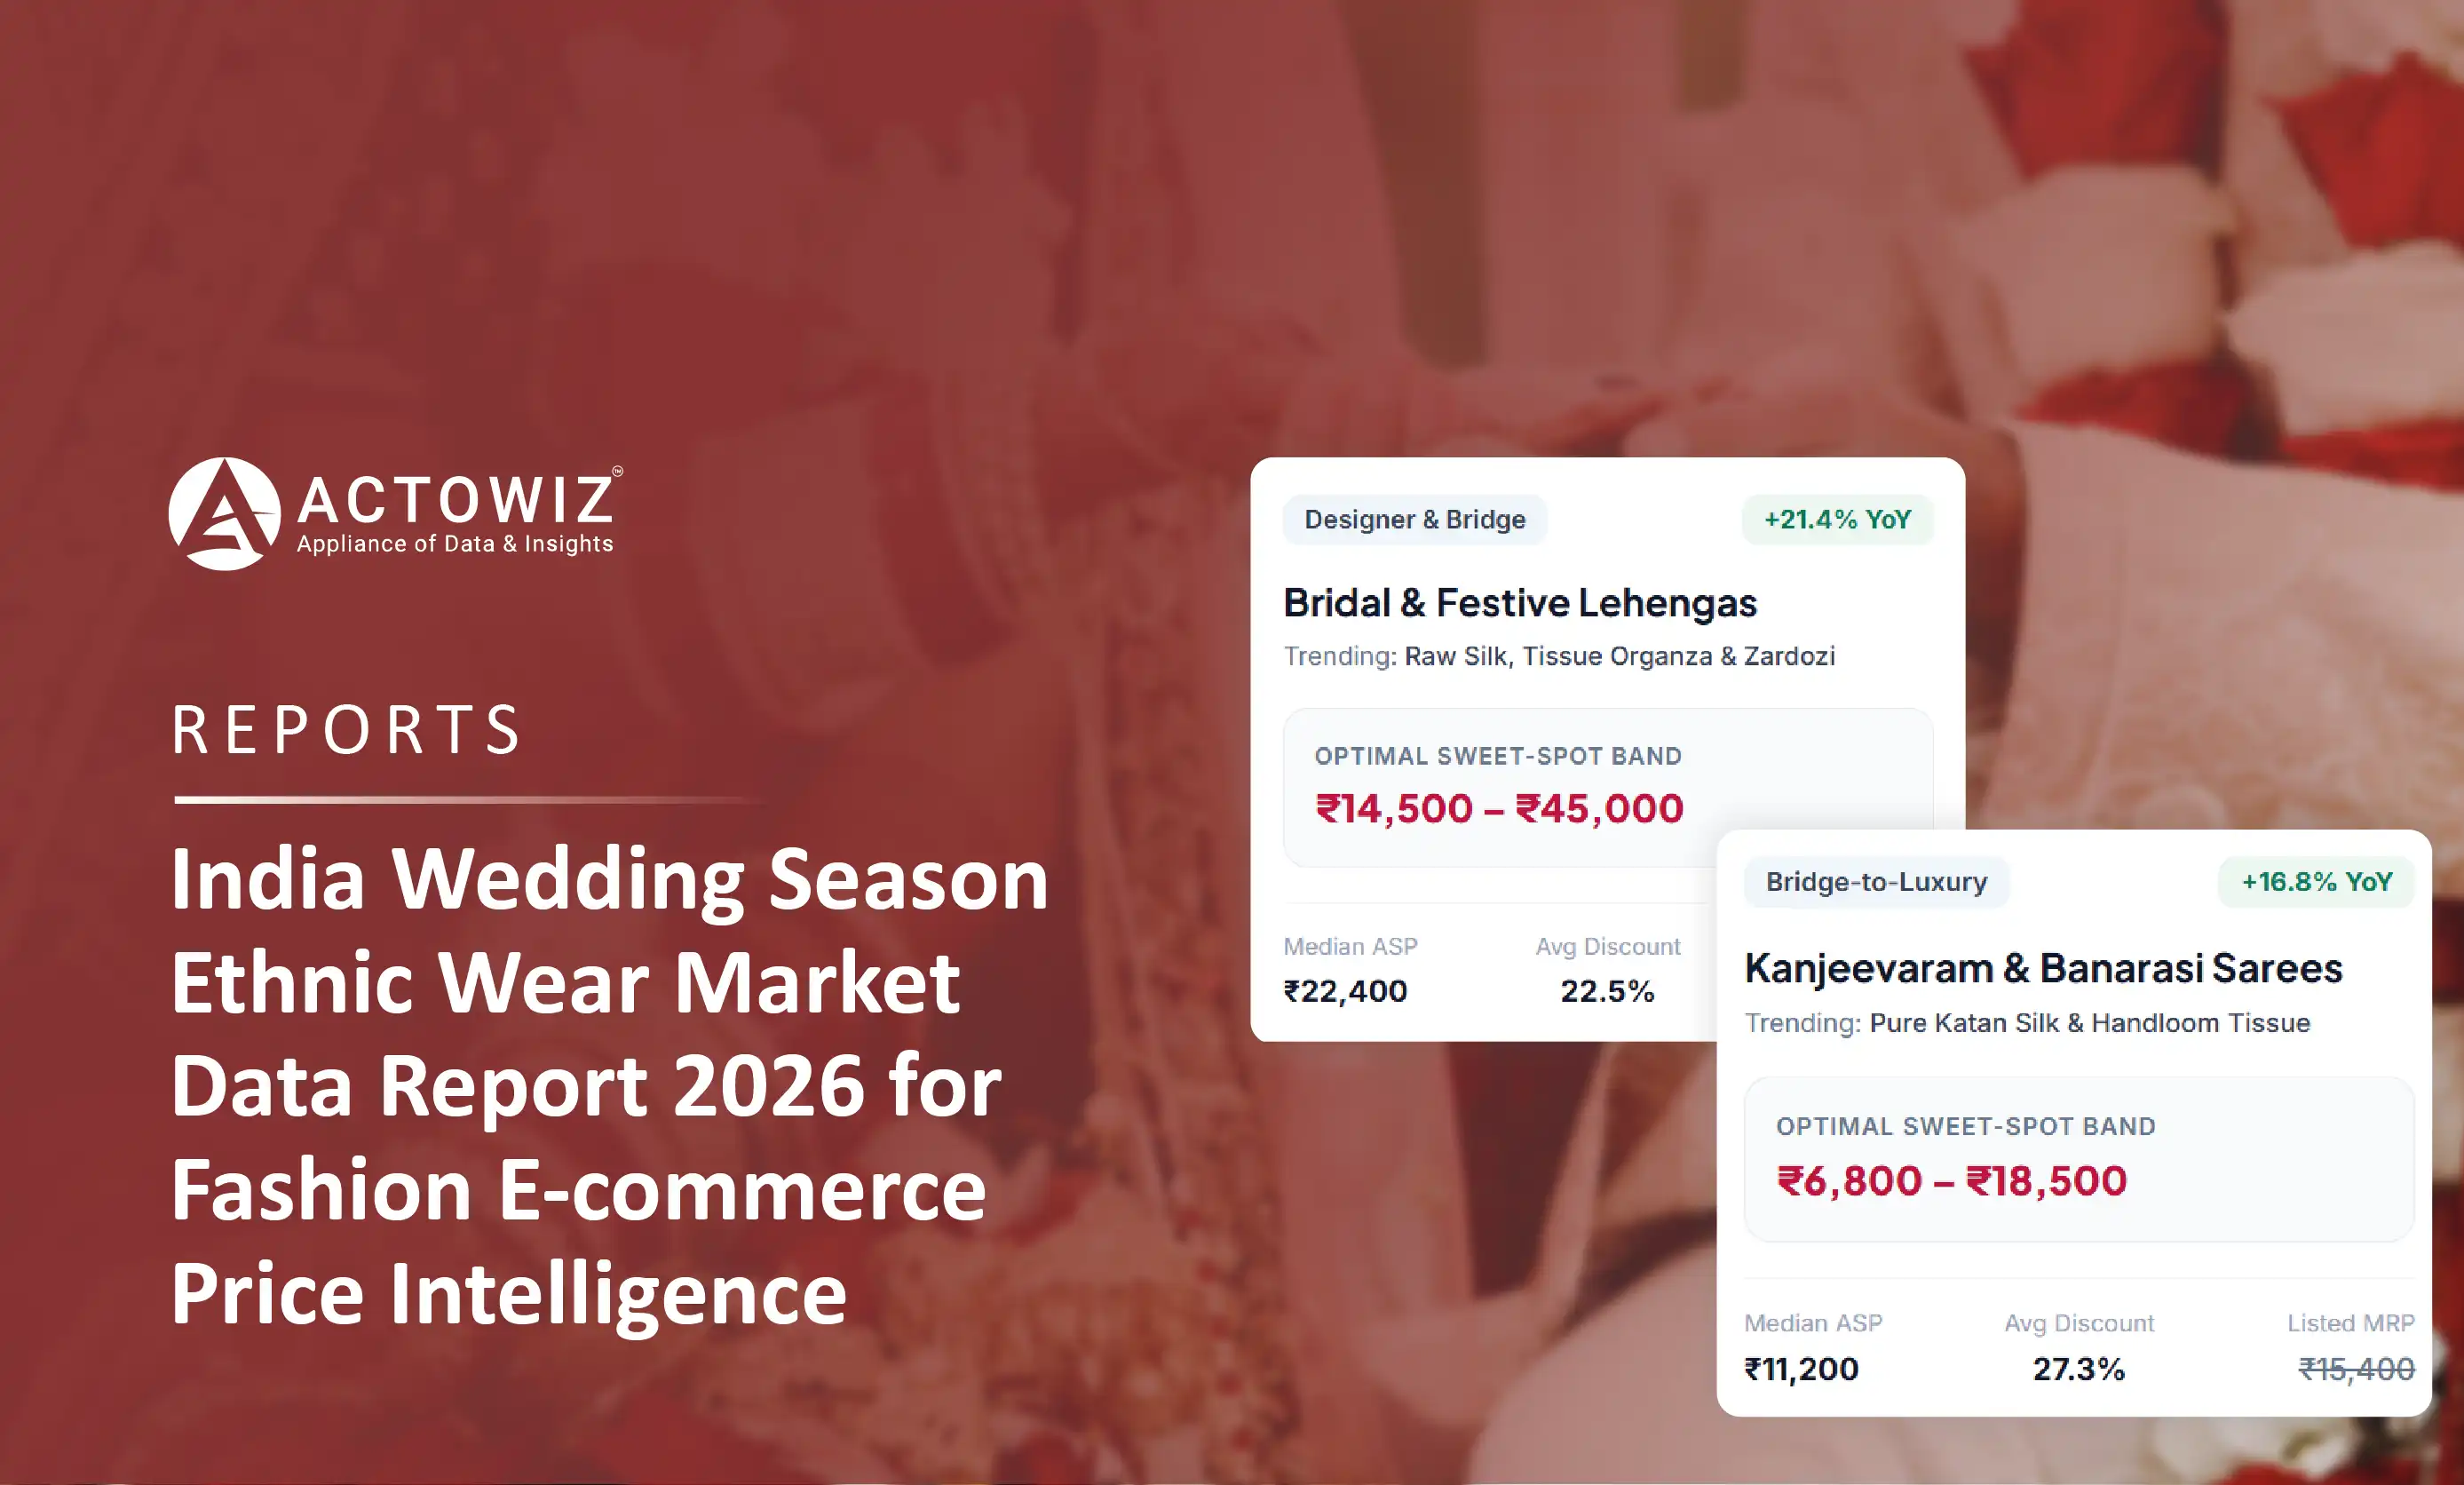
Ethnic wear price data India report for wedding season 2026: track lehenga, saree and sherwani prices, discounts and sizes across Myntra, AJIO.
India's wedding season is the single biggest demand window for ethnic wear – and the period when ethnic wear price data for India moves fastest. The Confederation of All India Traders (CAIT) estimated 46 lakh weddings and ₹6.50 lakh crore of wedding-related trade for 1 November to 14 December 2025 alone, with apparel and sarees put at about 10% of that spend (Source: https://cait.in//images/press-release/pdf_1762754341.pdf). Those are trade-body estimates, but they show the scale fashion sellers are competing for.
Ethnic wear price data India brands use is a structured, dated record of how lehengas, sarees, sherwanis, kurta sets and related accessories are priced, discounted and stocked across Myntra, AJIO, Nykaa Fashion, Amazon, Flipkart, Meesho and brand D2C sites. Tracked through the wedding season, it shows price bands, discount depth, size gaps and new-arrival pace by platform.
This report sets out the market context from published sources, the framework we use to track the 2026–27 season, and the metrics brands should watch. Our own measured values are shown as placeholders and will be added once collection for the season is complete.
The Indian wedding season is now a measurable, repeating demand cycle. CAIT's estimates show wedding counts and spend rising sharply from 2022 to 2024, then a slightly lower wedding count but higher spend in 2025, which points to rising spend per wedding rather than more weddings.
For 2026, the main season opens after the monsoon-period pause. One wedding planner calendar lists the first November 2026 muhurat on 21 November, followed by 24, 25 and 26 November and seven dates in early December (Source: https://www.azafashions.com/blog/blog-indian-wedding-muhurat-dates-nov-dec-2026-outfit-planner/). Demand then continues into the January–February window. Brands that plan prices and stock around these dates, rather than around general sale events, can align supply with peak purchase intent.
At the time of writing we had not found a published CAIT estimate for the 2026 season. The table below uses only cited figures; the 2026 row will be filled when a source is published.
| Season (CAIT window) | Estimated weddings | Estimated wedding trade | Apparel and sarees share |
|---|---|---|---|
| 2022 | 32 lakh | ₹3.75 lakh crore | Not stated in source used |
| 2023 | 38 lakh | ₹4.74 lakh crore | Not stated in source used |
| 2024 | 48 lakh | ₹5.90 lakh crore | Not stated in source used |
| 2025 (1 Nov–14 Dec) | 46 lakh | ₹6.50 lakh crore | About 10% |
| 2026 (Nov–Dec) | No Data | No Data | No Data |
Source: CAIT press release, 30 October 2025, https://cait.in//images/press-release/pdf_1762754341.pdf. All values are trade-body estimates. The year labels for 2022 and 2023 are as printed in the release.
Published estimates of India's ethnic wear market vary by scope and year, so the honest answer is a range. Recent trade reporting puts the market at about US$22 billion in FY24 and an expected US$26.9 billion by FY26, while older and narrower estimates come in lower.
Apparel Resources reported ethnic wear at about US$22 billion of India's US$102 billion garment market in FY24, and an expected US$26.9 billion by FY26 at around 10.6% CAGR. It also cited Technopak for the figure that ethnic wear makes up 71% of India's womenswear market (Source: https://apparelresources.com/business-news/retail/2025-trends-ethnicwear-set-shine/). The same article put the organised segment at ₹28,000–37,000 crore, or 15–20% of the market, though without naming a firm.
A narrower lens is wedding and celebration wear. An ICICI Securities IPO review of Vedant Fashions, citing CRISIL, put the Indian wedding and celebration wear market at about ₹1,020 billion in FY20, with a FY25 range of about ₹1,325–1,375 billion shown in its exhibit, and branded penetration of 15–20%. The same note cites CRISIL's estimate of 9.5–10 million weddings a year in India (Source: https://www.icicidirect.com/mailimages/IDirect_VedantFashions_IPOReview.pdf). Note the difference with CAIT's season-only counts: the two measure different windows.
| Estimate | Scope | Value | Period | Source |
|---|---|---|---|---|
| Ethnic wear market | All ethnic wear, India | About US$22 billion | FY24 | Apparel Resources (firm not named) |
| Ethnic wear market (forecast) | All ethnic wear, India | About US$26.9 billion, ~10.6% CAGR | FY26 | Apparel Resources (firm not named) |
| Ethnic wear market (older forecast) | All ethnic wear, India | US$18.68 billion, 8% CAGR | 2023 | Technavio via Indian Retailer |
| Wedding and celebration wear | Wedding / celebration apparel | About ₹1,020 billion | FY20 | CRISIL via ICICI Securities |
| Wedding and celebration wear (estimate) | Wedding / celebration apparel | About ₹1,325–1,375 billion | FY25 (as shown in exhibit) | CRISIL via ICICI Securities |
| Ethnic share of womenswear | Women's apparel | 71% | Not dated in source | Technopak via Apparel Resources |
Estimate / forecast based on Apparel Resources, ICICI Securities (CRISIL) and Indian Retailer (Technavio): https://www.indianretailer.com/article/retail-business/retail-trends/ethnic-wear-india-market-analysis. Figures differ in scope and should not be added together.
A structured view means every listing is captured with the same fields, mapped to one category tree and matched across platforms. Without this, a "lehenga" on one site and a "lehenga choli set" on another look like different products, and price comparisons break down.
Online demand for occasion wear is growing, which makes catalogues larger and faster-moving. Myntra reported a 50% year-on-year rise in women's occasion wear demand during the recently concluded wedding season, and said it added over 40 brands and more than 2.2 lakh styles to its women's ethnic wear range (Source: https://apparelresources.com/business-news/retail/myntra-reports-50-growth-in-womens-occasion-wear-demand/, July 2026). Assortment at that scale needs automated tracking.
We group the wedding catalogue into the categories below. Brand D2C sites such as Manyavar, Biba, W and FabIndia are examples of public sites that can be tracked alongside marketplaces; we make no claims here about their pricing.
| Category | Typical sub-types | Key attributes to capture | Platforms to cover |
|---|---|---|---|
| Lehengas | Bridal, lehenga choli sets, semi-stitched | Fabric, work type (zari, sequin), stitched / unstitched, dupatta included | Myntra, AJIO, Nykaa Fashion, Amazon, Flipkart, Meesho, D2C |
| Sarees | Silk (Banarasi, Kanjeevaram), designer, ready-to-wear | Fabric, weave, blouse piece, length | All marketplaces, D2C |
| Sherwanis | Sherwani sets, Indo-western | Set contents (stole, safa, mojari), fabric | Myntra, AJIO, Amazon, Flipkart, D2C |
| Kurta sets | Women's suits, men's kurta-pyjama, Nehru jacket sets | Pieces in set, fabric, embroidery | All, especially Meesho for value tiers |
| Men's ethnic (other) | Bandhgalas, Nehru jackets, dhoti sets | Fit, fabric, size range | Myntra, AJIO, Amazon, D2C |
| Accessories (jewellery-adjacent) | Fashion jewellery sets, potli bags, juttis, dupattas | Material, set size, plating | Myntra, Nykaa Fashion, Amazon, Meesho |
Marketplace signals become intelligence when they are tracked on a schedule and compared like for like. For wedding ethnic wear, six signals matter most: price bands, discount depth, new-arrival velocity, size availability, ratings and delivery promises.
Price bands show where each platform concentrates its range – value, mid or premium – and whether that mix shifts as muhurat dates approach. Discount depth should be measured against a pre-season reference price, not only against MRP, because MRP-based discounts can overstate real savings. New-arrival velocity counts new styles added per week by category; a spike just before peak dates shows where platforms expect demand.
Size availability is often the hidden constraint. A lehenga with a broken size curve – popular sizes sold out, edge sizes left – loses sales even at a good price. Ratings and review counts indicate which styles convert, and delivery promises matter more in wedding season than at most other times, because a late delivery for a fixed-date event is a lost sale.
| Signal | Definition | Why it matters in wedding season | Measured value |
|---|---|---|---|
| Median price by category | Median selling price of in-stock listings | Shows price positioning per platform | No Data |
| Effective discount depth | Selling price vs pre-season reference price | Separates real markdowns from MRP framing | No Data |
| New arrivals per week | Count of newly listed styles by category | Signals expected demand peaks | No Data |
| Size availability rate | Share of listed sizes in stock | Flags lost sales from broken size curves | No Data |
| Average rating and review count | Public rating and number of reviews | Indicates style conversion | No Data |
| Delivery promise (days) | Promised delivery time to sample pincodes | Critical for fixed-date events | No Data |
Live tracked values will be added after collection for the 2026–27 season.
Wedding-season prices do not move in one direction. Some categories hold price as demand rises, others see promotional bursts tied to sale events that overlap the season, and stock in key sizes can run out before peak dates. Tracking daily lets brands see which of these is happening.
We track the season in three phases. Pre-season (late October to mid-November) sets the reference price and shows how ranges are being loaded. Peak (21 November to mid-December) is when size availability and delivery promises matter most. Late season (January to February 2027) often brings a second wave of weddings and, in some categories, end-of-season markdowns.
The useful comparison is not "which platform is cheapest" but how the same or similar styles are priced and stocked across platforms in each phase. Matching identical products across sites, and grouping close matches by attributes, keeps the comparison fair.
| Phase | Dates (2026–27) | Price metric | Availability metric |
|---|---|---|---|
| Pre-season | Late Oct – 20 Nov 2026 | No Data | No Data |
| Peak 1 | 21 Nov – 14 Dec 2026 | No Data | No Data |
| Mid-season lull | Mid-Dec 2026 – mid-Jan 2027 | No Data | No Data |
| Peak 2 | Mid-Jan – Feb 2027 | No Data | No Data |
Phase dates are planning windows based on the published November–December muhurat calendar cited above.
Competitive position in wedding ethnic wear has three parts: how wide a brand's range is on each platform, how its prices compare with close substitutes, and whether it stays in stock when it counts. Each can be measured from public listing data.
Share of shelf counts a brand's in-stock listings as a share of its category on each platform. Price index compares a brand's median price with a defined peer set in the same category and price band. Availability index tracks the share of a brand's styles with full size runs during peak weeks. Together they show whether a brand is visible, priced right and able to fulfil.
Marketplaces and D2C sites play different roles. Marketplaces show the competitive set a shopper sees side by side, while D2C sites show a brand's own pricing and launch calendar. Tracking both lets a brand spot gaps – for example, a style in stock on its own site but out of stock on a marketplace during a peak week.
| Metric | How it is calculated | Platform view | Brand A | Peer set median |
|---|---|---|---|---|
| Share of shelf | Brand in-stock listings / category in-stock listings | Per platform | No Data | No Data |
| Price index | Brand median price / peer median price × 100 | Per category | No Data | 100 |
| Availability index | Styles with full size run / total styles | Peak weeks | No Data | No Data |
| Discount frequency | Days with a markdown / days tracked | Season | No Data | No Data |
This tracking uses public listing data only – prices, product attributes, stock status, ratings and delivery promises shown to any visitor. It does not use logins, personal data or reviewer identities, and collection respects each site's terms. History is available from the date collection starts. This is general information, not legal advice.
The Indian wedding season is a large, repeating and date-driven demand window. CAIT's estimates put recent seasons at tens of lakhs of weddings and several lakh crore rupees in spend, and published market estimates place ethnic wear in the tens of billions of dollars a year, though sources differ on scope and size.
For brands and marketplaces, the edge comes from seeing price bands, discount depth, new arrivals and size availability across platforms as the season unfolds. This report gives the framework and will be updated with measured values once collection is complete. To get the full report or a sample of season data, use the download form or contact our sales team at https://www.actowizsolutions.com/contact-us.php.
The main window runs from late November 2026 to February 2027. One published muhurat calendar lists the first November 2026 date as 21 November, with several dates in early December. A second wave usually follows in January and February.
Public listing data such as selling price, MRP, discount, fabric and other attributes, size availability, stock status, ratings, review counts, new arrivals and delivery promises. Personal data and reviewer identities are not collected.
Myntra, AJIO, Nykaa Fashion, Amazon.in, Flipkart and Meesho, plus selected brand D2C sites. Final coverage depends on each project's scope and on the public pages available.
They measure different things. Some cover all ethnic wear, some only wedding and celebration wear, and they use different years and methods. This report shows them side by side as a range rather than picking one.
History is available from the date collection starts. We do not back-fill past seasons, so starting before the pre-season phase gives the most useful reference prices.
Our web scraping expertise is relied on by 4,000+ global enterprises including Zomato, Tata Consumer, Subway, and Expedia — helping them turn web data into growth.
Watch how businesses like yours are using Actowiz data to drive growth.
From Zomato to Expedia — see why global leaders trust us with their data.
Backed by automation, data volume, and enterprise-grade scale — we help businesses from startups to Fortune 500s extract competitive insights across the USA, UK, UAE, and beyond.
We partner with agencies, system integrators, and technology platforms to deliver end-to-end solutions across the retail and digital shelf ecosystem.
Track FMCG shelf prices, promotions, pack sizes and availability across retailers and countries in one feed. A 2026 guide for global brands.
Explore Restaurant & Menu Data from RestaurantGuru UK to analyze restaurant listings, menus, pricing, ratings, and dining trends.
Ethnic wear price data India report for wedding season 2026: track lehenga, saree and sherwani prices, discounts and sizes across Myntra, AJIO.
Whether you're a startup or a Fortune 500 — we have the right plan for your data needs.