🎃 HALLOWEEN OFF Spooky Savings Event! Get FLAT 20% OFF on all Web Scraping & Data Extraction Plans 20% OFF Web Scraping Plans!
Ends in: 00d : 00h : 00m : 00s
🦇
👻
🎃 Spooktacular Limited Offer

Don’t Let High Data Costs Haunt You! 🎃

Get FLAT 20% OFF

T&C Apply

Scrape competitor prices, monitor MAP, and extract real-time datasets at a spooky discount this Halloween.

Offer Expires In:
00d : 00h : 00m : 00s
⚡ Claim 20% Discount Now
🎃
Promo Code Copied!
SPOOKY30 (20% OFF Applied)
Core services
Enterprise Data Extraction

Scalable web, app and AI-powered collection across 40+ countries.

All 58 services →
New 2026
AI Training Data

Corpus building with provenance and opt-out compliance.

Learn more →
Free pilot
24-hour sample

We run collection on your own sources before you commit.

Get a sample →
58Services
40+Countries
DEVELOPER

Ready-Made Scrapers

Pre-built for top platforms. Self-serve, no setup.

View All →
TRY FREE

API Playground

Test endpoints instantly. No credit card.

Start Free →
28Tools
2SDKs
icons Delivery & SDKs
Streaming Crawl API Scheduler Realtime Alerts Webhook Delivery 🐍 Python SDK 💚 Node.js SDK
Need it managed instead?

Fixed monthly retainer, named engineer, no per-request metering.

Managed Data API →
HOT

Case Studies

How brands use Actowiz, with named outcomes.

Read →
FREE

Sample Datasets

Real output, no signup.

Download →
NEW

ROI Calculator

Model the return on a data engagement.

Calculate →

Introduction

The Indonesia Food Delivery Landscape Data Intelligence market offers valuable opportunities for food brands, restaurant chains, delivery platforms, and market researchers seeking to understand competition, pricing, and consumer demand. Through Food Data Scraping Services, businesses can organize publicly accessible restaurant menus, delivery charges, promotional offers, product availability, and platform listings into structured datasets. These datasets help researchers evaluate differences between GrabFood, GoFood, and ShopeeFood while keeping product-level observations separate from broader market estimates.

Indonesia is Southeast Asia’s largest online food delivery market by gross merchandise value (GMV). According to Momentum Works estimates reported by Katadata, Indonesia’s food delivery GMV reached approximately US$5.4 billion in 2024, representing around 17% growth over 2023. In 2025, the market grew by a further 18% to approximately US$6.4 billion. These estimates include the value of orders received by restaurant partners, including canceled orders, so they should not be interpreted as net revenue earned by platforms. Sources: Katadata’s 2024 market report and 2025 market report.

This report examines platform competition, menu information, delivery fees, promotions, pricing intelligence, and restaurant-level data. It uses published market estimates and official platform information, while identifying gaps where historical menu-level prices or delivery fees are not publicly verified.

How does restaurant menu information reveal platform positioning?

GrabFood restaurant Menu Data Scraping can help researchers organize publicly displayed restaurant names, menu items, item descriptions, prices, restaurant categories, and availability indicators. Comparing these records across locations and collection dates can reveal how restaurant assortments and displayed prices differ between listings. Researchers must match the same restaurant branch and equivalent menu item before drawing conclusions, because portion sizes, optional add-ons, and location-specific menus can affect comparability.

The Indonesia Food Delivery Landscape Data Intelligence framework should distinguish restaurant coverage from transaction value. A platform may display many restaurants in a particular city, but listing counts alone do not establish its market share or sales performance. Likewise, a higher displayed menu price does not necessarily mean a customer pays more after applying an eligible voucher or accounting for delivery and service fees.

Momentum Works estimates reported by Katadata show that GrabFood remained the largest of the three platforms in Indonesia by GMV in 2024. GrabFood’s estimated GMV reached US$2.54 billion, while GoFood recorded US$1.89 billion and ShopeeFood US$0.97 billion. These figures are useful for understanding market scale, but they are not menu-price measurements. Source: Katadata’s platform comparison.

Verified market milestones, 2020–2026
Year Indonesia food delivery market or platform data Interpretation
2020 GrabFood GMV: US$1.96B; GoFood GMV: US$1.74B; ShopeeFood figure not reported in the cited historical table Historical platform baseline
2021 GrabFood: US$2.25B; GoFood: US$1.98B; ShopeeFood: US$0.276B All figures are estimates
2022 GrabFood: US$2.21B; GoFood: US$1.98B; ShopeeFood: US$0.315B Platform performance diverged
2023 Indonesia food delivery GMV: approximately US$4.6B Market-level estimate
2024 Market GMV: approximately US$5.4B Around 17% annual growth
2025 Market GMV: approximately US$6.4B Around 18% annual growth
2026 Full-year market GMV not yet available as of October 17, 2026 Do not treat a forecast as a finalized result

Sources: Katadata’s historical platform data, 2024 market estimates, and 2025 market estimates. Figures are rounded estimates and are not menu-price data.

What should businesses know about delivery fees?

GoFood Food Delivery fee Data API describes a structured data requirement for collecting delivery-fee observations; it does not imply that GoFood offers an unrestricted public API for obtaining all delivery charges. Delivery costs may vary according to delivery address, restaurant location, distance, time, promotions, membership benefits, and other conditions presented during ordering. A reliable comparison must capture the conditions under which each fee appears.

GoFood fee research should record the restaurant, selected branch, customer location or delivery zone, displayed fee, collection time, promotion eligibility, and any relevant order conditions. If the fee is not visible until checkout, researchers should not infer it from another restaurant or a different address. Similarly, a free-delivery voucher should be recorded separately from the platform’s standard displayed fee.

The same principle applies when comparing the three platforms. A menu item with a lower listed price may not produce the lowest total order cost if its delivery charge or service fee is higher. Conversely, a promotional offer can reduce the final amount without changing the listed menu price.

Delivery-cost comparison fields
Field Why it matters
Restaurant and branch Prevents comparisons between different outlets
Delivery location or zone Documents the context in which the fee appeared
Displayed delivery fee Records the observed charge
Service or other fees Keeps additional charges separate
Voucher or membership condition Shows whether the displayed cost depends on eligibility
Collection timestamp Makes observations comparable over time
Final payable total, when visible Helps compare the complete order cost

GoFood’s parent company, GoTo, publishes financial and operational reporting through its investor-relations website. Such reports provide company-level context, but they do not constitute a historical public database of individual GoFood delivery charges. Therefore, this report does not assign unsupported annual averages to delivery fees from 2020 to 2026.

How can promotional offers be evaluated consistently?

ShopeeFood Deals & Discount Data Collection focuses on capturing publicly visible vouchers, discounts, promotional banners, eligible menu items, minimum-order requirements, and validity dates. Promotions are central to price comparisons because the displayed menu price and the price paid after an eligible discount may differ. However, the presence of a promotion does not mean every customer or every restaurant qualifies for it.

The Indonesia Food Delivery Landscape Data Intelligence approach should classify each offer according to its actual terms. Useful categories include item-level discounts, restaurant-wide promotions, minimum-spend vouchers, delivery-fee reductions, and customer-specific offers when those terms are explicitly disclosed. Researchers should preserve the original wording or source reference so that the eligibility conditions remain auditable.

Momentum Works’ February 2025 analysis found that ShopeeFood’s estimated Indonesian GMV reached US$970 million in 2024, up 76% year over year. This was a substantially faster growth rate than the reported growth of GrabFood and GoFood in that period. The result indicates a shift in competitive momentum, but it does not prove that discounts alone caused the growth. Source: Katadata’s 2024 platform estimates.

Platform GMV comparison
Platform 2023 estimated GMV 2024 estimated GMV 2024 year-over-year change
GrabFood Approximately US$2.31B US$2.54B +10%
GoFood Approximately US$1.75B US$1.89B +8%
ShopeeFood Approximately US$0.55B US$0.97B +76%

Source: Katadata, drawing on Momentum Works estimates. The 2023 values are approximate and derived from the reported 2024 figures and growth rates; they are included only as rounded context, not as independently measured restaurant-level sales.

For promotion research, each offer should be connected to its restaurant, menu item or eligible category, applicable conditions, and collection date. This enables analysts to separate genuine price reductions from marketing messages that require a minimum purchase or apply only to selected customers.

How can menu prices be compared across the three platforms?

A GrabFood vs GoFood vs ShopeeFood price comparison should use matched restaurants, equivalent menu items, consistent portion sizes, and comparable delivery conditions. Comparing a regular meal with a larger combo, or comparing different branches, can create a misleading impression of price differences. Where the same restaurant lists different products across platforms, the researcher should document the mismatch instead of treating the records as equivalent.

A robust comparison distinguishes menu price, discounted item price, delivery fee, service fee, voucher eligibility, and final payable total when all are visible. It should also record whether the displayed amount is available to all customers or depends on membership, payment method, or a minimum spend. These fields help restaurants assess price presentation and help researchers understand the difference between headline prices and the complete ordering cost.

The market-level figures show that GrabFood led the three platforms by Indonesian GMV in 2024, while ShopeeFood recorded the fastest annual growth among them. In 2025, estimates reported by Katadata placed GrabFood at US$2.94 billion, GoFood at US$1.98 billion, and ShopeeFood at US$1.47 billion. Source: Katadata’s 2025 platform report.

What a valid comparison needs
Comparison dimension Recommended approach
Menu item Match item name, size, and important attributes
Restaurant Match the same outlet or branch where possible
Base price Record the listed price before discounts
Promotional price Capture only when explicitly shown and eligible
Delivery charge Compare under a consistent delivery scenario
Total order cost Calculate only when all required charges are visible
Observation date Collect comparable records within a defined time window

These steps support an evidence-based comparison without claiming that one platform is always cheapest. The actual result can vary by restaurant, city, time, and promotional eligibility. Any published ranking should identify the sample, collection period, and limitations.

How can market-level pricing intelligence support decisions?

Food delivery pricing Data intelligence in Indonesia combines menu prices, fee observations, promotional conditions, restaurant coverage, and market estimates into a structured view of competitive activity. It can help restaurants investigate whether their listed prices differ across platforms, assess the frequency of observed promotions, and identify products that merit further review. Researchers can also study whether menu availability changes alongside displayed prices, provided they have sufficiently frequent observations.

The Indonesia Food Delivery Landscape Data Intelligence model must keep market GMV separate from product-level data. GMV measures the estimated value of orders transacted through platforms; it does not directly measure restaurant profitability, platform revenue, menu inflation, or the average price paid for a meal. The reported 2025 Indonesian market total of US$6.4 billion is therefore evidence of market scale, not evidence that menu prices rose by 18%. The 18% figure refers to GMV growth. Source: Katadata’s 2025 market report.

Evidence-backed trend summary
Period Verified finding What it can support
2020–2022 Published estimates document platform GMV for GrabFood and GoFood, with ShopeeFood estimates appearing from 2021 Historical competitive context
2023 Indonesia’s online food delivery GMV was estimated at approximately US$4.6B Market-scale baseline
2024 GMV reached approximately US$5.4B, up around 17% Annual market growth analysis
2025 GMV reached approximately US$6.4B, up around 18% Latest full-year market benchmark available in the cited sources
2026 Full-year market results are not yet available as of October 17, 2026 Ongoing monitoring rather than a finalized annual comparison

Sources: Historical platform data, 2024 estimates, and 2025 estimates.

For operational use, teams should define consistent metrics such as median listed price for matched items, proportion of observed listings with an offer, displayed delivery-fee ranges, and restaurant coverage by location. These measures should be calculated from collected records rather than inferred from GMV statistics. Results should include sample size, timestamps, and missing-data notes so that decisions reflect the limits of the evidence.

What should a restaurant-level dataset include?

An Indonesia food delivery restaurant menu and pricing dataset should link each observed menu item to its restaurant, platform, location, collection date, and source. Core fields can include restaurant name, branch identifier when available, cuisine category, item name, description, listed price, promotional price if explicitly displayed, availability, delivery fee, and offer conditions. The exact fields should reflect what the source actually makes visible; researchers should not fill missing values by guessing.

Restaurant matching is essential when a business appears on multiple platforms. Names can vary in spelling, branches may have different menus, and the same restaurant can list differently sized products. A reliable dataset should retain platform-specific listing URLs and use documented matching rules. Where a match cannot be confirmed, the records should remain separate until more evidence is available.

The historical GMV figures offer useful context for prioritizing research. For example, the three platforms together represented an estimated US$5.4 billion in Indonesian food delivery GMV in 2024, rising to about US$6.4 billion in 2025. Those market totals establish the sector’s scale but cannot tell a restaurant which menu item was discounted or what a customer paid for delivery. Sources: 2024 market estimates and 2025 market estimates.

A useful dataset also includes collection status, timestamps, currency, and validation flags. These support repeatable analysis, help identify stale records, and make it possible to distinguish real price changes from product substitutions or changes in promotional eligibility. Collection should respect platform terms, access restrictions, privacy requirements, and applicable law.

Actowiz Solutions can help businesses design a structured workflow for collecting, validating, and analyzing publicly available food delivery data, subject to applicable platform terms and permissions.

The emphasis should be on trustworthy records, consistent product matching, and transparent reporting rather than unsupported claims about competitor performance.

A Managed Grab data workflow can be designed around agreed sources and fields, such as restaurant listings, menu prices, promotions, and visible availability. The scope should specify the target cities, restaurant categories, collection frequency, permitted data sources, and quality checks. These details are important because a dataset from selected locations should not be presented as a complete national census.

The Indonesia Food Delivery Landscape Data Intelligence approach can then connect validated observations with published market research. Useful deliverables may include structured files, historical snapshots, source references, coverage summaries, and dashboards showing the data that was actually collected.

Potential service benefits include:

  • Consistent collection: Standardize the fields captured from approved sources.
  • Data quality controls: Identify duplicates, missing prices, and inconsistent product attributes.
  • Historical traceability: Preserve timestamps and source URLs for later verification.
  • Comparable reporting: Separate menu prices, promotions, delivery fees, and total order costs.
  • Evidence-based insights: Clearly distinguish observed data from third-party market estimates.

This approach gives restaurants, food brands, and researchers a defensible basis for competitive analysis while preserving the limitations of the underlying data.

Conclusion

Indonesia’s online food delivery market has continued to expand, with estimated GMV increasing from approximately US$5.4 billion in 2024 to US$6.4 billion in 2025. GrabFood remained the largest of the three platforms by estimated Indonesian GMV, while ShopeeFood recorded strong growth. These market figures help explain the competitive landscape, but menu prices, delivery fees, and promotions require separate, dated observations.

Businesses can gain more useful insights by matching equivalent restaurant items, capturing promotional conditions, recording delivery costs under consistent scenarios, and documenting collection coverage. Historical claims should be made only where supporting records exist; unavailable 2026 full-year results and unverified menu-price histories should not be presented as facts.

Contact Actowiz Solutions to discuss a compliant data collection and analysis workflow using a GoFood Scraping API approach, a tailored Web Crawling service, and Web Data Mining to turn validated restaurant and pricing observations into actionable market intelligence!

Social Proof That Converts

Trusted by Global Leaders Across Q-Commerce, Travel, Retail, and FoodTech

Our web scraping expertise is relied on by 4,000+ global enterprises including Zomato, Tata Consumer, Subway, and Expedia — helping them turn web data into growth.

4,000+ Enterprises Worldwide
50+ Countries Served
20+ Industries
Join 4,000+ companies growing with Actowiz →
Real Results from Real Clients

Hear It Directly from Our Clients

Watch how businesses like yours are using Actowiz data to drive growth.

▶
1 min
★★★★★
"Actowiz Solutions offered exceptional support with transparency and guidance throughout. Anna and Saga made the process easy for a non-technical user like me. Great service, fair pricing!"
TG
Thomas Galido
Co-Founder / Head of Product at Upright Data Inc.
▶
2 min
★★★★★
"Actowiz delivered impeccable results for our company. Their team ensured data accuracy and on-time delivery. The competitive intelligence completely transformed our pricing strategy."
II
Iulen Ibanez
CEO / Datacy.es
▶
1:30
★★★★★
"What impressed me most was the speed — we went from requirement to production data in under 48 hours. The API integration was seamless and the support team is always responsive."
FC
Febbin Chacko
-Fin, Small Business Owner
icons 4.8/5 Average Rating
icons 50+ Video Testimonials
icons 92% Client Retention
icons 50+ Countries Served

Join 4,000+ Companies Growing with Actowiz

From Zomato to Expedia — see why global leaders trust us with their data.

Why Global Leaders Trust Actowiz

Backed by automation, data volume, and enterprise-grade scale — we help businesses from startups to Fortune 500s extract competitive insights across the USA, UK, UAE, and beyond.

icons
7+
Years of Experience
Proven track record delivering enterprise-grade web scraping and data intelligence solutions.
icons
4,000+
Projects Delivered
Serving startups to Fortune 500 companies across 50+ countries worldwide.
icons
200+
In-House Experts
Dedicated engineers across scrapers, AI/ML models, APIs, and data quality assurance.
icons
9.2M
Automated Workflows
Running weekly across eCommerce, Quick Commerce, Travel, Real Estate, and Food industries.
icons
270+ TB
Data Transferred
Real-time and batch data scraping at massive scale, across industries globally.
icons
380M+
Pages Crawled Weekly
Scaled infrastructure for comprehensive global data coverage with 99% accuracy.

AI Solutions Engineered
for Your Needs

→
LLM-Powered Attribute Extraction: High-precision product matching using large language models for accurate data classification.
→
Advanced Computer Vision: Fine-grained object detection for precise product classification using text and image embeddings.
→
GPT-Based Analytics Layer: Natural language query-based reporting and visualization for business intelligence.
→
Human-in-the-Loop AI: Continuous feedback loop to improve AI model accuracy over time.
icons Product Matching icons Attribute Tagging icons Content Optimization icons Sentiment Analysis icons Prompt-Based Reporting

Connect the Dots Across
Your Retail Ecosystem

We partner with agencies, system integrators, and technology platforms to deliver end-to-end solutions across the retail and digital shelf ecosystem.

icons
Analytics Services
icons
Ad Tech
icons
Price Optimization
icons
Business Consulting
icons
System Integration
icons
Market Research
Become a Partner →

Popular Datasets — Ready to Download

Browse All Datasets →
icons
Amazon
eCommerce
Free 100 rows
icons
Zillow
Real Estate
Free 100 rows
icons
DoorDash
Food Delivery
Free 100 rows
icons
Walmart
Retail
Free 100 rows
icons
Booking.com
Travel
Free 100 rows
icons
Indeed
Jobs
Free 100 rows

Latest Insights & Resources

View All Resources →
thumb
Blog

Preschool Database India 2026 - How EdTech Brands Can Use Decision-Maker Contact Data for Market Expansion

Discover Preschool Database India 2026 to connect with preschool decision-makers, identify growth opportunities, and expand your EdTech business.

thumb
Case Study

How We Helped a Retail Business Improve Product Data Accessibility with Product database & storage API

Simplify product data management with a Product database & storage API for organized storage, efficient access, and scalable business operations.

thumb
Report

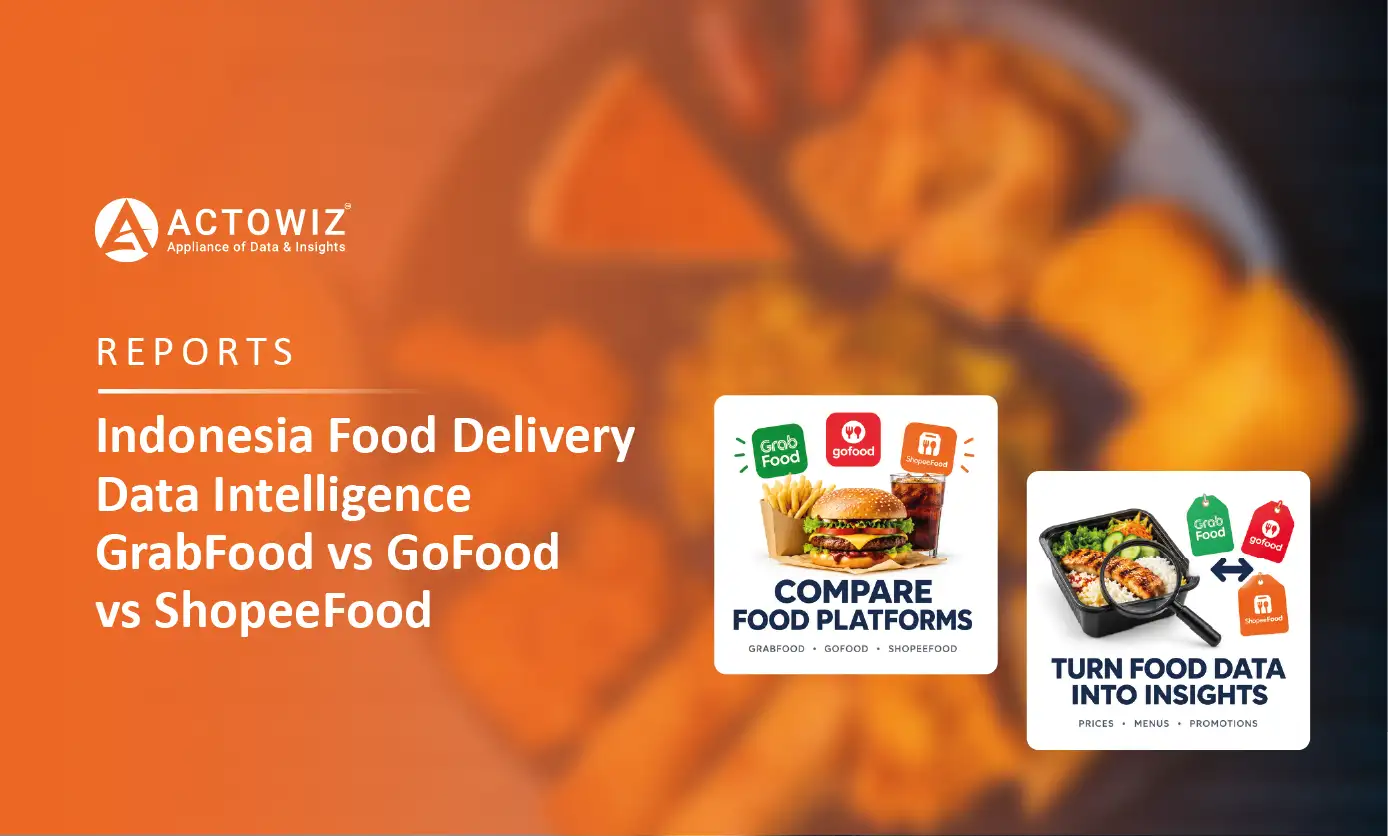
Indonesia Food Delivery Landscape Data Intelligence - GrabFood vs GoFood vs ShopeeFood — Market Share, Growth, and Competitive Trends

Explore Indonesia Food Delivery Landscape Data Intelligence to analyze GrabFood, GoFood, and ShopeeFood pricing, promotions, and market trends.

Start Where It Makes Sense for You

Whether you're a startup or a Fortune 500 — we have the right plan for your data needs.

icons
Enterprise
Book a Strategy Call
Custom solutions, dedicated support, volume pricing for large-scale needs.
icons
Growing Brand
Get Free Sample Data
Try before you buy — 500 rows of real data, delivered in 2 hours. No strings.
icons
Just Exploring
View Plans & Pricing
Transparent plans from $500/mo. Find the right fit for your budget and scale.

Request Free Sample Data

Our team will reach out within 2 hours with 500 rows of real data — no credit card required.

+1 ▼
✓ Free 500-row sample · No credit card · Response within 2 hours