Introduction
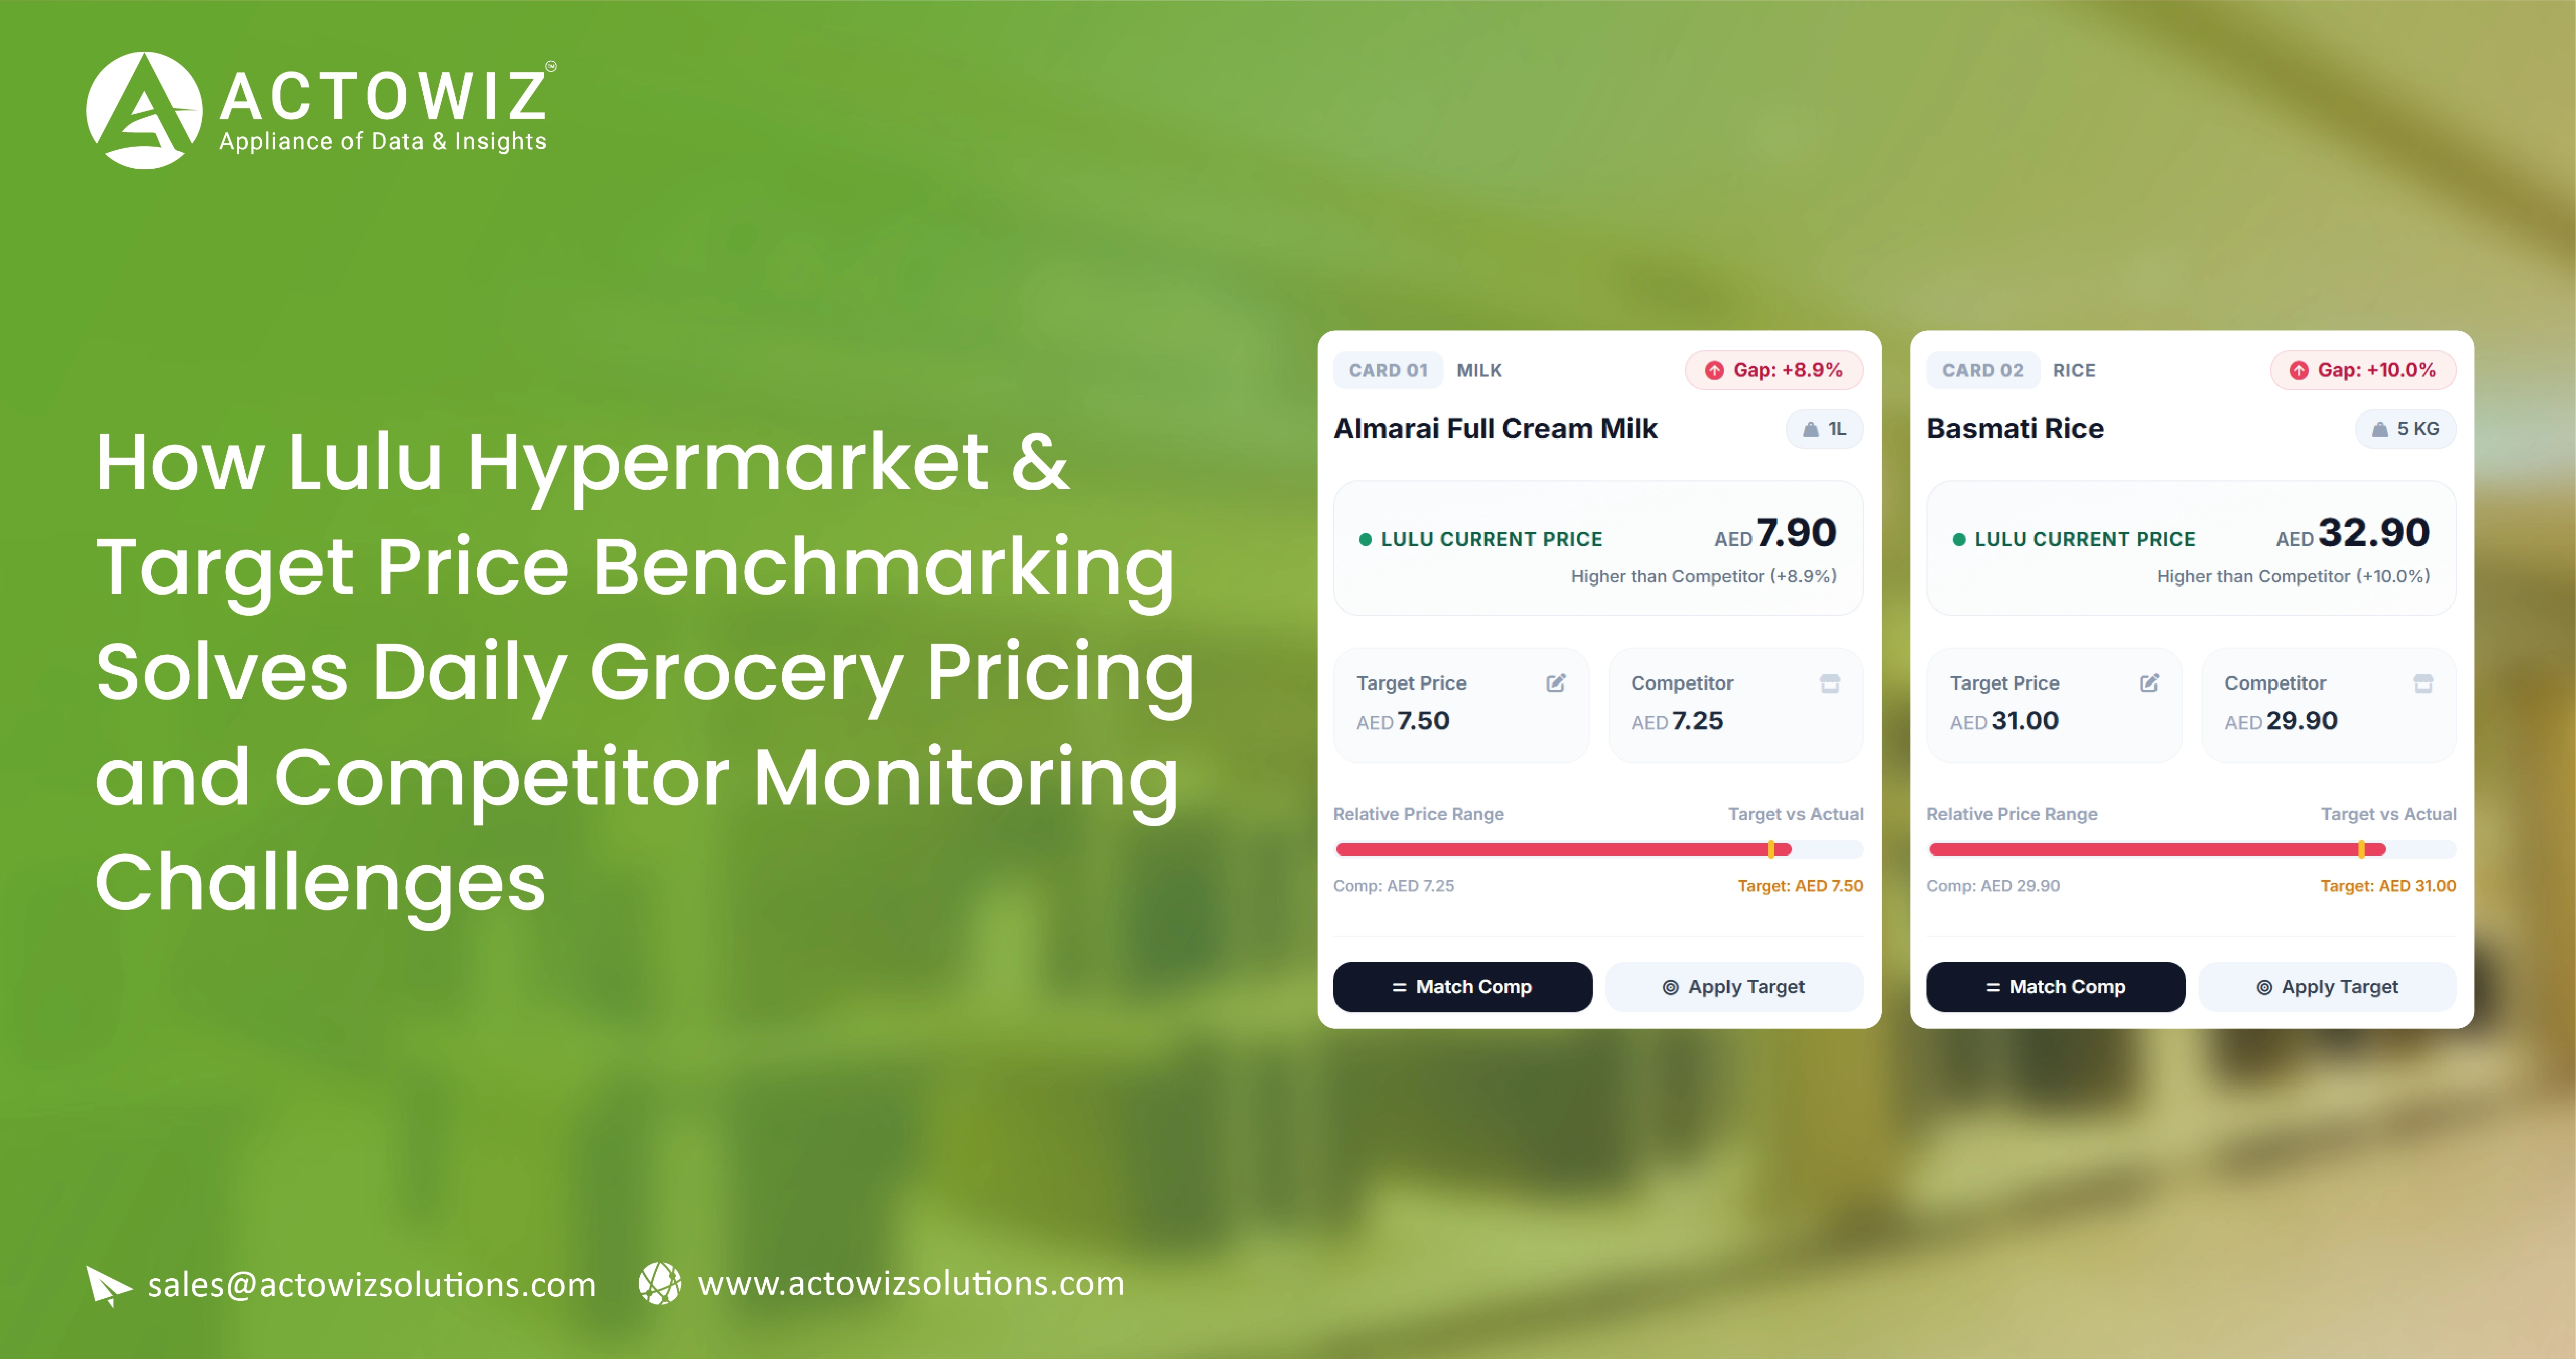
Lulu Hypermarket & Target Price Benchmarking helps retailers, FMCG brands, pricing
teams, and market researchers compare grocery prices, promotions, assortment, and availability
across competing retail environments. Automated data collection turns frequently changing
grocery information into structured intelligence that supports faster pricing and
competitor-monitoring decisions.
Grocery pricing is no longer a once-a-month benchmarking exercise. Lulu Hypermarket
Grocery Price Data Scraping enables businesses to collect and monitor frequently changing
product prices, promotions, and availability at scale. Prices can change because of promotions,
supplier costs, seasonal demand, inventory levels, regional competition, and retailer-specific
strategies. A product that appears competitively priced in one location may have a different
price, discount, or availability elsewhere.
For businesses monitoring Lulu Hypermarket and Target, the challenge is therefore
broader than collecting product prices. They need to understand:
- Which products are being monitored?
- How do prices differ by location?
- Which SKUs are discounted?
- How frequently do competitors change prices?
- Which offers are temporary or recurring?
- Which products are unavailable?
- How does a retailer's assortment compare with competitors?
- How can historical changes be converted into actionable pricing intelligence?
Automated Grocery-Price
Dashboard solutions can consolidate these signals into a
single analytical environment. Instead of manually visiting multiple product pages or store
listings, pricing teams can work with normalized records that support benchmarking, alerts,
trend analysis, and reporting.
For Actowiz Solutions, the objective is not simply to collect grocery information.
The objective is to create a repeatable data pipeline that transforms complex retail data into
business-ready intelligence.
Why Is Daily Grocery Pricing Data Difficult to Monitor?
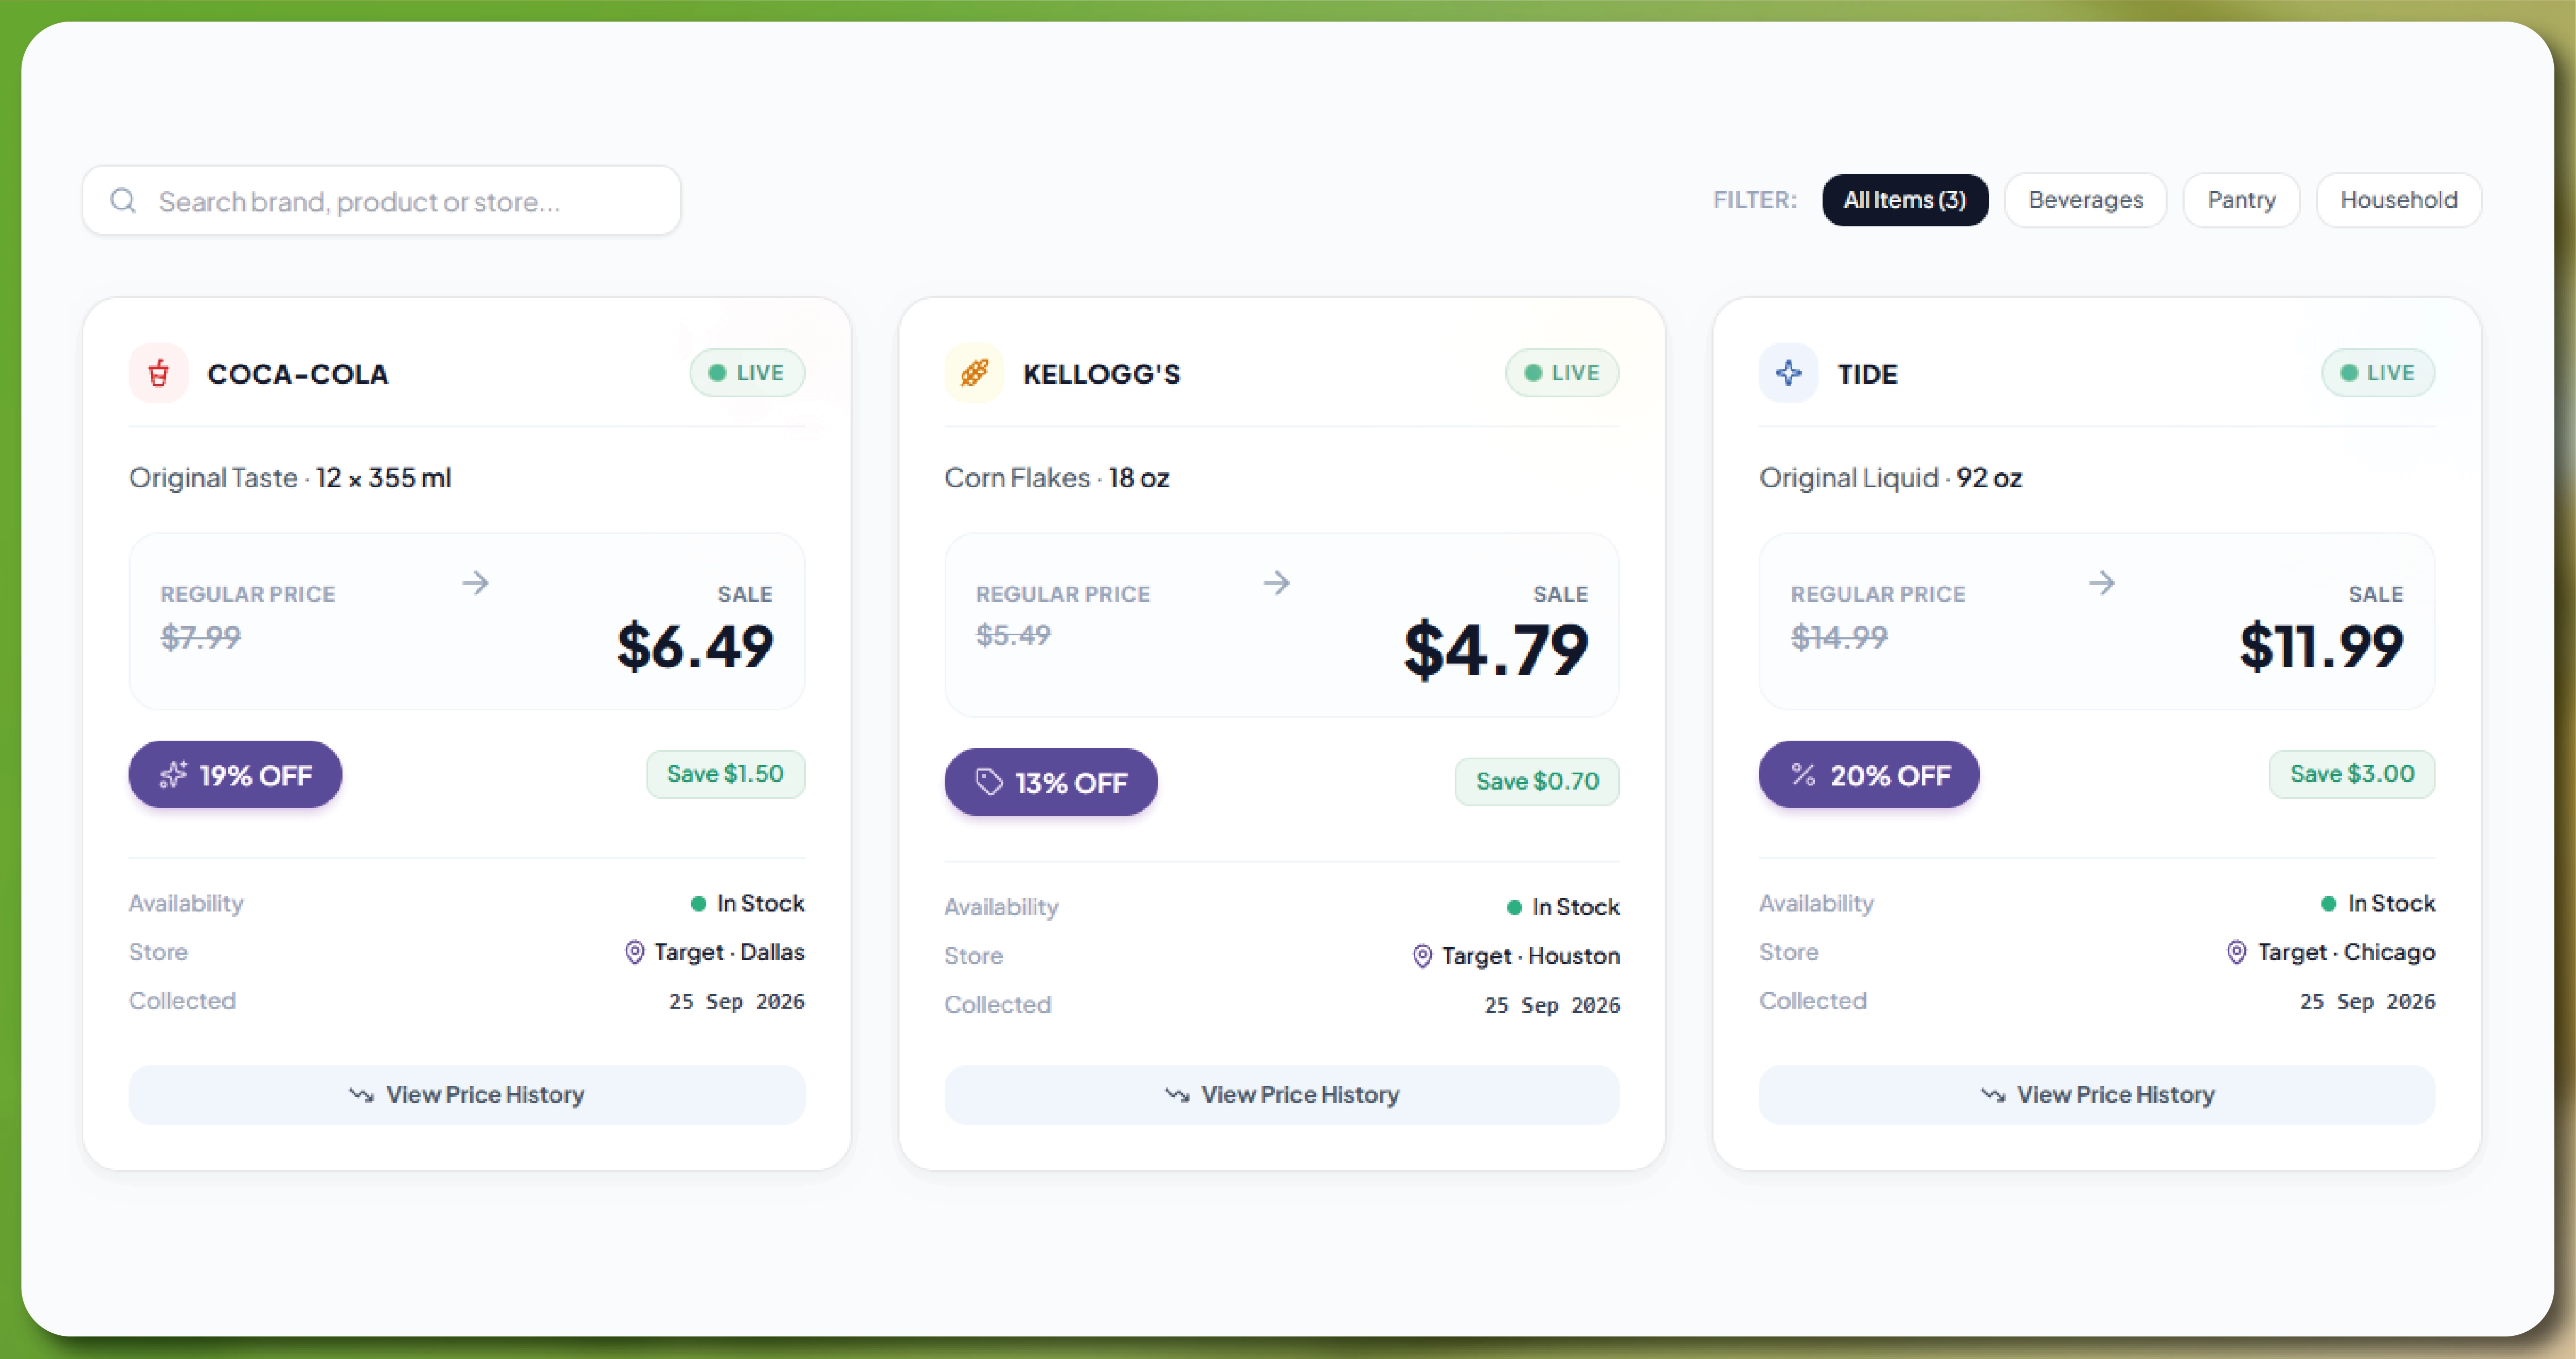
Grocery catalogs contain thousands of products across departments such as beverages,
dairy, packaged food, fresh food, household supplies, personal care, and more. Each product can
have multiple attributes that influence competitive comparisons.
A useful monitoring dataset may include:
| Data Attribute |
Business Use |
| Product name |
Product identification |
| Brand |
Brand-level comparison |
| SKU/product ID |
Accurate product matching |
| Category |
Category benchmarking |
| Pack size |
Unit-price comparison |
| Regular price |
Base-price benchmarking |
| Sale price |
Promotion analysis |
| Discount |
Promotional measurement |
| Availability |
Stock monitoring |
| Store/location |
Geographic comparison |
| Product URL |
Source verification |
| Offer details |
Promotion tracking |
| Collection timestamp |
Historical analysis |
The biggest challenge is consistency. Grocery retailers may use different product
names, pack formats, category structures, and promotional descriptions.
A scalable data collection system must therefore perform extraction, normalization,
validation, matching, and historical storage before the information becomes useful for
competitive analysis. Real-Time Target Grocery Price Monitoring helps businesses maintain
consistent visibility into changing prices, promotions, and product availability for more timely
competitive analysis.
What Does a Daily Grocery Benchmarking Workflow Look Like?
A practical workflow connects collection with analysis:
Source discovery → Product extraction → SKU identification → Location mapping →
Price normalization → Promotion capture → Validation → Historical storage → Dashboard/API
delivery
This approach enables businesses to move from isolated observations to continuous
competitive intelligence.
For example, a pricing team may discover that a competitor has reduced the price of
a particular 1-liter beverage. Instead of recording only the new price, a structured system can
capture the previous price, current price, discount, location, availability, and collection
timestamp. Extract Lulu Hypermarket & Target Store Location Data to connect these pricing
observations with specific stores or markets, enabling more accurate location-level competitive
analysis.
That historical context makes the data much more useful for pricing decisions.
How Can Grocery Product Data Be Collected at Scale?
Large grocery catalogs require automated collection because manual monitoring
becomes difficult as product counts, locations, and update frequencies increase.
A structured scraping pipeline can collect product-level information from relevant
online retail sources and organize it into consistent records. Scrape Lulu Hypermarket & Target
Offers & Promotions Data to capture promotional details alongside product titles, brands,
categories, prices, discounts, pack sizes, availability, images, URLs, and other publicly
accessible attributes, depending on source accessibility.
The process generally involves four stages:
1. Source identification
Relevant product pages, category pages, search results, and store-level listings are
identified.
2. Automated extraction
Product and pricing information is collected according to predefined fields.
3. Data normalization
Product names, categories, units, currencies, pack sizes, and price formats are
standardized.
4. Validation and storage
Duplicate records and inconsistent values are checked before the dataset enters a
historical database.
What Can Businesses Monitor?
| Monitoring Area |
Example Insight |
| Product prices |
Current competitive price |
| Pack sizes |
500g vs. 1kg comparison |
| Discounts |
Discount depth |
| Availability |
In-stock/out-of-stock status |
| Categories |
Assortment differences |
| Brands |
Brand-level pricing |
| Historical records |
Price movement over time |
The important consideration is that price comparisons should account for pack size.
Comparing a 500g product against a 1kg product using only headline prices can create misleading
conclusions.
Unit-price normalization can solve this problem.
Illustrative example: If Product A costs $4 for 500g and Product B costs $7 for 1kg,
headline-price comparison favors Product A, but normalized unit pricing shows $8/kg versus
$7/kg. The second comparison provides a more meaningful pricing signal.
How Can Retailers Detect Price Changes Faster?
Frequent price collection allows pricing teams to identify changes closer to when
they occur. This is particularly valuable for fast-moving grocery categories where promotional
activity can alter the competitive landscape quickly.
A monitoring system can compare:
- Previous price vs. current price
- Regular price vs. promotional price
- Competitor price vs. target price
- Product availability changes
- Promotion start and end dates
- Store-level price differences
- SKU-level price movements
Historical data can also support automated change detection.
For example:
| SKU |
Previous Price |
Current Price |
Change |
Status |
| SKU-A |
$5.99 |
$5.49 |
-8.35% |
Price reduced |
| SKU-B |
$3.49 |
$3.49 |
0% |
No change |
| SKU-C |
$7.99 |
$8.49 |
+6.26% |
Price increased |
| SKU-D |
$4.99 |
$3.99 |
-20.04% |
Promotion |
How Does LuLu Hypermarket Data Scraping Support Monitoring?
LuLu Hypermarket Data
Scraping can support recurring product and pricing collection
where permitted by the relevant source terms and technical access conditions.
Instead of generating a single static file, recurring collection can create
historical snapshots.
This allows businesses to ask practical questions:
- Which SKUs changed price this week?
- Which categories experienced the largest price movement?
- Which products entered promotion?
- Which products became unavailable?
- Which competitor price changes require review?
The frequency of collection should depend on the business objective. Target Grocery
Price Data API can support scheduled delivery of structured pricing information, while daily
monitoring may be appropriate for regular competitive benchmarking and higher-frequency
collection may be relevant to highly dynamic categories.
How Can Store-Level Information Improve Competitive Analysis?
Price intelligence becomes more meaningful when it includes geographic context.
Retailers may operate across different cities, regions, or store formats. Product
availability and pricing can therefore vary by location. A centralized dataset can associate
product records with store or location information whenever that information is publicly
accessible.
Location-level fields may include:
- Store name
- City
- Region
- Country
- Postal/area information
- Store identifier
- Product availability
- Applicable price
- Collection date
- Product/SKU identifier
Why Does Location Matter?
Consider a retailer comparing grocery prices across five markets.
| Location |
Product Price |
Availability |
Promotion |
| Location A |
$4.99 |
In stock |
No |
| Location B |
$4.49 |
In stock |
Yes |
| Location C |
$4.99 |
Out of stock |
No |
| Location D |
$5.29 |
In stock |
No |
| Location E |
$4.79 |
In stock |
Yes |
A national average would hide important local differences.
Location-aware monitoring allows businesses to identify pricing clusters, promotion
concentration, and potential assortment differences.
It can also support geographic segmentation for pricing teams. Instead of asking,
"What is the competitor price?" businesses can ask, "What is the competitor price for this SKU
in this market and during this monitoring period?"
That is a much more actionable question.
How Can SKU-Level Data Improve Grocery Price Intelligence?
Product names alone are not always sufficient for reliable product matching. SKU
IDs, product identifiers, UPC/EAN values where accessible, URLs, brand names, pack sizes, and
other attributes can improve matching accuracy.
A structured Lulu Hypermarket SKU ID Dataset can provide a consistent product-level
foundation for monitoring.
For example:
| SKU ID |
Product |
Brand |
Pack Size |
Price |
Availability |
| SKU-001 |
Milk |
Brand A |
1L |
$3.29 |
In stock |
| SKU-002 |
Rice |
Brand B |
5kg |
$11.99 |
In stock |
| SKU-003 |
Coffee |
Brand C |
250g |
$6.49 |
Out of stock |
How Does Grocery Price Data Intelligence Work?
Grocery Price Data
Intelligence combines structured product records with historical
observations to reveal patterns that individual price points cannot show.
Businesses can use this information for:
- Price benchmarking
- Competitor assortment analysis
- Promotion measurement
- Category intelligence
- SKU-level tracking
- Price-change alerts
- Availability monitoring
- Historical trend analysis
- Pricing strategy research
One of the most important steps is product matching.
Suppose one retailer describes a product as "Premium Arabica Coffee 250g," while
another uses "Arabica Ground Coffee 0.25kg." A simple text comparison may treat them as
different products.
A normalization layer can compare brand, category, pack size, product identifiers,
and other attributes to improve matching.
What Should a SKU-Level Dataset Contain?
A robust dataset can include:
1. Unique SKU/product ID
2. Product name
3. Brand
4. Category
5. Subcategory
6. Pack size
7. Unit
8. Regular price
9. Promotional price
10. Discount
11. Availability
12. Store/location
13. Product URL
14. Timestamp
This structure creates a foundation for repeatable analysis rather than one-time
competitive checks.
How Can Retailers Track Grocery Promotions?
Promotions can significantly change the effective price customers see. Monitoring
only regular prices can therefore leave a major gap in competitive intelligence.
Offer monitoring can capture publicly available information such as:
- Discount percentage
- Sale price
- Original price
- Buy-one-get-one offers
- Multi-buy promotions
- Coupon information
- Promotional labels
- Offer periods
- Product eligibility
- Availability during promotion
A historical promotion dataset can answer questions that a basic price file cannot.
| Metric |
Business Question |
| Discount depth |
How aggressive is the promotion? |
| Promotion frequency |
How often is a SKU discounted? |
| Duration |
How long does an offer remain active? |
| Category coverage |
Which categories receive more promotions? |
| Brand coverage |
Which brands are promoted most often? |
| Price before/after |
What changed during the campaign? |
Why Should Promotions Be Separated From Base Prices?
Imagine a product normally priced at $10 that is temporarily offered at $7.
If a competitor-monitoring system records only $7, the business may incorrectly
treat that as the standard market price.
Historical records can distinguish:
Base price → Promotional price → Promotion ends → Base price restored
This distinction improves price benchmarking and helps teams understand whether a
competitive difference is structural or promotional.
Promotion monitoring can also support category managers looking for recurring
discount patterns.
For example, if a competitor repeatedly discounts a specific product category around
weekends or seasonal events, historical data can help identify that recurring pattern.
How Can APIs Turn Grocery Data Into Operational Intelligence?
An API-based delivery model allows structured grocery information to move directly
into internal applications, dashboards, databases, pricing engines, and analytics environments.
Instead of manually downloading spreadsheets, organizations can integrate recurring
datasets into their existing technology stack.
Potential API fields can include:
| API Field |
Example |
| Product ID |
SKU-10025 |
| Product name |
Grocery Product A |
| Brand |
Brand X |
| Category |
Beverages |
| Price |
$5.49 |
| Discount |
10% |
| Availability |
In stock |
| Location |
Store/market |
| Timestamp |
Collection time |
| Product URL |
Source page |
Illustrative API schema.
API delivery can support automated workflows such as:
Data collection → Validation → API → Internal database → Dashboard → Alerts →
Pricing review
This reduces the operational friction between data collection and decision-making.
For businesses comparing multiple retail environments, Lulu Hypermarket & Target
Price Benchmarking can therefore become part of a broader pricing intelligence workflow rather
than remaining a standalone research activity.
What Can an API-Powered System Support?
- Automated price feeds
- Scheduled data refreshes
- Historical databases
- Pricing alerts
- Competitor dashboards
- Category monitoring
- Product matching
- Store-level analytics
- Business intelligence integrations
The API approach is particularly useful for organizations that already have internal
pricing or analytics systems and need structured external retail data to feed those systems.
What Changed in Grocery Data Monitoring From 2020 to 2026?
Between 2020 and 2026, grocery and retail data operations increasingly moved toward
automated, structured, and recurring monitoring. In the earlier part of this period, many
competitive research workflows relied heavily on manual product checks, spreadsheets, periodic
audits, and fragmented information sources. As digital grocery channels expanded, businesses
increasingly needed more frequent visibility into product prices, availability, promotions, and
assortment.
By 2022–2023, automated extraction and scheduled datasets became more useful for
teams managing larger product catalogs. SKU-level organization also became increasingly
important because product names alone could create matching errors across retailers. From 2024
onward, organizations increasingly connected collected data with dashboards, APIs, alerting
systems, and business intelligence environments. By 2025–2026, the focus has increasingly
shifted from simply collecting retail data toward creating reusable intelligence pipelines that
support pricing, assortment, promotion, and geographic analysis. These developments do not mean
every retailer uses the same technology or collection frequency. Rather, they illustrate the
broader evolution from periodic market research toward more continuous data-driven monitoring.
This 2020–2026 overview describes technology and workflow evolution rather than
reporting a single universal industry statistic.
What Should a Grocery Pricing Dashboard Show?
A useful dashboard should turn thousands of product records into a small number of
decision-ready indicators.
Recommended dashboard components include:
Price Monitoring
Display current prices, previous prices, percentage changes, and price gaps.
Promotion Monitoring
Highlight active offers, discount depth, promotion duration, and products entering
or leaving promotion.
Availability Tracking
Show products that are in stock, unavailable, or experiencing availability changes.
Location Analysis
Compare the same SKU across stores, cities, regions, or markets.
Category Analysis
Identify categories with the highest number of price changes or promotions.
Historical Trends
Use time-series records to identify recurring pricing behavior.
A dashboard might contain the following KPI framework:
| KPI |
Purpose |
| Products monitored |
Catalog coverage |
| Price changes |
Competitive movement |
| Average price gap |
Benchmarking |
| Promotional SKUs |
Promotion visibility |
| Out-of-stock SKUs |
Availability intelligence |
| Locations monitored |
Geographic coverage |
| Daily records |
Data scale |
| Last collection time |
Data freshness |
Illustrative dashboard KPI structure.
The exact KPIs should be customized according to the client's category, market,
product universe, and monitoring frequency.
What Pain Points Does This Solve for Retail and FMCG Teams?
Pricing Teams
Pricing managers need current competitor information without spending hours
collecting and reconciling product pages.
Automated datasets can provide structured price comparisons and historical changes.
FMCG Brands
Brands can monitor how their products and competing products are represented across
digital retail channels.
This can support pricing, promotion, assortment, and market research.
Category Managers
Category teams can identify changes within specific product groups and investigate
emerging price gaps.
Market Researchers
Researchers can work with historical records instead of relying solely on snapshots.
Data and Analytics Teams
Technical teams can receive normalized datasets or API-based feeds that are easier
to integrate into existing analytical systems.
How Can Businesses Make Grocery Price Benchmarking More Actionable?
Collecting more data does not automatically create better intelligence. Businesses
should define the analytical objective before designing the dataset.
A practical framework is:
1. Define the Product Universe
Identify brands, categories, SKUs, pack sizes, and products that matter
commercially.
2. Establish Matching Rules
Use product IDs, brand, pack size, category, and other attributes to improve
cross-retailer matching.
3. Normalize Prices
Convert pack sizes and units where appropriate so comparisons are meaningful.
4. Capture Historical Snapshots
Store collection timestamps to distinguish current observations from historical
records.
5. Separate Regular and Promotional Prices
Avoid treating temporary discounts as permanent market prices.
6. Add Geographic Context
Associate pricing and availability with relevant locations wherever possible.
7. Deliver Data Where Teams Need It
Use CSV, Excel, databases, dashboards, or APIs depending on the workflow.
8. Create Alerts
Flag significant price changes, availability changes, or new promotions for human
review.
This approach helps transform raw grocery information into an operational process.
How Can Actowiz Solutions Help?
Lulu Hypermarket & Target Price Benchmarking can be supported through a customized
data collection and intelligence workflow designed around the client's product universe,
locations, fields, frequency, and delivery requirements.
Actowiz Solutions can help businesses build structured grocery datasets covering
relevant product, pricing, promotion, availability, SKU, and location attributes from publicly
accessible sources, subject to source availability and applicable terms.
The workflow can include:
Source discovery → Automated extraction → Data cleaning → Product matching →
Validation → Historical storage → Dashboard/API delivery
What Can Actowiz Solutions Deliver?
- Product-level grocery datasets
- Price monitoring datasets
- SKU-level records
- Store and location information
- Promotion and offer data
- Availability information
- Historical price records
- Competitive benchmarking datasets
- Structured API feeds
- Dashboard-ready data
- Scheduled recurring datasets
Target Grocery Data Scraping API
A Target Grocery Data Scraping API based
delivery workflow can make structured
grocery information available to internal analytics platforms, pricing applications, databases,
and reporting systems.
The solution can be configured around the client's required:
- Products
- Categories
- Retail sources
- Locations
- Data fields
- Collection frequency
- Historical requirements
- Output format
- API specifications
Data validation can also be incorporated into the workflow to identify missing
fields, duplicates, unexpected values, and product-matching inconsistencies before delivery.
The goal is to provide a repeatable data pipeline rather than a one-time
spreadsheet.
Conclusion
Daily grocery monitoring gives businesses a clearer view of changing prices,
promotions, product availability, SKU-level movements, and geographic differences. A structured
data pipeline makes these observations easier to compare, validate, store, and analyze over
time.
Lulu Hypermarket & Target Price Benchmarking can support pricing teams, FMCG brands,
retailers, and researchers that need recurring competitive visibility across grocery products
and locations.
The most valuable system is not necessarily the one collecting the largest volume of
information. It is the one collecting the right products, fields, locations, and historical
observations at the right frequency and delivering them in a format teams can use.
Actowiz Solutions can design customized retail data collection workflows that
connect grocery product information with dashboards, databases, APIs, and analytical systems.
Ready to turn changing grocery prices into structured competitive intelligence?
Contact Actowiz Solutions to discuss your grocery data collection and benchmarking requirements!
Web Scraping, Mobile App Scraping, and a Real-time
dataset can be incorporated into a customized
data workflow based on the required sources, fields, frequency, and delivery format.
You can also reach us for all your mobile app
scraping, data collection, web scraping, and instant data scraper service requirements!

 By industry🏷 By platform🌐 By market
 Pricing & Promotions
MAP Violations Brand Protection Counterfeit Detection Price Intelligence AI HOT Data Intelligence
Pricing & Promotions
MAP Violations Brand Protection Counterfeit Detection Price Intelligence AI HOT Data Intelligence Brand & Intelligence
Share of Search Content Audit & PDP Reviews & Ratings Retail Media Buy Box Monitoring Social Commerce HOT Live Commerce NEW Agentic Commerce NEW
Brand & Intelligence
Share of Search Content Audit & PDP Reviews & Ratings Retail Media Buy Box Monitoring Social Commerce HOT Live Commerce NEW Agentic Commerce NEW Digital Shelf & Search
Assortment Planning Competitive Benchmarking Product Availability Q-Commerce NEW
Digital Shelf & Search
Assortment Planning Competitive Benchmarking Product Availability Q-Commerce NEW AssortmentE-commerce Intelligence Hyperlocal Insights POI & Store Locator DTC Brand Analytics NEW
 For Retailers
 E-Commerce Dashboard
 Flipkart Insights (Live) #1
 Grocery Intelligence
.svg) Grocery Price (U.S.)
Grocery Price (U.S.)
.svg) Quick Commerce (India) HOT
Quick Commerce (India) HOT
 Food & Restaurant
 Fashion Intelligence
 Automotive
 Travel & Hospitality
 Real Estate
 Food Delivery Intelligence NEW
 OTT & Streaming NEW
 Fuel & EV Charging Price Tracker NEW
 By Use Case
 Pricing Intelligence
 Digital Shelf Analytics
 MAP Monitoring HOT
 Cross-Border Price Parity NEW
 Share of Search
 Review Sentiment
 Kitchen Market Gaps NEW
 Dynamic Pricing / AI Repricing NEW
 Promotions & Deals Alerts NEW
 B2B / POI & Lead Data NEW
 AI Search Visibility Dashboard NEW
 Baby Products on Quick Commerce NEW
 Hotel & Flight Rate Parity NEW
 By Region🇮🇳 India 🇺🇸 USA 🇦🇪 Middle East 🇬🇧 UK 🇦🇺 Australia 🌏 SE Asia 🇪🇺 Europe 🌎 LATAMIndia
 Flipkart Real-Time Insights
 Quick Commerce — Zepto · Blinkit
 Pincode Price Tracker
Middle East
Pincode Price Tracker
Middle East GCC Q-Commerce — Talabat · Noon NEW
UK & Australia
GCC Q-Commerce — Talabat · Noon NEW
UK & Australia UK Grocery — Tesco, Sainsbury's, Asda
 AU Grocery — Coles & Woolworths NEW
 Marketplace Scrapers
Amazon API TikTok Shop API HOT Uber Eats API Airbnb API Zepto / Blinkit API Instacart API NEW Talabat API NEW
Marketplace Scrapers
Amazon API TikTok Shop API HOT Uber Eats API Airbnb API Zepto / Blinkit API Instacart API NEW Talabat API NEW Developer APIsWeb Extract API Reviews API SERP API Pricing Webhook NEW
 Universal APIsStreaming Crawl API Scheduler Realtime Alerts Webhook Delivery 🐍 Python SDK 💚 Node.js SDK
 Delivery & SDKs
 Knowledge Center
Digital Shelf Playbook MAP Compliance Guide Pricing Intel Guide Scraping Compliance TikTok Shop Guide NEW Cross-Border Guide NEW
Knowledge Center
Digital Shelf Playbook MAP Compliance Guide Pricing Intel Guide Scraping Compliance TikTok Shop Guide NEW Cross-Border Guide NEW Guides & Playbooks
🎉 Seasonal & event tracking NEWBlack Friday pricing report Festive season, India Ramadan, GCC grocery All seasonal reportsSample Datasets HOT ROI Calculator NEW API Postman Collection Demo Dashboards Free API Playground NEW Press Kit
Guides & Playbooks
🎉 Seasonal & event tracking NEWBlack Friday pricing report Festive season, India Ramadan, GCC grocery All seasonal reportsSample Datasets HOT ROI Calculator NEW API Postman Collection Demo Dashboards Free API Playground NEW Press Kit Downloads & Tools
Trust Center About Us FAQs Careers
Downloads & Tools
Trust Center About Us FAQs Careers Trust & CompanyRetail shelf research NEWRetail shelf research






































 4.8/5 Average Rating
 50+ Video Testimonials
 92% Client Retention
 50+ Countries Served