Core services
Enterprise Data Extraction

Scalable web, app and AI-powered collection across 40+ countries.

All 58 services →
New 2026
AI Training Data

Corpus building with provenance and opt-out compliance.

Learn more →
Free pilot
24-hour sample

We run collection on your own sources before you commit.

Get a sample →
58Services
40+Countries
DEVELOPER

Ready-Made Scrapers

Pre-built for top platforms. Self-serve, no setup.

View All →
TRY FREE

API Playground

Test endpoints instantly. No credit card.

Start Free →
28Tools
2SDKs
icons Delivery & SDKs
Streaming Crawl API Scheduler Realtime Alerts Webhook Delivery 🐍 Python SDK 💚 Node.js SDK
Need it managed instead?

Fixed monthly retainer, named engineer, no per-request metering.

Managed Data API →
HOT

Case Studies

How brands use Actowiz, with named outcomes.

Read →
FREE

Sample Datasets

Real output, no signup.

Download →
NEW

ROI Calculator

Model the return on a data engagement.

Calculate →
Home Depot India Weekly E-Commerce Dataset

Introduction

A shopper searches for your product, sees one price on Amazon, a lower one on Walmart, and a third on your own store. Many will buy from the cheapest channel. Others will ask a retailer to match it. Either way, the gap costs you margin or a retail relationship.

Omnichannel price monitoring means tracking the same product's price, promotions, seller and stock across every US channel – Amazon, Walmart, Target, Best Buy, retailer apps and your own D2C store – matched by UPC or model number, so you can measure price parity, find the channel that broke it and fix gaps quickly.

This guide is for US brand e-commerce and pricing teams. It covers what parity really means, why gaps appear, how channels differ, which fields to capture, how to match products, a simple parity index, alerting, use cases, compliance, and build vs buy.

Last updated: 9 October 2026 | Author: Actowiz Solutions Data Team

What does price parity mean across US channels?

Home Depot India Weekly E-Commerce Dataset

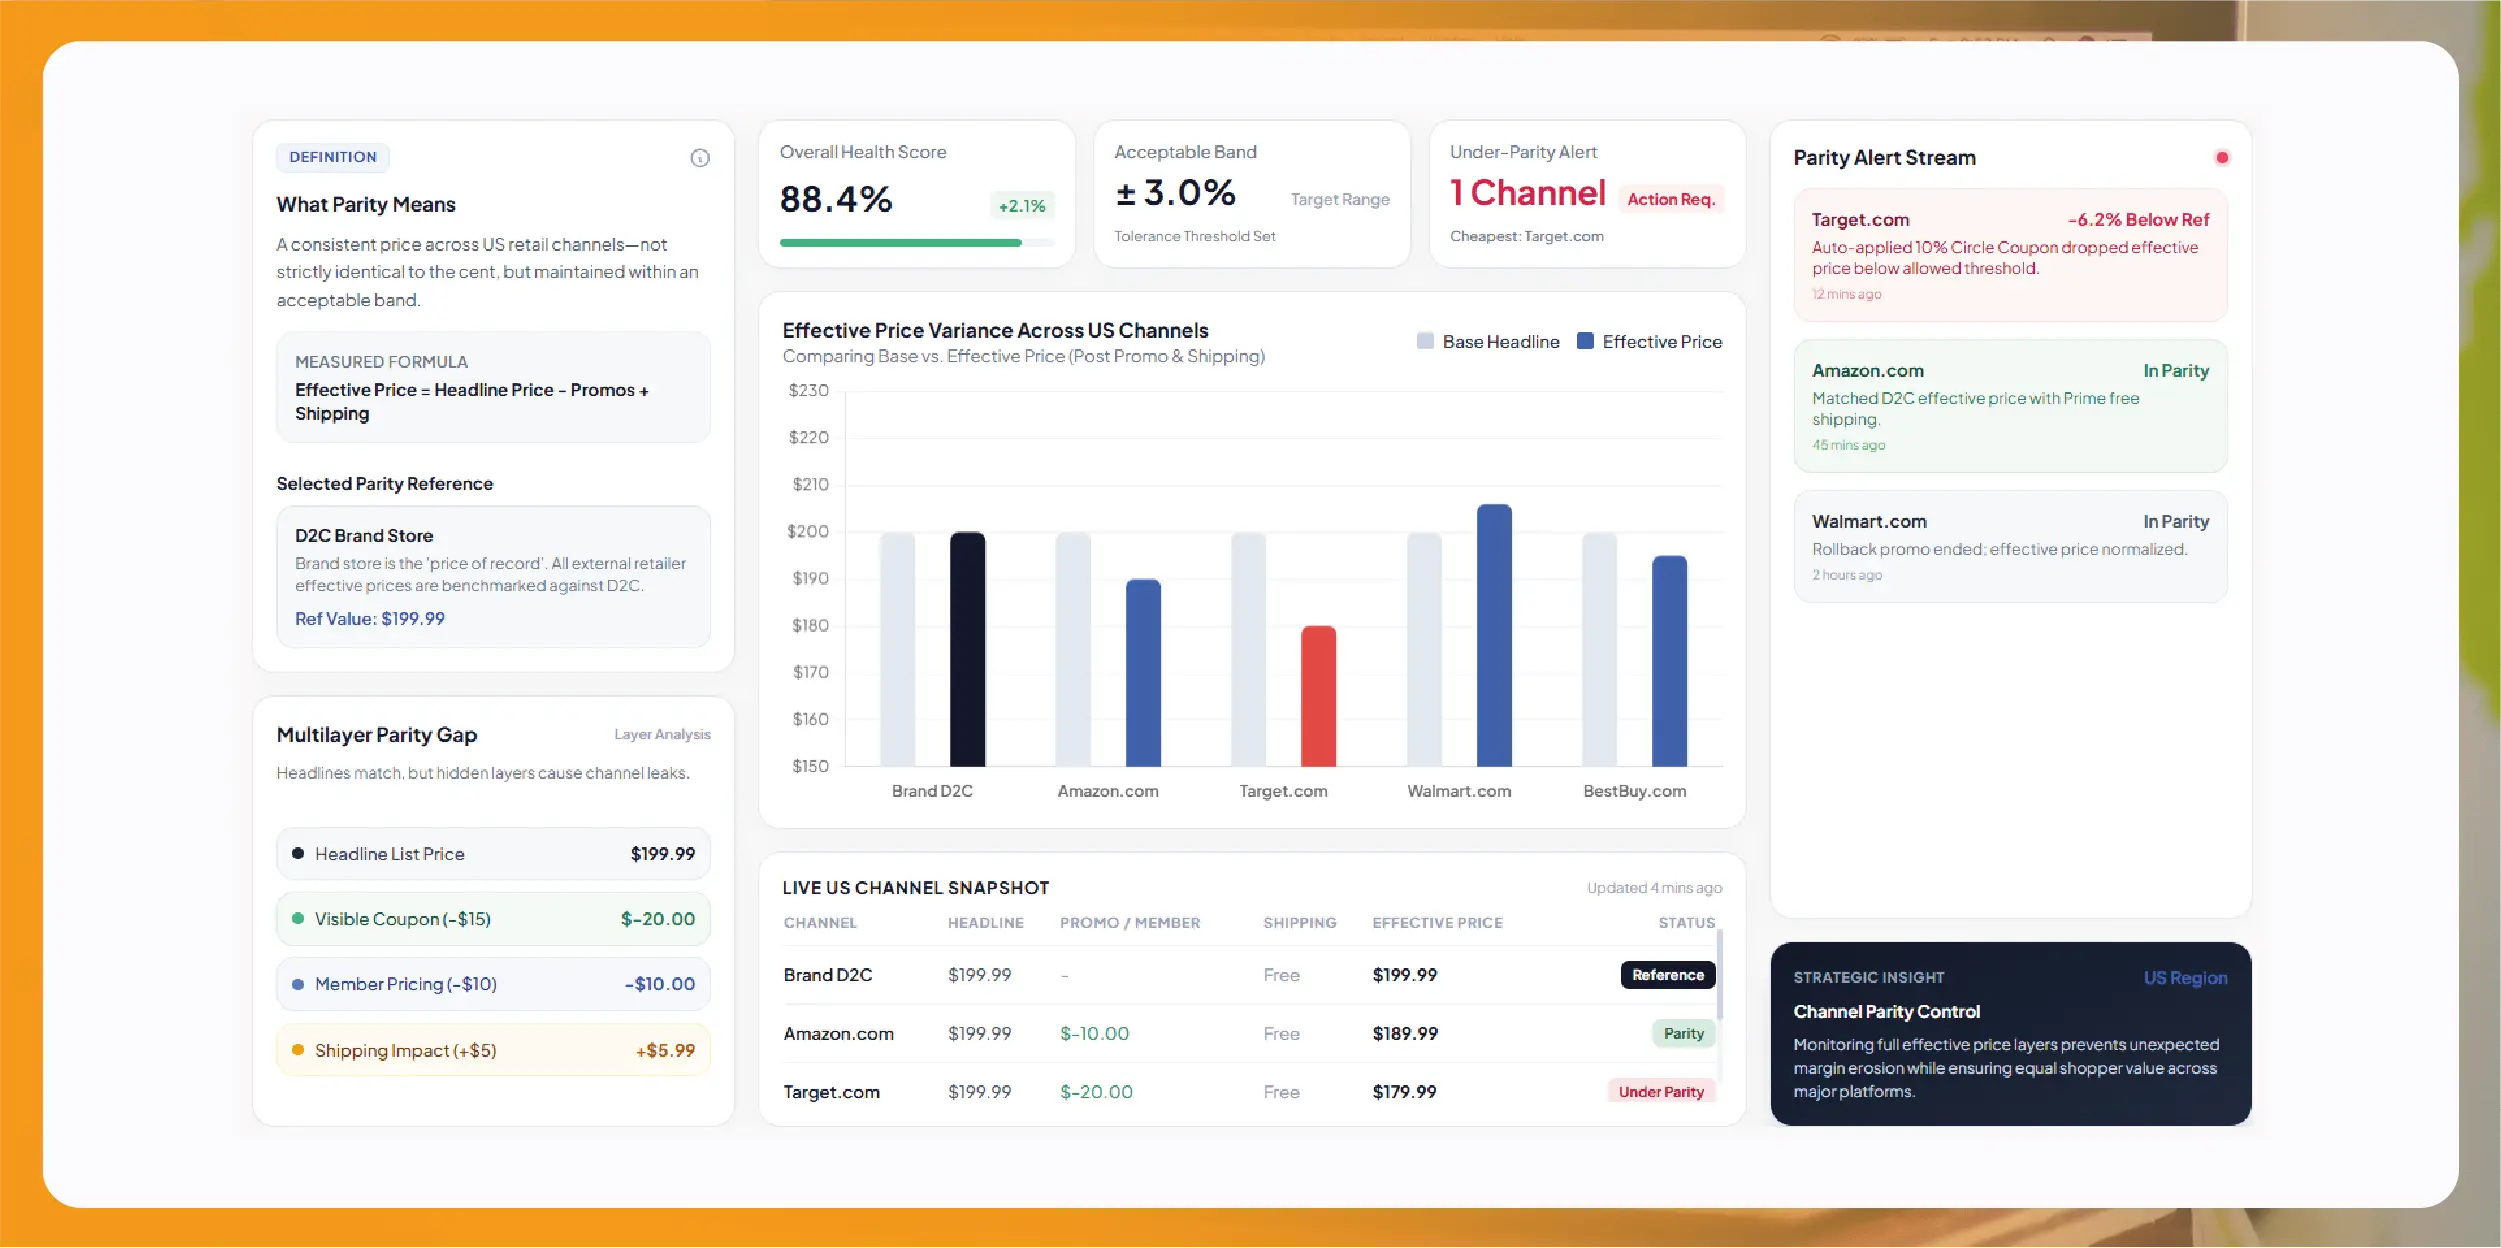
Price parity means a shopper sees a consistent price for the same product wherever they shop – not necessarily identical to the cent, but within a range your brand considers acceptable. It is measured on the effective price, after visible promotions and shipping.

Parity is relative to a reference. Most brands choose one of three:

  • Your D2C price – common when the brand store is the "price of record".
  • Your MSRP – a neutral reference for discount depth.
  • The lowest authorised retailer price – useful when you care most about which channel is leading prices down.

Parity also has layers. A product can show the same list price on four sites while one channel is cheaper because of a coupon, a member price or free shipping. Omnichannel price monitoring has to capture those layers, not only the headline number.

Why do price parity gaps happen?

Gaps usually come from forces outside your direct control: third-party sellers, automated repricing, retailer promotions and price-match policies. Knowing the cause tells you who to talk to.

  • Third-party marketplace sellers. On Amazon and Walmart, many sellers can offer the same item. A low-priced seller can pull the visible price down even when every retailer is behaving. Who holds the featured offer matters – we cover that separately in Amazon Buy Box monitoring.
  • Algorithmic repricing. Retailers and sellers reprice automatically against each other, so one drop can spread across channels within hours.
  • Retailer promotions and memberships. Circular deals, member-only prices and app-only offers create gaps that are hard to see from a desktop browser.
  • Price-match policies. Retailers' public policies shape how gaps spread. Best Buy's Price Match Guarantee matches listed "Qualified Competitors" for an identical model number and colour, and excludes products sold by third-party marketplace sellers. Target's Price Match Guarantee covers Target's own prices across Target.com, stores and the app within 14 days of purchase, and does not name other retailers. Policies change, so check them regularly.
  • Your own D2C offers. Site-wide sales, bundles or first-order codes on your store can be the very gap retailers react to.

How do Amazon, Walmart, Target, Best Buy and D2C differ?

Each US channel shows price differently, so each needs its own collection rules. The table below summarises what to watch.

Channel How price is shown Main parity risks What to capture
Amazon Featured offer plus other seller offers; coupons; Subscribe & Save 3P sellers, coupons, featured-offer changes ASIN, all offers, seller, fulfilment, coupon, shipping
Walmart.com Walmart first-party and Marketplace sellers on one item page 3P sellers, rollbacks, pickup vs delivery prices Item ID, seller, price, rollback flag, fulfilment option
Target.com and app Target price, Target Circle deals, Target Plus partner listings Circle offers, app-only deals, store vs online TCIN, price, Circle offer text, seller type, ZIP/store
Best Buy Best Buy price, member pricing, open-box and marketplace offers Member prices, open-box, deal events Best Buy SKU, model number, price, condition, member price flag
Brand D2C (Shopify or similar) Your list price, discount codes, bundles Site-wide sales, first-order codes Variant ID, price, compare-at price, promo banner text
Retailer apps Often mirrors web, with app-only offers Offers invisible on desktop Price and promo, where publicly visible without login

For a broader step-by-step on the three largest marketplaces, see our guide on tracking prices and assortment across Amazon, Walmart and Target.

Which data fields do you need?

Capture enough to calculate an effective price and to prove what the shopper saw. These nine fields cover most programmes.

  • Brand SKU and UPC/GTIN – your master identifiers.
  • Channel product ID – ASIN, Walmart item ID, Target TCIN, Best Buy SKU, Shopify variant ID.
  • Seller and seller type – retailer first-party vs third-party seller.
  • List and sale price – including "was" or compare-at price.
  • Promotion – coupon, member price, bundle, rollback or circular deal text.
  • Shipping and fulfilment – shipping cost, pickup vs delivery, free-shipping thresholds.
  • Effective price – sale price minus visible discounts plus shipping.
  • Stock status and condition – in stock, limited, out of stock; new vs open box.
  • Timestamp, ZIP code and screenshot – when and where the price was seen, plus evidence.

How do you match the same product across channels?

Match first on standard identifiers, then confirm with model number and attributes. Matching is the step that makes or breaks parity data.

  • UPC / GTIN. GS1 US explains that a GTIN is a globally unique number for a trade item, and that the 12-digit UPC is the GTIN-12 format used mainly in North America. Where a channel exposes the UPC, it is the strongest match key.
  • Model and manufacturer part number. Essential for electronics and appliances, where retailers may not show the UPC.
  • Variant attributes. Size, colour, pack count and bundle contents. A 2-pack at one retailer and a single unit at another is not a parity gap – normalise to unit price.
  • Title and image similarity. Useful as a final check, never as the only rule.
  • Human review for new or high-value matches, then lock the match.

Our article on product matching across marketplaces goes deeper into EAN and model-number matching.

How do you measure price parity? A simple index

A price parity index turns many prices into one number per SKU and channel. It is easy to explain to sales and finance teams.

Price Parity Index = (channel effective price ÷ reference price) × 100

  • 100 means exact parity with your reference.
  • Below 100 means the channel is cheaper (for example, 94 = 6% below reference).
  • Above 100 means the channel is more expensive.

Set a tolerance band – for example 97 to 103 – and only alert outside it. You can roll the index up by channel (average across SKUs), by category, or by week to see trends.

SKU Reference (D2C) Amazon Walmart Target Best Buy
Example SKU A 100 Pending Pending Pending Pending
Example SKU B 100 Pending Pending Pending Pending

Two extra measures help: time out of parity (hours a SKU spent outside the band) and first mover (which channel dropped first). The first mover is usually where the conversation should start.

How should alerting work?

Alert on meaningful, confirmed gaps – not every price twitch. A good set-up has three levels.

  • Real-time alerts for hero SKUs that leave the tolerance band, confirmed by a recheck.
  • Daily digest of all gaps, grouped by channel and first mover.
  • Weekly report with parity index trends, time out of parity and repeat third-party sellers.

Each alert should include the SKU, channel, seller, effective price, reference price, index, timestamp and screenshot, so the account manager can act without re-checking.

Use cases for omnichannel price monitoring

  • Retail account management – show a retailer exactly when and where a competitor channel dropped first.
  • D2C pricing decisions – check that your store promotions are not starting gaps that retailers then match.
  • Launch and event pricing – monitor parity hourly around launches, Prime-style events and holiday sales.
  • Marketplace seller control – spot third-party sellers pulling Amazon or Walmart prices below other channels; see a related US DTC brand price monitoring case study.
  • Finance and forecasting – track how much of your revenue sells outside your target price band.

Compliance basics

Collect only public business data: prices, offers, promotions, seller business names and stock. Respect each site's terms and applicable law, and do not bypass logins, CAPTCHAs or paywalls – which also means member-only prices are captured only where publicly displayed.

Use parity data to understand the market and manage your own pricing and channel decisions. In the US, the FTC's guidance on manufacturer-imposed requirements explains that competitors must set prices independently and that vertical price programmes are judged under a rule of reason. Agree any pricing policy with legal counsel.

Build vs buy

Building works for a handful of SKUs on two or three channels. Once you add more retailers, ZIP-level prices, frequent refreshes and product matching, a managed service is usually more practical.

Factor Build Buy (managed)
Channel coverage Each retailer built and maintained separately Existing collectors for major US retailers
Product matching Your team builds UPC/model rules Matching plus QA, with your sign-off
Refresh rate Limited by your infrastructure Configured per SKU tier
Evidence Screenshots must be built and stored Typically included
Delivery Internal scripts and spreadsheets API, files or dashboard

Actowiz also offers real-time price monitoring for Walmart and Amazon that can extend to Target, Best Buy and your D2C store.

Frequently Asked Questions

What is omnichannel price monitoring?

Omnichannel price monitoring is tracking one product's price, promotions, seller and stock across every channel where it is sold – marketplaces, retailers, apps and the brand's own store. Products are matched by UPC or model number so prices compare like for like, and gaps against a reference price trigger alerts for pricing or account teams.

How do you calculate a price parity index?

Divide the channel's effective price by your reference price and multiply by 100. A result of 100 means exact parity, below 100 means the channel is cheaper, and above 100 means it is more expensive. Most brands set a tolerance band, such as 97 to 103, and only alert when a channel moves outside it.

Why is my product cheaper on Amazon than on my own website?

Common reasons include third-party sellers undercutting, automated repricing, coupons, or retailer promotions. Sometimes the retailer is reacting to another channel's lower price. Capture all offers, seller types and promotions with timestamps, so you can see which channel or seller moved first and decide how to respond under your own pricing policy.

Does Best Buy price match Amazon?

Best Buy's public Price Match Guarantee matches retailers on its "Qualified Competitors" list for an identical, immediately available new product, and excludes items sold by third-party marketplace sellers. Check Best Buy's current Qualified Competitors list for which retailers are included, because the list and conditions can change.

How often should omnichannel prices be checked?

Check hero SKUs several times a day on Amazon and Walmart, where repricing is fast, and daily for most other SKUs and channels. Increase frequency around launches, holiday events and retailer promotions. Weekly checks are usually enough for slow-moving catalogues, but they will miss short-lived gaps.

Share 10–20 SKUs with their UPCs and the US channels you sell on, and we will return a sample of matched prices and parity index values. Contact our sales team to get started.
Contact Us Today!

You can also reach us for all your mobile app scraping, data collection, web scraping, and instant data scraper service requirements!

Social Proof That Converts

Trusted by Global Leaders Across Q-Commerce, Travel, Retail, and FoodTech

Our web scraping expertise is relied on by 4,000+ global enterprises including Zomato, Tata Consumer, Subway, and Expedia — helping them turn web data into growth.

4,000+ Enterprises Worldwide
50+ Countries Served
20+ Industries
Join 4,000+ companies growing with Actowiz →
Real Results from Real Clients

Hear It Directly from Our Clients

Watch how businesses like yours are using Actowiz data to drive growth.

▶
1 min
★★★★★
"Actowiz Solutions offered exceptional support with transparency and guidance throughout. Anna and Saga made the process easy for a non-technical user like me. Great service, fair pricing!"
TG
Thomas Galido
Co-Founder / Head of Product at Upright Data Inc.
▶
2 min
★★★★★
"Actowiz delivered impeccable results for our company. Their team ensured data accuracy and on-time delivery. The competitive intelligence completely transformed our pricing strategy."
II
Iulen Ibanez
CEO / Datacy.es
▶
1:30
★★★★★
"What impressed me most was the speed — we went from requirement to production data in under 48 hours. The API integration was seamless and the support team is always responsive."
FC
Febbin Chacko
-Fin, Small Business Owner
icons 4.8/5 Average Rating
icons 50+ Video Testimonials
icons 92% Client Retention
icons 50+ Countries Served

Join 4,000+ Companies Growing with Actowiz

From Zomato to Expedia — see why global leaders trust us with their data.

Why Global Leaders Trust Actowiz

Backed by automation, data volume, and enterprise-grade scale — we help businesses from startups to Fortune 500s extract competitive insights across the USA, UK, UAE, and beyond.

icons
7+
Years of Experience
Proven track record delivering enterprise-grade web scraping and data intelligence solutions.
icons
4,000+
Projects Delivered
Serving startups to Fortune 500 companies across 50+ countries worldwide.
icons
200+
In-House Experts
Dedicated engineers across scrapers, AI/ML models, APIs, and data quality assurance.
icons
9.2M
Automated Workflows
Running weekly across eCommerce, Quick Commerce, Travel, Real Estate, and Food industries.
icons
270+ TB
Data Transferred
Real-time and batch data scraping at massive scale, across industries globally.
icons
380M+
Pages Crawled Weekly
Scaled infrastructure for comprehensive global data coverage with 99% accuracy.

AI Solutions Engineered
for Your Needs

→
LLM-Powered Attribute Extraction: High-precision product matching using large language models for accurate data classification.
→
Advanced Computer Vision: Fine-grained object detection for precise product classification using text and image embeddings.
→
GPT-Based Analytics Layer: Natural language query-based reporting and visualization for business intelligence.
→
Human-in-the-Loop AI: Continuous feedback loop to improve AI model accuracy over time.
icons Product Matching icons Attribute Tagging icons Content Optimization icons Sentiment Analysis icons Prompt-Based Reporting

Connect the Dots Across
Your Retail Ecosystem

We partner with agencies, system integrators, and technology platforms to deliver end-to-end solutions across the retail and digital shelf ecosystem.

icons
Analytics Services
icons
Ad Tech
icons
Price Optimization
icons
Business Consulting
icons
System Integration
icons
Market Research
Become a Partner →

Popular Datasets — Ready to Download

Browse All Datasets →
icons
Amazon
eCommerce
Free 100 rows
icons
Zillow
Real Estate
Free 100 rows
icons
DoorDash
Food Delivery
Free 100 rows
icons
Walmart
Retail
Free 100 rows
icons
Booking.com
Travel
Free 100 rows
icons
Indeed
Jobs
Free 100 rows

Latest Insights & Resources

View All Resources →
thumb
Blog

Request a Sample Web Scraping Dataset: Fields, Freshness and Coverage Before You Buy (2026)

Request a sample web scraping dataset for retail, quick commerce, food delivery or travel. Check fields, freshness and coverage first.

thumb
Case Study

How Sensitive Skin Skincare Product Data API Helps Brands Track Cleansers, Serums, Moisturizers, and Sunscreens

Sensitive Skin Skincare Product Data API helps brands track cleansers, serums, moisturizers, and sunscreens with structured product data.

thumb
Report

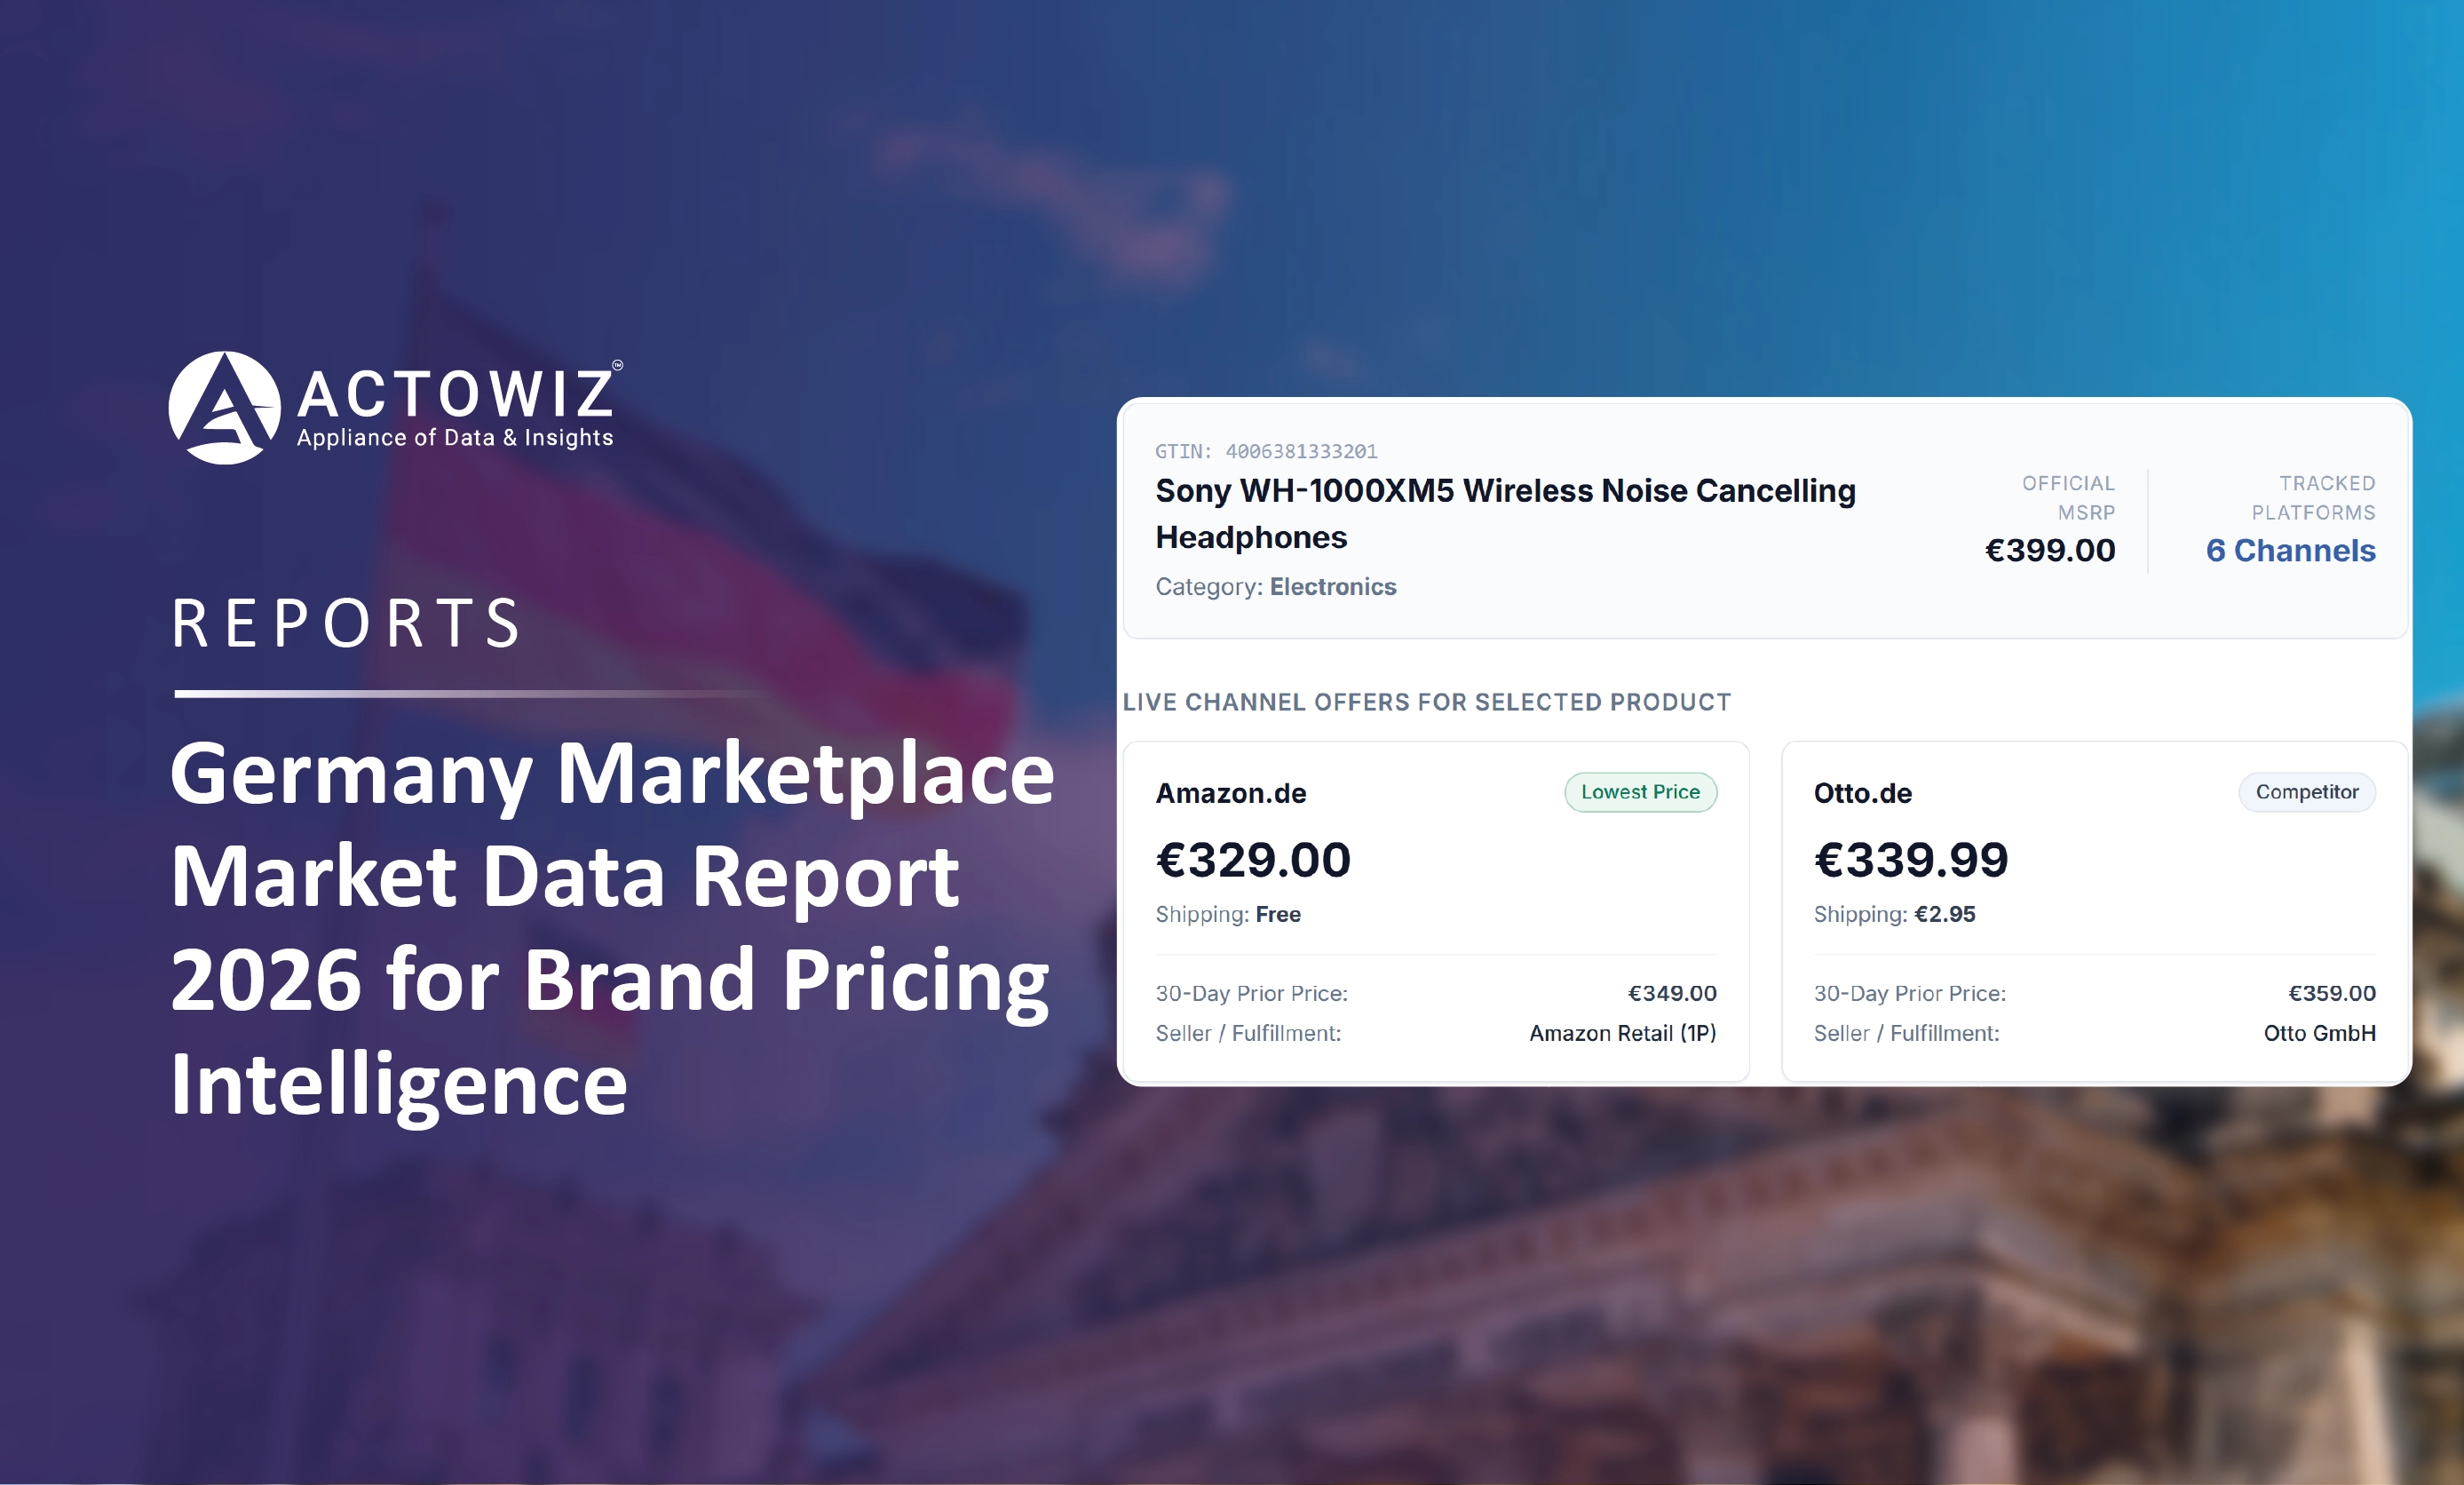
Germany Marketplace Market Data Report 2026 for Brand Pricing Intelligence

German marketplace data report 2026: online retail size, Amazon.de, Otto, Kaufland and Zalando price signals, PAngV rules and peak seasons.

Start Where It Makes Sense for You

Whether you're a startup or a Fortune 500 — we have the right plan for your data needs.

icons
Enterprise
Book a Strategy Call
Custom solutions, dedicated support, volume pricing for large-scale needs.
icons
Growing Brand
Get Free Sample Data
Try before you buy — 500 rows of real data, delivered in 2 hours. No strings.
icons
Just Exploring
View Plans & Pricing
Transparent plans from $500/mo. Find the right fit for your budget and scale.
Get in Touch
Let's Talk About
Your Data Needs
Tell us what data you need — we'll scope it for free and share a sample within hours.
  • icons
    Free Sample in 2 HoursShare your requirement, get 500 rows of real data — no commitment.
  • icons
    Plans from $500/monthFlexible pricing for startups, growing brands, and enterprises.
  • icons
    US-Based SupportOffices in New York & California. Aligned with your timezone.
  • icons
    ISO 9001 & 27001 CertifiedEnterprise-grade security and quality standards.
Request Free Sample Data
Fill the form below — our team will reach out within 2 hours.
+1 ▼
✓ Free 500-row sample · No credit card · Response within 2 hours

Request Free Sample Data

Our team will reach out within 2 hours with 500 rows of real data — no credit card required.

+1 ▼
✓ Free 500-row sample · No credit card · Response within 2 hours