Core services
Enterprise Data Extraction

Scalable web, app and AI-powered collection across 40+ countries.

All 58 services →
New 2026
AI Training Data

Corpus building with provenance and opt-out compliance.

Learn more →
Free pilot
24-hour sample

We run collection on your own sources before you commit.

Get a sample →
58Services
40+Countries
DEVELOPER

Ready-Made Scrapers

Pre-built for top platforms. Self-serve, no setup.

View All →
TRY FREE

API Playground

Test endpoints instantly. No credit card.

Start Free →
28Tools
2SDKs
icons Delivery & SDKs
Streaming Crawl API Scheduler Realtime Alerts Webhook Delivery 🐍 Python SDK 💚 Node.js SDK

Need it managed instead?

Fixed monthly retainer, named engineer, no per-request metering.

Managed Data API →

Introduction

The hospitality market in Phu Quoc has moved from pandemic disruption to rapid international expansion, making accurate competitive intelligence increasingly important for hotels, travel platforms, investors, and tourism analysts. The Phu Quoc Hotel Pricing & Availability Benchmark Report provides a structured framework for understanding hotel rate movements, room availability, property positioning, amenities, and demand patterns across the island.

Phu Quoc's tourism recovery has been particularly strong. In 2020, visitor activity was heavily affected by COVID-19, although domestic tourism began recovering toward the end of the year. By June 2022, the island had more than 700 accommodation establishments and over 24,000 rooms, while receiving approximately 1.4 million visitors during the first six months.

The destination subsequently entered a stronger growth phase. Phu Quoc welcomed more than 5.9 million visitors in 2024, including 962,449 international visitors, while tourism revenue exceeded VND 21.17 trillion. In the first 11 months of 2025, the island received approximately 7.6 million visitors, up 35% year over year, including nearly 1.59 million international visitors.

For businesses operating in this environment, Travel & Hospitality Data Scraping enables systematic collection of hotel rates, room availability, property information, amenities, ratings, and competitive signals. Instead of relying on occasional manual checks, businesses can establish a continuous data pipeline that supports pricing decisions and market analysis.

Market Development Snapshot

Year Phu Quoc Tourism / Market Indicator Benchmark Significance
2020 288,634 visitors in November COVID-era disruption with domestic recovery beginning
2021 International reopening began in November Controlled restart of international tourism
2022 ~1.4M visitors in H1; 24,000+ rooms Strong post-pandemic recovery
2023 ~5M visitors reported for 2022; occupancy reached 80–90% around the recovery period Expanding accommodation demand
2024 5.9M+ visitors; 962,449 international Strong international recovery
2025 ~7.6M visitors in first 11 months 35% YoY growth
2026 Forward-looking benchmark year Greater need for automated rate and availability intelligence

Note: Figures represent reported destination-level indicators from different reporting periods; they should not be interpreted as a single consistent annual series. 2026 is treated as a forward-looking benchmarking period.

Building a Reliable Competitive Pricing Framework

Crex Data Scraping - Solving Accuracy and Data Consistency Issues in Cricket Analytics

The growth of Phu Quoc's accommodation ecosystem creates a complex pricing environment. Hotels compete across luxury resorts, international chains, boutique properties, villas, budget accommodation, and family-focused properties. This makes Phu Quoc Hotel Rate Data Intelligence valuable for identifying how rates differ by location, property class, room type, booking window, and travel period.

A major advantage of automated collection is the ability to create a historical rate database. Instead of viewing today's price as an isolated figure, analysts can compare current prices against previous observations and competitor benchmarks. This supports decisions around minimum rates, promotional pricing, premium positioning, and seasonal campaigns.

AI-Powered Web Scraping can further improve the process by identifying structured information across large volumes of hotel listings and helping normalize property names, room categories, prices, and availability signals. AI-assisted classification can also support hotel matching when the same property appears under slightly different names across platforms.

Year Market Signal Intelligence Opportunity
2020 Domestic travel recovery observed late in year Establish baseline pricing history
2021 International reopening started in November Track reopening-related rate changes
2022 700+ accommodation facilities and 24,000+ rooms reported Expand competitive property coverage
2023 High occupancy reported during strong demand periods Compare peak-season pricing
2024 5.9M+ visitors Monitor broader demand-driven pricing
2025 7.6M visitors in first 11 months Increase monitoring frequency
2026 Growth-oriented market Build predictive benchmark models

The key value lies in transforming raw hotel observations into comparable metrics. Businesses can calculate median rates by star category, average rate differences between competitors, price premiums for beachfront properties, and changes in promotional intensity. This creates a stronger foundation for revenue management and competitive strategy.

Tracking Room Supply and Competitive Availability

Hotel pricing cannot be evaluated independently from availability. A room priced at a premium may indicate strong demand, limited inventory, or a property's positioning strategy. Therefore, Phu Quoc Hotel Availability Data Tracking should be analyzed alongside room prices, stay dates, room categories, cancellation policies, and booking conditions.

The island's accommodation supply has expanded significantly. In June 2022, authorities reported more than 700 accommodation facilities and over 24,000 rooms. At the same time, many properties were reportedly filled to capacity during periods of strong visitor flows.


Availability monitoring can reveal when competitors are approaching full occupancy, when room categories disappear from booking channels, and when properties release additional inventory. These observations can be converted into supply-pressure indicators.

Year Available Market Indicator Implication
2020 Domestic demand returned during late year Availability remained affected by pandemic conditions
2021 International reopening began Limited reopening inventory
2022 24,000+ rooms reported Large accommodation base
2023 80–90% occupancy reported during strong periods High supply pressure
2024 5.9M+ visitors Greater demand for accommodation
2025 7.6M visitors in first 11 months Rising pressure on room inventory
2026 Forward-looking monitoring period Need for continuous availability tracking

Availability data becomes particularly useful when segmented by geography. Properties around Long Beach, Duong Dong, northern resort areas, and southern Phu Quoc can experience different demand patterns. A benchmark system can therefore compare availability by destination zone rather than treating the island as one homogeneous market.

For revenue managers, the combination of rate and inventory data helps answer practical questions: Are competitors raising prices because rooms are selling quickly? Are lower prices associated with excess supply? Which room categories remain available when standard rooms disappear? These insights can support more precise pricing decisions.

Turning Hotel Listings Into Real-Time Market Signals

For travel businesses, the ability to Scrape Phu Quoc Hotel Listings Data creates a scalable way to monitor the accommodation landscape. Instead of manually reviewing individual properties, automated extraction can collect hotel names, locations, ratings, room categories, prices, amenities, policies, and availability information at regular intervals.

This becomes even more valuable when combined with Real-Time Price Monitoring. Hotel prices can change according to demand, weekends, holidays, booking lead time, inventory levels, promotional campaigns, and competitor actions. A historical dataset allows these changes to be measured rather than simply observed.

Year Tourism Indicator Recommended Monitoring Approach
2020 November recorded 288,634 visitors Weekly historical snapshots
2021 International reopening Monitor reopening-period changes
2022 1.4M visitors in H1 Increase peak-period tracking
2023 Strong occupancy periods Daily competitor monitoring
2024 5.9M+ visitors Automated rate benchmarking
2025 35% YoY visitor growth in first 11 months Near-real-time monitoring
2026 Continued market expansion expected Continuous automated intelligence

A mature scraping program should also normalize prices. Different platforms may display taxes, service charges, discounts, breakfast inclusions, or cancellation conditions differently. Standardization makes comparisons more meaningful.

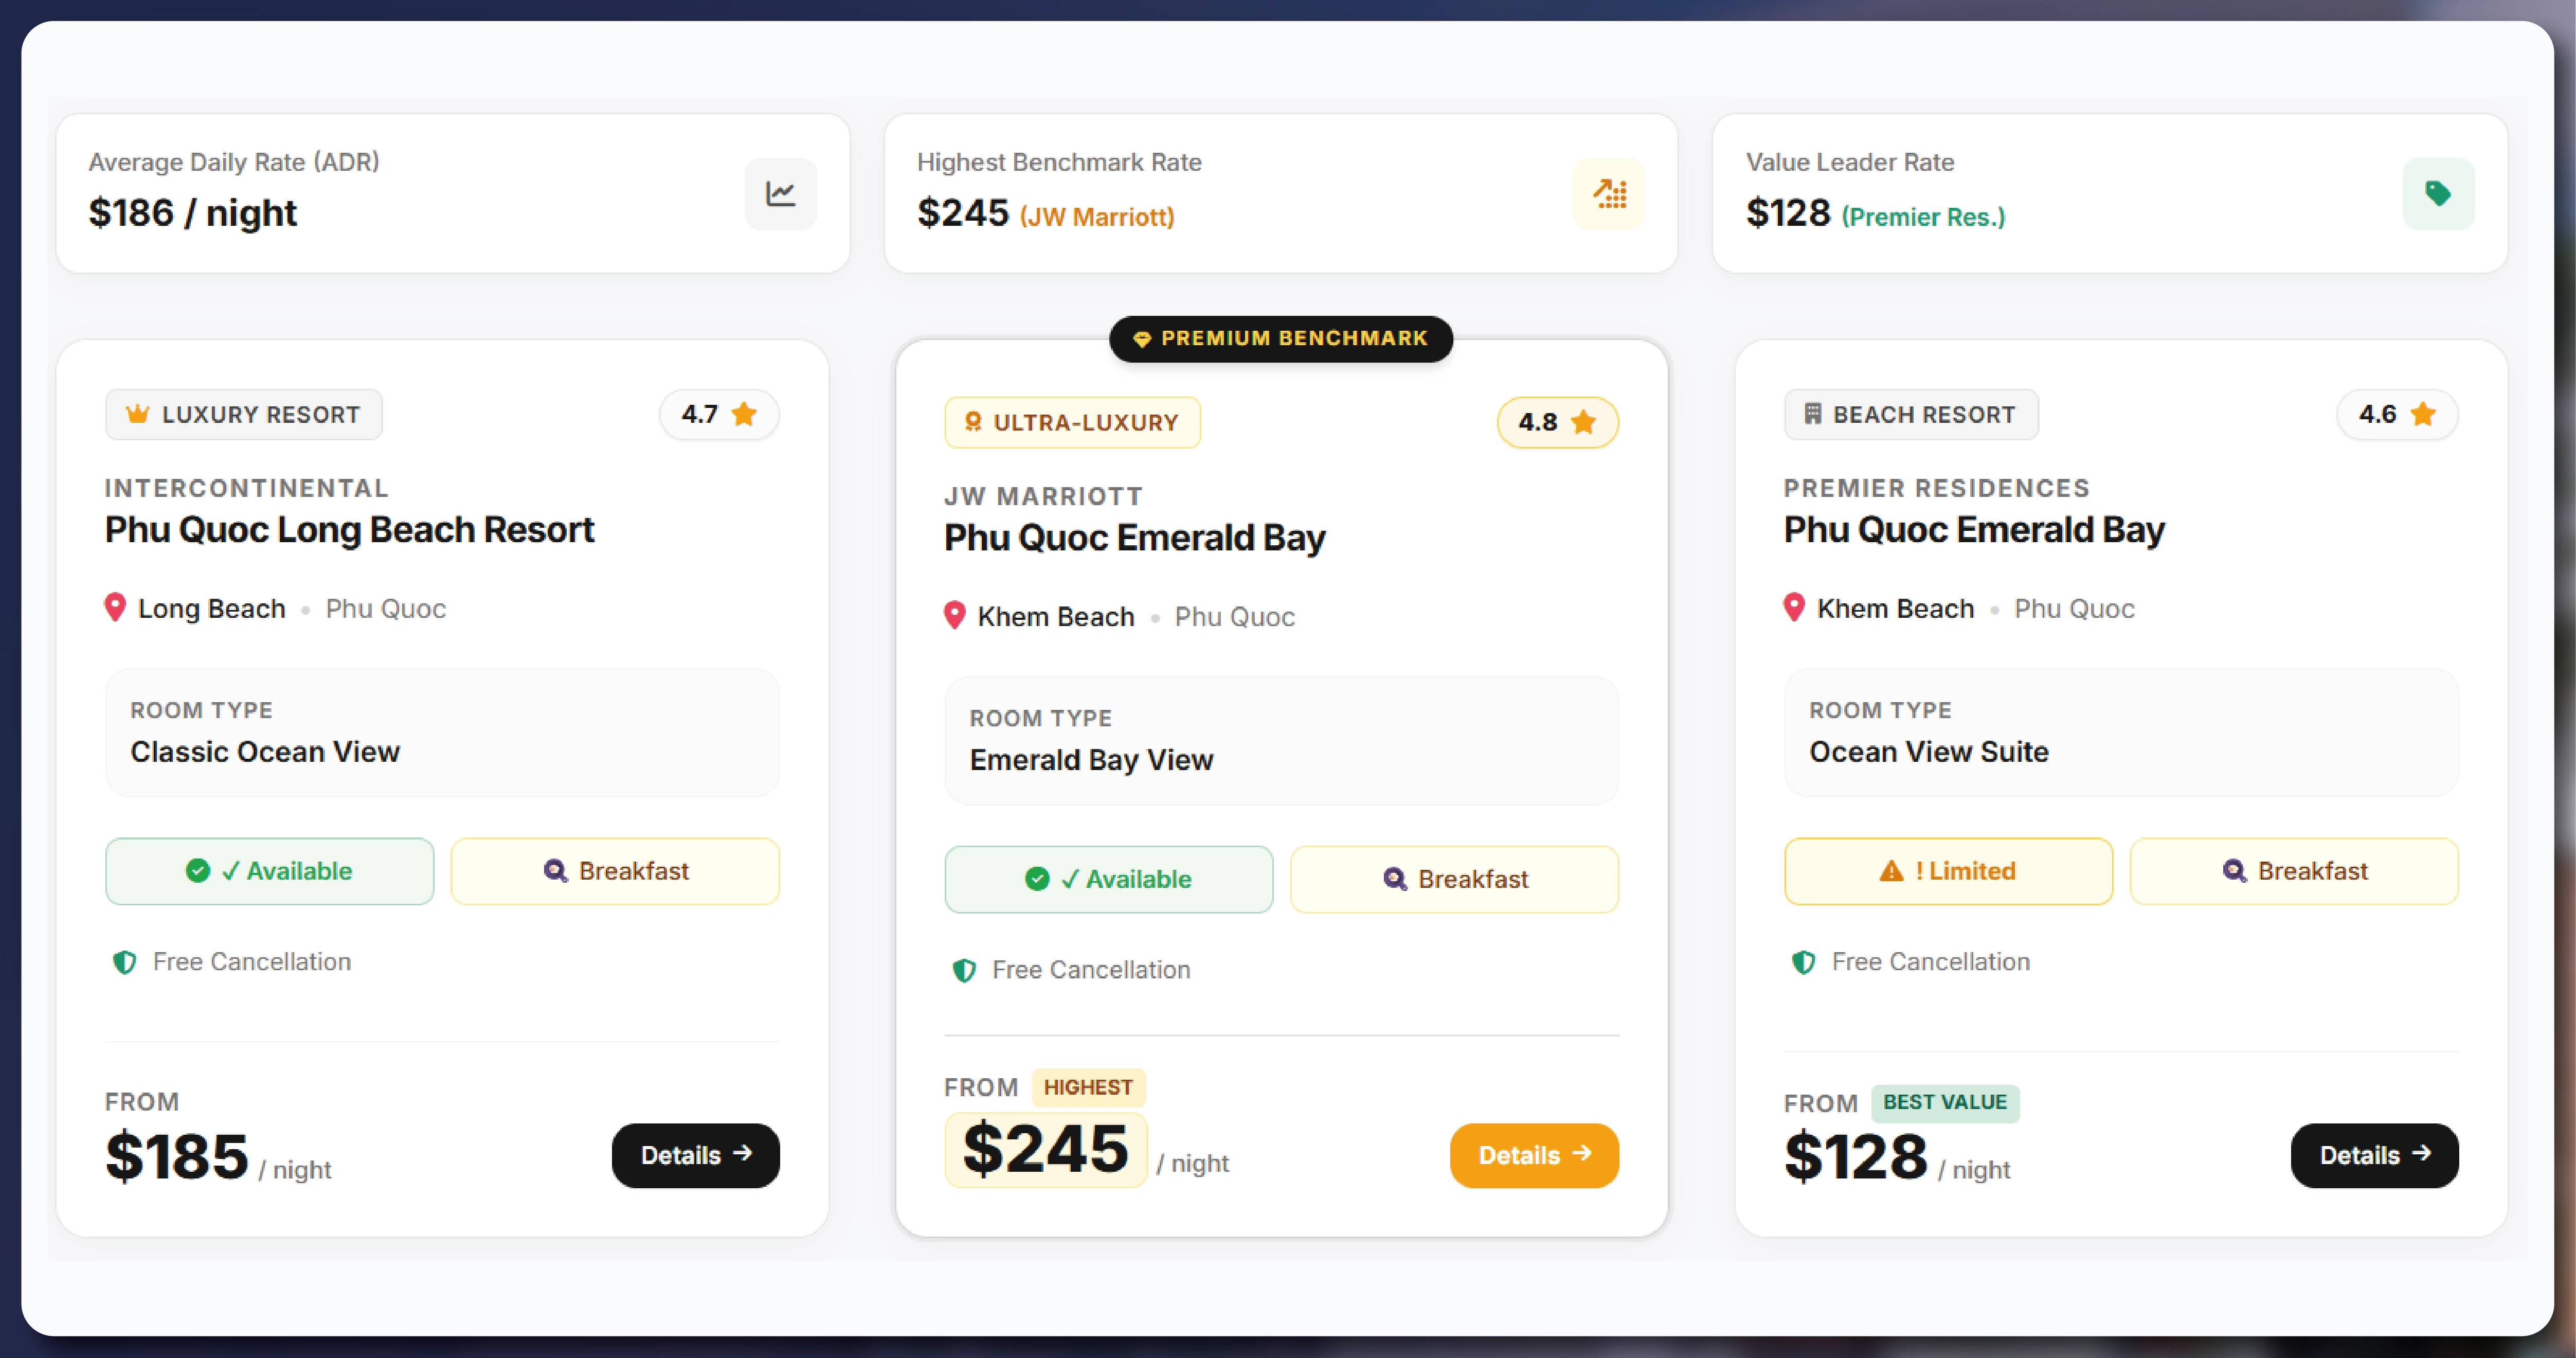
The resulting dataset can support dashboards showing lowest available rate, median competitor rate, percentage price change, room availability, promotional frequency, and property ranking. Travel marketplaces can use these insights to improve hotel recommendations, while hotel operators can compare their pricing against a defined competitor set.

The most important benefit is speed. When rates change multiple times a day, a periodic manual report may become outdated before a decision is made. Automated collection reduces this lag and creates a more responsive competitive intelligence system.

Understanding Demand, Competition, and Destination Growth

The rapid development of Phu Quoc makes Phu Quoc hospitality industry Data insights increasingly important for strategic planning. Tourism growth has affected accommodation demand, international arrivals, hotel development, transportation connectivity, and investment activity.

Historical data illustrates the destination's transformation. Phu Quoc attracted approximately 5 million visitors in 2019, while tourism was heavily disrupted during the pandemic. By 2022, reported visitor volumes had recovered strongly, and by 2024 the island welcomed more than 5.9 million visitors.

International demand has become particularly important. In 2024, international arrivals reached approximately 962,449. During the first nine months of 2025, international visitors exceeded 1.2 million, already surpassing the previous year's total.

Year Key Demand Indicator Strategic Interpretation
2020 288,634 November visitors Domestic-led recovery
2021 International reopening in Nov. Beginning of international recovery
2022 ~1.4M visitors in H1 Rapid rebound
2023 Strong occupancy environment Competitive pressure increased
2024 962,449 international visitors International demand strengthened
2025 1.2M+ international visitors by Sept. International growth accelerated
2026 Benchmarking year Opportunity for predictive demand analysis

These trends demonstrate why hotel data should be combined with broader destination indicators. Flight capacity, visitor arrivals, holidays, international source markets, and local events can all influence room demand.

For investors and hospitality operators, this type of intelligence supports decisions about market entry, property positioning, room inventory, renovation priorities, and promotional strategy. It can also reveal underserved market segments, such as family accommodation, premium villas, budget properties, or hotels with specific amenity combinations.

Measuring Rate Changes and Revenue Opportunities

The growing complexity of hotel competition makes Phu Quoc Hotel Dynamic Prices Monitoring a critical component of modern hospitality intelligence. A hotel's price is not static; it can vary according to demand, day of week, seasonality, room availability, cancellation terms, and competitor movements.

Combining this monitoring with Travel Data Intelligence allows businesses to connect hotel pricing with wider travel-market signals. For example, rising international arrivals may create additional demand pressure, while increased room supply may moderate price growth.

Year Market Condition Pricing Intelligence Focus
2020 Pandemic disruption Establish historical baselines
2021 Restricted reopening Identify recovery signals
2022 Strong rebound Track demand-driven increases
2023 High occupancy periods Monitor premium pricing
2024 5.9M+ visitors Benchmark market-wide rates
2025 Rapid visitor growth Detect price acceleration
2026 Expanding competitive landscape Predict rate movements

A useful benchmark system can calculate rate indices for different hotel groups. For example, luxury properties can be compared with other luxury properties rather than with budget accommodation. Location-based indices can also distinguish beachfront hotels from inland properties.

Revenue managers can use this information to identify rate gaps. If a hotel consistently prices below comparable competitors while showing similar ratings and amenities, there may be an opportunity to increase rates. Conversely, if a property prices above its competitor set while availability remains high, a promotional or repositioning strategy may be required.

Dynamic monitoring also helps identify short-term market events. Sudden price increases across multiple competitors can signal an upcoming demand spike. Rapid price reductions may indicate weaker-than-expected demand or excess inventory. These signals can be incorporated into automated alerts and revenue dashboards.

Converting Market Data Into Actionable Benchmarks

The final stage is transforming collected information into Phu Quoc Hospitality Market Analytics that decision-makers can use. Raw hotel records have limited value until they are cleaned, standardized, categorized, and compared over time.

A comprehensive analytics model can include hotel rates, availability, property category, room type, amenities, location, ratings, reviews, promotions, cancellation policies, and competitor positioning. Combining these variables allows businesses to evaluate the complete market rather than focusing only on price.

Year Benchmark Priority Recommended Output
2020 Historical disruption Baseline dataset
2021 Reopening Recovery indicators
2022 Supply expansion Property and room database
2023 Occupancy and competition Rate comparison dashboard
2024 International demand Market segmentation
2025 Accelerated growth Predictive pricing signals
2026 Strategic optimization Automated benchmark intelligence

A robust dashboard can present average daily rates, median rates, minimum and maximum prices, availability percentages, price changes, competitor rankings, and amenity comparisons. These metrics can be segmented by hotel class, location, room type, and booking period.

The historical perspective is equally important. Comparing current rates with previous observations helps identify recurring seasonal patterns and unusual movements. Businesses can determine whether a price increase is normal for a particular holiday period or represents an unusual market shift.

For travel platforms, the dataset can improve hotel discovery and recommendation systems. For hotel groups, it can strengthen competitive positioning and revenue management. For investors, it can support market-entry assessments. For analysts, it can provide a structured foundation for destination research.

The ultimate goal is not simply to collect more hotel data. It is to create a reliable intelligence layer that turns changing accommodation-market conditions into measurable, comparable, and actionable insights.

Actowiz Solutions can support hospitality businesses with structured data collection designed around competitive intelligence, market research, and pricing analytics. Phu Quoc hotel amenities Data Extraction can capture valuable property-level information such as room facilities, pools, dining options, wellness services, parking, beach access, family facilities, and other amenities that influence hotel positioning.

Combined with the Phu Quoc Hotel Pricing & Availability Benchmark Report, these datasets can help businesses understand both the commercial and experiential dimensions of hotel competition.

Actowiz Solutions can also support automated extraction, data cleaning, normalization, historical storage, and delivery through formats suited to analytics workflows. This makes it easier for businesses to build dashboards, monitor competitor movements, identify pricing opportunities, and conduct recurring market research.

The value extends beyond simple scraping. A structured approach can help transform fragmented accommodation information into a consistent dataset that supports business intelligence, revenue management, travel-market research, and strategic planning.

For organizations monitoring a rapidly developing destination such as Phu Quoc, timely data can reduce manual research and provide a more complete view of market conditions.

Conclusion

Phu Quoc has evolved into a highly competitive tourism and hospitality destination, with visitor volumes and international demand recovering strongly after the pandemic. The Phu Quoc Hotel Pricing & Availability Benchmark Report provides a practical foundation for tracking this evolving market, comparing hotel rates, monitoring inventory, analyzing competitors, and identifying demand-driven pricing opportunities.

A scalable Web Crawling service can continuously collect publicly available hotel information, while Web Data Mining can transform those records into structured intelligence for dashboards, benchmarking, and strategic analysis.

From historical market recovery to rapidly changing international demand, the Phu Quoc hotel landscape requires timely and consistent intelligence. Automated data collection allows businesses to move beyond occasional research and establish an ongoing competitive monitoring system.

Contact Actowiz Solutions today to build a customized hotel pricing, availability, and competitive intelligence solution for the Phu Quoc hospitality market!

Social Proof That Converts

Trusted by Global Leaders Across Q-Commerce, Travel, Retail, and FoodTech

Our web scraping expertise is relied on by 4,000+ global enterprises including Zomato, Tata Consumer, Subway, and Expedia — helping them turn web data into growth.

4,000+ Enterprises Worldwide
50+ Countries Served
20+ Industries
Join 4,000+ companies growing with Actowiz →
Real Results from Real Clients

Hear It Directly from Our Clients

Watch how businesses like yours are using Actowiz data to drive growth.

1 min
★★★★★
"Actowiz Solutions offered exceptional support with transparency and guidance throughout. Anna and Saga made the process easy for a non-technical user like me. Great service, fair pricing!"
TG
Thomas Galido
Co-Founder / Head of Product at Upright Data Inc.
2 min
★★★★★
"Actowiz delivered impeccable results for our company. Their team ensured data accuracy and on-time delivery. The competitive intelligence completely transformed our pricing strategy."
II
Iulen Ibanez
CEO / Datacy.es
1:30
★★★★★
"What impressed me most was the speed — we went from requirement to production data in under 48 hours. The API integration was seamless and the support team is always responsive."
FC
Febbin Chacko
-Fin, Small Business Owner
icons 4.8/5 Average Rating
icons 50+ Video Testimonials
icons 92% Client Retention
icons 50+ Countries Served

Join 4,000+ Companies Growing with Actowiz

From Zomato to Expedia — see why global leaders trust us with their data.

Why Global Leaders Trust Actowiz

Backed by automation, data volume, and enterprise-grade scale — we help businesses from startups to Fortune 500s extract competitive insights across the USA, UK, UAE, and beyond.

icons
7+
Years of Experience
Proven track record delivering enterprise-grade web scraping and data intelligence solutions.
icons
4,000+
Projects Delivered
Serving startups to Fortune 500 companies across 50+ countries worldwide.
icons
200+
In-House Experts
Dedicated engineers across scrapers, AI/ML models, APIs, and data quality assurance.
icons
9.2M
Automated Workflows
Running weekly across eCommerce, Quick Commerce, Travel, Real Estate, and Food industries.
icons
270+ TB
Data Transferred
Real-time and batch data scraping at massive scale, across industries globally.
icons
380M+
Pages Crawled Weekly
Scaled infrastructure for comprehensive global data coverage with 99% accuracy.

AI Solutions Engineered
for Your Needs

LLM-Powered Attribute Extraction: High-precision product matching using large language models for accurate data classification.
Advanced Computer Vision: Fine-grained object detection for precise product classification using text and image embeddings.
GPT-Based Analytics Layer: Natural language query-based reporting and visualization for business intelligence.
Human-in-the-Loop AI: Continuous feedback loop to improve AI model accuracy over time.
icons Product Matching icons Attribute Tagging icons Content Optimization icons Sentiment Analysis icons Prompt-Based Reporting

Connect the Dots Across
Your Retail Ecosystem

We partner with agencies, system integrators, and technology platforms to deliver end-to-end solutions across the retail and digital shelf ecosystem.

icons
Analytics Services
icons
Ad Tech
icons
Price Optimization
icons
Business Consulting
icons
System Integration
icons
Market Research
Become a Partner →

Popular Datasets — Ready to Download

Browse All Datasets →
icons
Amazon
eCommerce
Free 100 rows
icons
Zillow
Real Estate
Free 100 rows
icons
DoorDash
Food Delivery
Free 100 rows
icons
Walmart
Retail
Free 100 rows
icons
Booking.com
Travel
Free 100 rows
icons
Indeed
Jobs
Free 100 rows

Latest Insights & Resources

View All Resources →
thumb
Blog

TikTok Shop Data Scraping: Product, Pricing & Creator Insights (USA + Southeast Asia, 2026)

Actowiz Solutions

thumb
Case Study

How We Helped a Leading FMCG Brand Achieve FMCG Digital Shelf Optimization Across Q-Commerce & E-Commerce

Boost product visibility and sales with FMCG Digital Shelf Optimization Across Q-Commerce & E-Commerce using real-time insights and analytics.

thumb
Report

Phu Quoc Hotel Pricing & Availability Benchmark Report

Get a Phu Quoc Hotel Pricing & Availability Benchmark Report to compare hotel rates, availability, competitors, and market trends for smarter pricing.

Start Where It Makes Sense for You

Whether you're a startup or a Fortune 500 — we have the right plan for your data needs.

icons
Enterprise
Book a Strategy Call
Custom solutions, dedicated support, volume pricing for large-scale needs.
icons
Growing Brand
Get Free Sample Data
Try before you buy — 500 rows of real data, delivered in 2 hours. No strings.
icons
Just Exploring
View Plans & Pricing
Transparent plans from $500/mo. Find the right fit for your budget and scale.

Request Free Sample Data

Our team will reach out within 2 hours with 500 rows of real data — no credit card required.

+1
Free 500-row sample · No credit card · Response within 2 hours