🎃 HALLOWEEN OFF Spooky Savings Event! Get FLAT 20% OFF on all Web Scraping & Data Extraction Plans 20% OFF Web Scraping Plans!
Ends in: 00d : 00h : 00m : 00s
🦇
👻
🎃 Spooktacular Limited Offer

Don’t Let High Data Costs Haunt You! 🎃

Get FLAT 20% OFF

T&C Apply

Scrape competitor prices, monitor MAP, and extract real-time datasets at a spooky discount this Halloween.

Offer Expires In:
00d : 00h : 00m : 00s
⚡ Claim 20% Discount Now
🎃
Promo Code Copied!
SPOOKY30 (20% OFF Applied)
Core services
Enterprise Data Extraction

Scalable web, app and AI-powered collection across 40+ countries.

All 58 services →
New 2026
AI Training Data

Corpus building with provenance and opt-out compliance.

Learn more →
Free pilot
24-hour sample

We run collection on your own sources before you commit.

Get a sample →
58Services
40+Countries
DEVELOPER

Ready-Made Scrapers

Pre-built for top platforms. Self-serve, no setup.

View All →
TRY FREE

API Playground

Test endpoints instantly. No credit card.

Start Free →
28Tools
2SDKs
icons Delivery & SDKs
Streaming Crawl API Scheduler Realtime Alerts Webhook Delivery 🐍 Python SDK 💚 Node.js SDK
Need it managed instead?

Fixed monthly retainer, named engineer, no per-request metering.

Managed Data API →
HOT

Case Studies

How brands use Actowiz, with named outcomes.

Read →
FREE

Sample Datasets

Real output, no signup.

Download →
NEW

ROI Calculator

Model the return on a data engagement.

Calculate →
Zoomcar Data Intelligence 2026: Rental Market Insights

Introduction

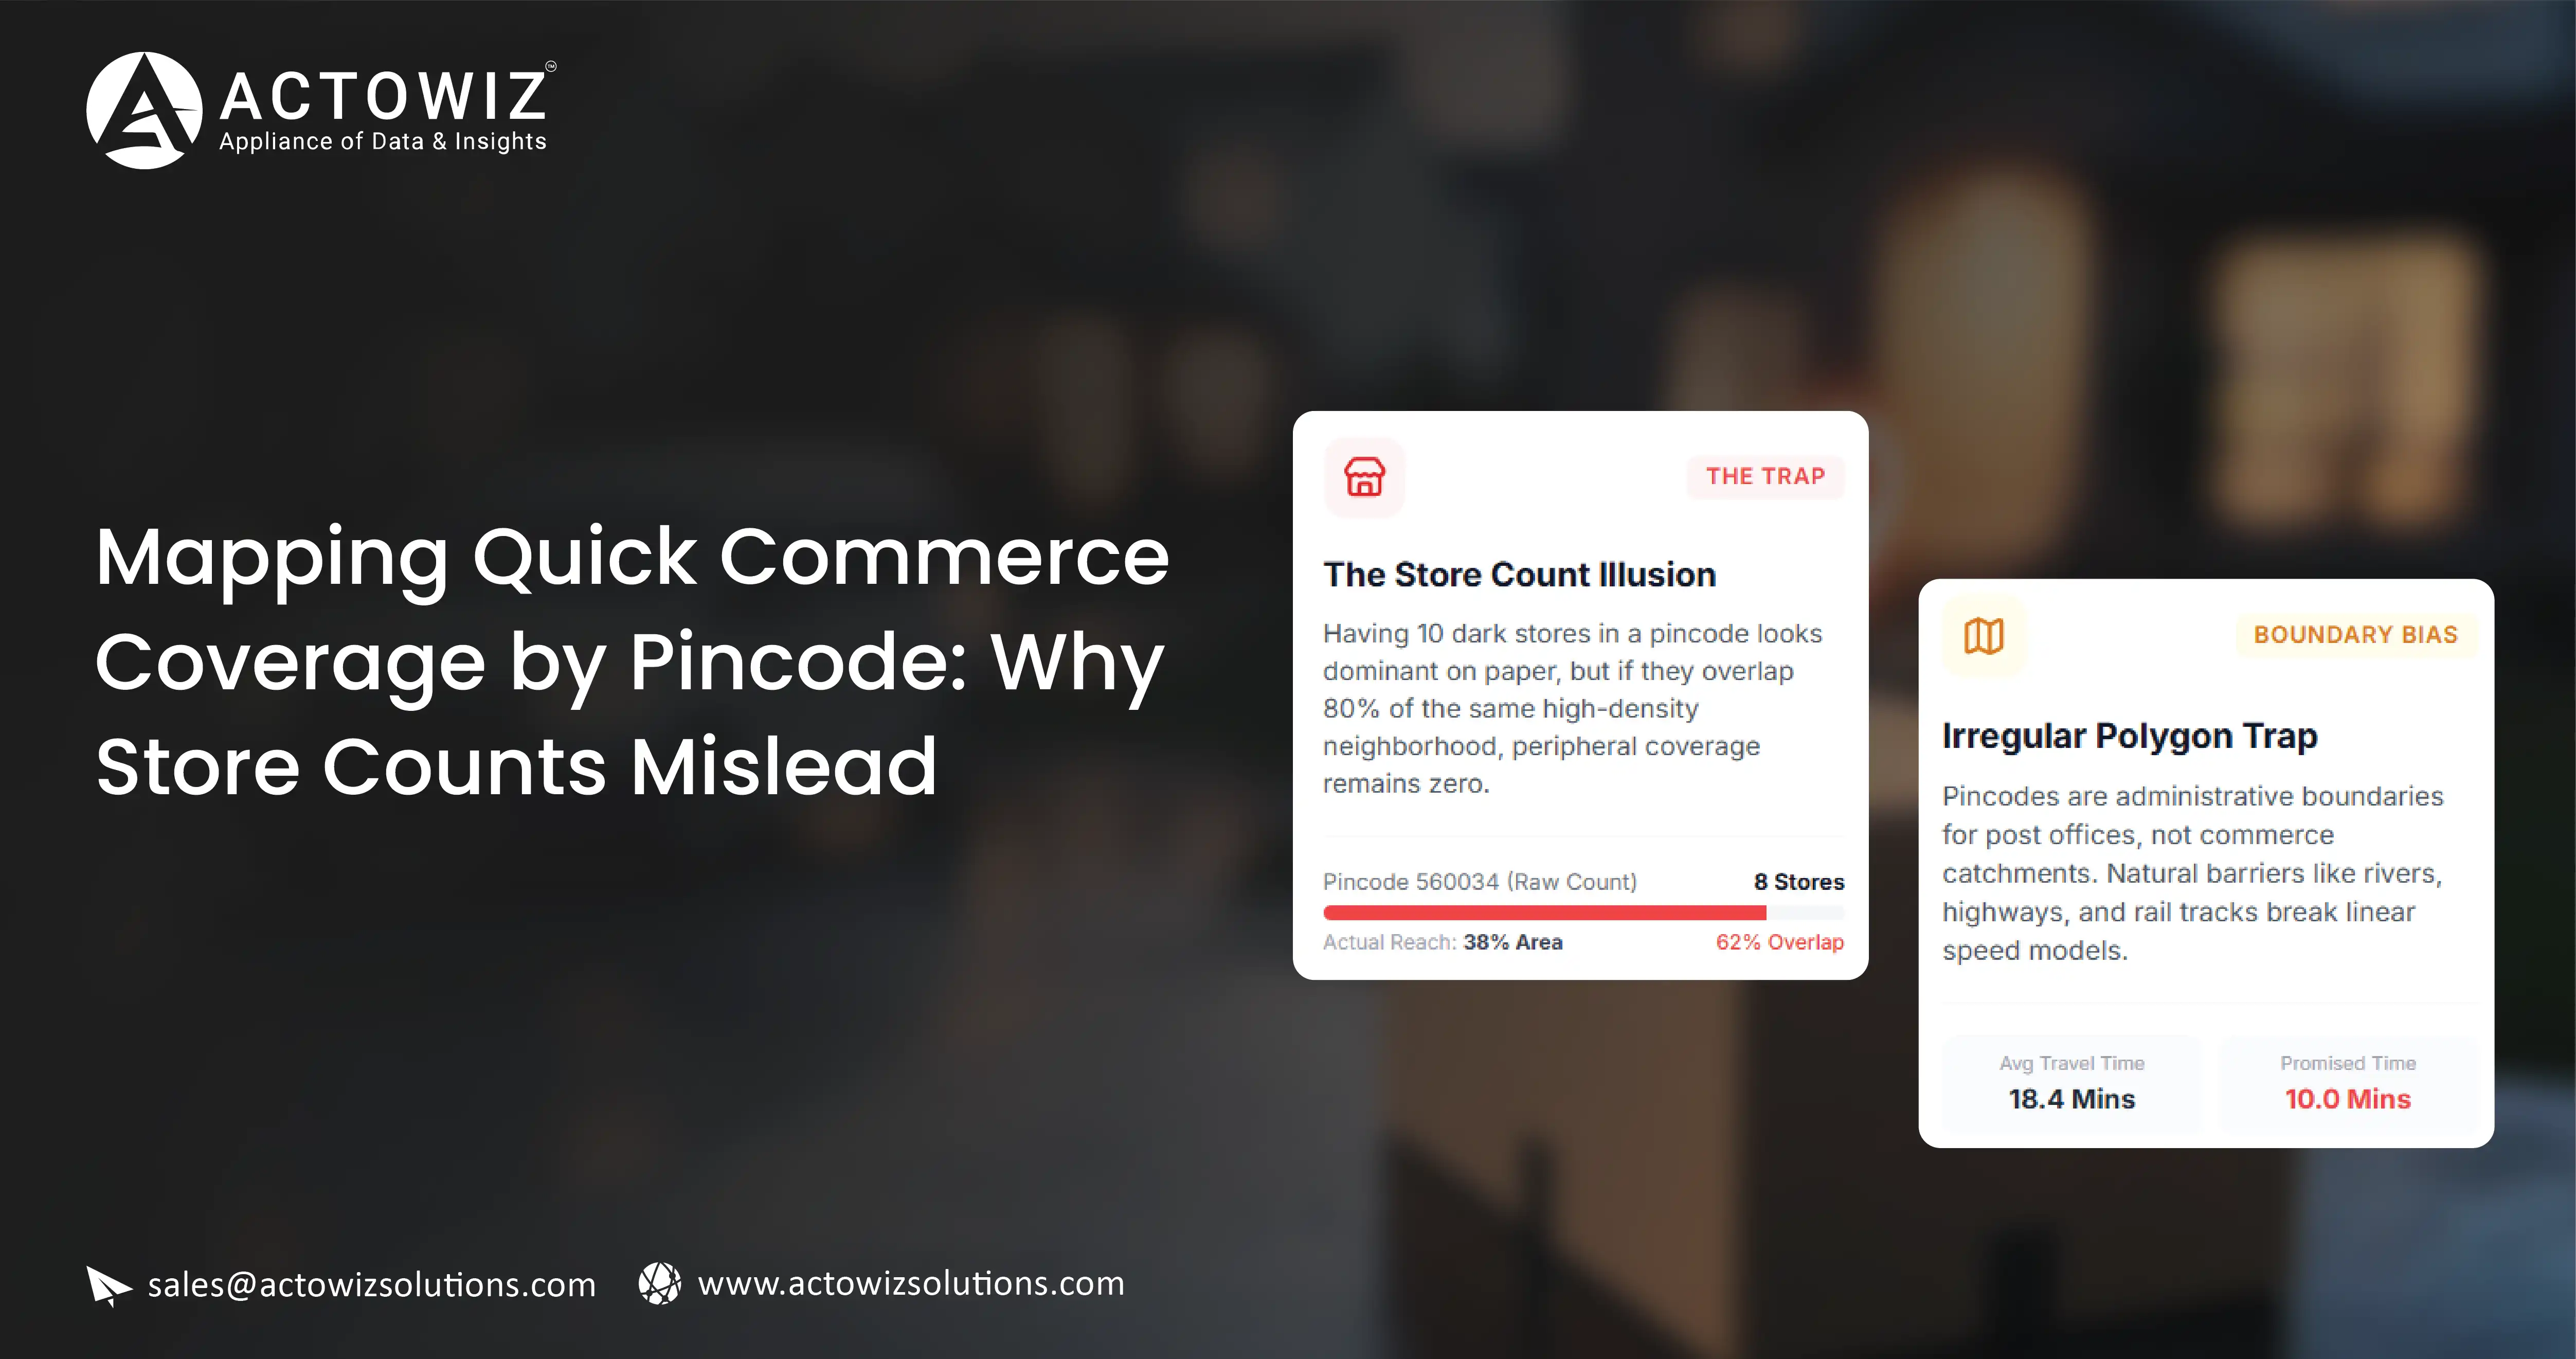
Ask three sources how many dark stores a quick commerce platform operates in India and you will get three answers. None of them is necessarily wrong. They are counting different things.

One source counts leased facilities. Another counts facilities that are live and picking orders. A third counts "fulfilment nodes," which may include partner-operated micro-warehouses that the platform does not call stores at all. A store that opened last week and a store that closed last month both sit in somebody's number. And a single large dark store in a dense urban block serves a radius that four small stores in a sprawling suburb cannot match.

The deeper problem is that store count answers a question nobody in a category team actually has. A brand manager does not need to know how many buildings a platform leases. They need to know whether a consumer standing in a specific pincode can order their product in ten minutes, and what else that consumer is shown alongside it.

That is a measurable thing. Store count is not.

A claim versus an observation

Every dark store number in circulation originates from the platform: an investor deck, an earnings call, a press statement, a recruitment page. It is a claim. It is unverifiable from outside, it is stated at a moment of the company's choosing, and its definition can shift between quarters without anyone announcing the shift.

Serviceability is different. You can observe it. Submit a location to the platform the way a consumer would, and the platform tells you whether it serves that location. It tells you what catalogue it will show. It tells you what delivery promise it makes. It tells you what is in stock right now.

That response is the ground truth of coverage. It is what the consumer experiences. It does not depend on anyone's definition of a store, and it cannot be quietly restated later.

Dimension Store count Observed serviceability
Source Platform statement Platform response to a location query
Definition stability Varies by source and quarter Fixed by your own method
Granularity National or city Pincode or coordinate
Ties to consumer experience Indirect Direct
Assortment context None Full catalogue observable
Re-measurable Only when disclosed On any cadence you choose

How to measure serviceability from outside

The mechanism is the platform's own location gate. Quick commerce apps and sites ask for a delivery location before showing a catalogue, because the catalogue is store-specific. That gate is the measurement instrument.

The collection sequence for one observation:

  • Submit a target location — a pincode, or a coordinate pair inside that pincode.
  • Record whether the platform accepts it, rejects it, or accepts it and then shows an unserviceable state.
  • If served, record the delivery promise shown and any store or node identifier the response exposes.
  • Retrieve the catalogue available at that location: category tree, listing counts, and the status of a defined watchlist of products.
  • Record the timestamp and the collection method used.

Two details matter more than they look. First, submit a coordinate inside the pincode rather than the pincode string alone where the platform accepts both, because platforms resolve pincodes inconsistently and coordinates are unambiguous. Second, always capture the catalogue alongside the yes/no. A serviceability flag without an assortment reading is half a measurement, for reasons covered below.

The collection mechanics — location gate handling, coordinate resolution, and catalogue capture — are covered in our quick commerce data collection service.

Designing a pincode sample

India has roughly count of active delivery pincodes, sourced and stated pincodes. Querying all of them across several platforms on a monthly cadence is possible but usually unnecessary, and the cost buys precision you will not use.

Stratified sampling gives national coverage figures with a stated confidence interval at a fraction of the volume. Build the frame like this:

  • Stratify by urban tier. Metro, tier 1, tier 2, tier 3, and rural pincodes behave differently, and the interesting movement is at the tier 2 and tier 3 boundary. Oversample there.
  • Stratify by state. Coverage expands state by state, and a national figure that hides state variance is not actionable for a regional brand.
  • Census the metros. In the top cities, query every pincode. The population is small, the density of commercial interest is high, and edge effects within a city are exactly what a trade team needs.
  • Sample the long tail. Draw a random sample within each remaining stratum, sized to your target margin of error, and hold the sample fixed across periods.

Holding the sample fixed is the single most important design decision. A coverage series built on a changing sample measures your sampling, not the platform. Add new pincodes as a separate cohort and report both the like-for-like series and the expanded one. The hyperlocal serviceability insights service implements fixed frames with cohort-based reporting.

What coverage means at the edges

Binary coverage is a convenient fiction. Real serviceability is ragged, and the raggedness carries the signal.

Partial pincodes. A pincode can span a serviced block and an unserviced one. Querying a single centroid coordinate will call the whole pincode served or unserved, and both answers will be wrong somewhere. For large-area pincodes, query multiple coordinates and record the proportion served.

Time-bounded serviceability. A location served at 7pm may be unserved at 7am, or served with a longer promise. Any coverage number carries an implicit time-of-day. State it, and for key pincodes measure at two or three daily slots.

Serviced but empty. The platform accepts the location and returns a catalogue with almost nothing in it. Technically served. Commercially irrelevant.

Promise tiers. Ten minutes, thirty minutes, and next-day scheduled are three different products. Collapsing them into "served" destroys the distinction a category manager cares about most.

Soft launch states. New areas sometimes appear with a restricted catalogue before full launch. These are the leading indicator of expansion, and only repeat measurement reveals them.

Location resolution and geography-master maintenance — state, district, city, urban tier — are covered in our location and geo data services.

Field schema for a coverage record

One row per platform × location × observation window.

Field Type Notes
observation_id string Unique per record
platform string Controlled vocabulary
pincode string Six digits, zero-padded
query_lat, query_lon float Coordinate actually submitted
state, district, city string From a maintained geography master
urban_tier enum metro / t1 / t2 / t3 / rural
serviceability_status enum served / not_served / served_restricted / error
delivery_promise_minutes integer As displayed; null if absent
promise_tier enum express / standard / scheduled
store_node_id string If the platform exposes one
category_count integer Distinct categories in the tree
listing_count_total integer Listings visible at this location
watchlist_listed_count integer Of N tracked products, how many appear
watchlist_in_stock_count integer Of those, how many purchasable
assortment_depth_index float Listings here ÷ max observed nationally
observed_at_utc timestamp ISO 8601
local_time_slot enum morning / midday / evening / late
collection_method string For audit and reproducibility
qa_status enum pass / flagged / failed

The assortment_depth_index is the field that makes the dataset useful rather than merely accurate.

Why monthly re-measurement is the minimum

Coverage is not a stable attribute. Platforms open nodes, close nodes, re-draw delivery polygons, and change the assortment a node carries. A coverage map collected once is a photograph of a moving object.

Monthly is the practical floor for a national panel. It catches expansion into new cities within a reporting cycle and it produces enough points to distinguish a trend from noise. Weekly is appropriate for a metro census, where polygon changes are frequent and competitive response windows are short.

Report changes as cohorts, not as a net figure. Newly served pincodes, newly unserved pincodes, and promise-tier upgrades or downgrades each mean something different. A net change of zero can hide substantial churn.

Store and node identifiers exposed by the platform are recorded in our store locator intelligence service so that node-level coverage patterns can be analysed alongside pincode serviceability.

Coverage and assortment are one metric

A pincode where a platform is live but carries observed listing count in thin-assortment pincodes listings against a national maximum of observed maximum listing count is not covered in any sense a brand should accept. The consumer can order, but not your product, and often not the pack size that matters.

So report coverage as a two-dimensional distribution, not a percentage. For each platform, cross serviceability against assortment depth bands. The resulting table shows where the platform is genuinely operating, where it is nominally present, and where your own products are absent from otherwise deep catalogues — which is a distribution gap, not a coverage gap, and needs a different conversation with a different team.

Product-level availability within served pincodes is tracked in our product availability tracking service, and category-level depth in our assortment depth analysis service. Both join to the same coverage records on pincode and platform.

Actowiz Solutions builds pincode-level serviceability and assortment panels across Indian quick commerce platforms, with fixed sampling frames, documented collection methods, and audit fields on every record. Coverage, promise tier, and catalogue depth arrive as one dataset rather than three.

You can also reach us for all your mobile app scraping, data collection, web scraping, and instant data scraper service requirements!

Social Proof That Converts

Trusted by Global Leaders Across Q-Commerce, Travel, Retail, and FoodTech

Our web scraping expertise is relied on by 4,000+ global enterprises including Zomato, Tata Consumer, Subway, and Expedia — helping them turn web data into growth.

4,000+ Enterprises Worldwide
50+ Countries Served
20+ Industries
Join 4,000+ companies growing with Actowiz →
Real Results from Real Clients

Hear It Directly from Our Clients

Watch how businesses like yours are using Actowiz data to drive growth.

▶
1 min
★★★★★
"Actowiz Solutions offered exceptional support with transparency and guidance throughout. Anna and Saga made the process easy for a non-technical user like me. Great service, fair pricing!"
TG
Thomas Galido
Co-Founder / Head of Product at Upright Data Inc.
▶
2 min
★★★★★
"Actowiz delivered impeccable results for our company. Their team ensured data accuracy and on-time delivery. The competitive intelligence completely transformed our pricing strategy."
II
Iulen Ibanez
CEO / Datacy.es
▶
1:30
★★★★★
"What impressed me most was the speed — we went from requirement to production data in under 48 hours. The API integration was seamless and the support team is always responsive."
FC
Febbin Chacko
-Fin, Small Business Owner
icons 4.8/5 Average Rating
icons 50+ Video Testimonials
icons 92% Client Retention
icons 50+ Countries Served

Join 4,000+ Companies Growing with Actowiz

From Zomato to Expedia — see why global leaders trust us with their data.

Why Global Leaders Trust Actowiz

Backed by automation, data volume, and enterprise-grade scale — we help businesses from startups to Fortune 500s extract competitive insights across the USA, UK, UAE, and beyond.

icons
7+
Years of Experience
Proven track record delivering enterprise-grade web scraping and data intelligence solutions.
icons
4,000+
Projects Delivered
Serving startups to Fortune 500 companies across 50+ countries worldwide.
icons
200+
In-House Experts
Dedicated engineers across scrapers, AI/ML models, APIs, and data quality assurance.
icons
9.2M
Automated Workflows
Running weekly across eCommerce, Quick Commerce, Travel, Real Estate, and Food industries.
icons
270+ TB
Data Transferred
Real-time and batch data scraping at massive scale, across industries globally.
icons
380M+
Pages Crawled Weekly
Scaled infrastructure for comprehensive global data coverage with 99% accuracy.

AI Solutions Engineered
for Your Needs

→
LLM-Powered Attribute Extraction: High-precision product matching using large language models for accurate data classification.
→
Advanced Computer Vision: Fine-grained object detection for precise product classification using text and image embeddings.
→
GPT-Based Analytics Layer: Natural language query-based reporting and visualization for business intelligence.
→
Human-in-the-Loop AI: Continuous feedback loop to improve AI model accuracy over time.
icons Product Matching icons Attribute Tagging icons Content Optimization icons Sentiment Analysis icons Prompt-Based Reporting

Connect the Dots Across
Your Retail Ecosystem

We partner with agencies, system integrators, and technology platforms to deliver end-to-end solutions across the retail and digital shelf ecosystem.

icons
Analytics Services
icons
Ad Tech
icons
Price Optimization
icons
Business Consulting
icons
System Integration
icons
Market Research
Become a Partner →

Popular Datasets — Ready to Download

Browse All Datasets →
icons
Amazon
eCommerce
Free 100 rows
icons
Zillow
Real Estate
Free 100 rows
icons
DoorDash
Food Delivery
Free 100 rows
icons
Walmart
Retail
Free 100 rows
icons
Booking.com
Travel
Free 100 rows
icons
Indeed
Jobs
Free 100 rows

Latest Insights & Resources

View All Resources →
thumb
Blog

Health Insurance Plan Data: The Complete Guide for Insurers, Brokers and Insurtech (2026)

Health insurance plan data guide 2026: sources by country, premium and benefits fields, network lists, compliance.

thumb
Case Study

How We Helped a Leading Food-Tech Brand Leverage Restaurant & Menu Data from RestaurantGuru UK for Smarter Market Analysis

Explore Restaurant & Menu Data from RestaurantGuru UK to analyze restaurant listings, menus, pricing, ratings, and dining trends.

thumb
Report

US Spirits Retail Price Market Data Report 2026 for Liquor Retail & Brand Pricing Intelligence

US spirits price data for 2026: DISCUS revenue and volume trends, category shifts, price tiers, control vs open states, tariffs and liquor price tracking.

Start Where It Makes Sense for You

Whether you're a startup or a Fortune 500 — we have the right plan for your data needs.

icons
Enterprise
Book a Strategy Call
Custom solutions, dedicated support, volume pricing for large-scale needs.
icons
Growing Brand
Get Free Sample Data
Try before you buy — 500 rows of real data, delivered in 2 hours. No strings.
icons
Just Exploring
View Plans & Pricing
Transparent plans from $500/mo. Find the right fit for your budget and scale.
Get in Touch
Let's Talk About
Your Data Needs
Tell us what data you need — we'll scope it for free and share a sample within hours.
  • icons
    Free Sample in 2 HoursShare your requirement, get 500 rows of real data — no commitment.
  • icons
    Plans from $500/monthFlexible pricing for startups, growing brands, and enterprises.
  • icons
    US-Based SupportOffices in New York & California. Aligned with your timezone.
  • icons
    ISO 9001 & 27001 CertifiedEnterprise-grade security and quality standards.
Request Free Sample Data
Fill the form below — our team will reach out within 2 hours.
+1 ▼
✓ Free 500-row sample · No credit card · Response within 2 hours

Request Free Sample Data

Our team will reach out within 2 hours with 500 rows of real data — no credit card required.

+1 ▼
✓ Free 500-row sample · No credit card · Response within 2 hours