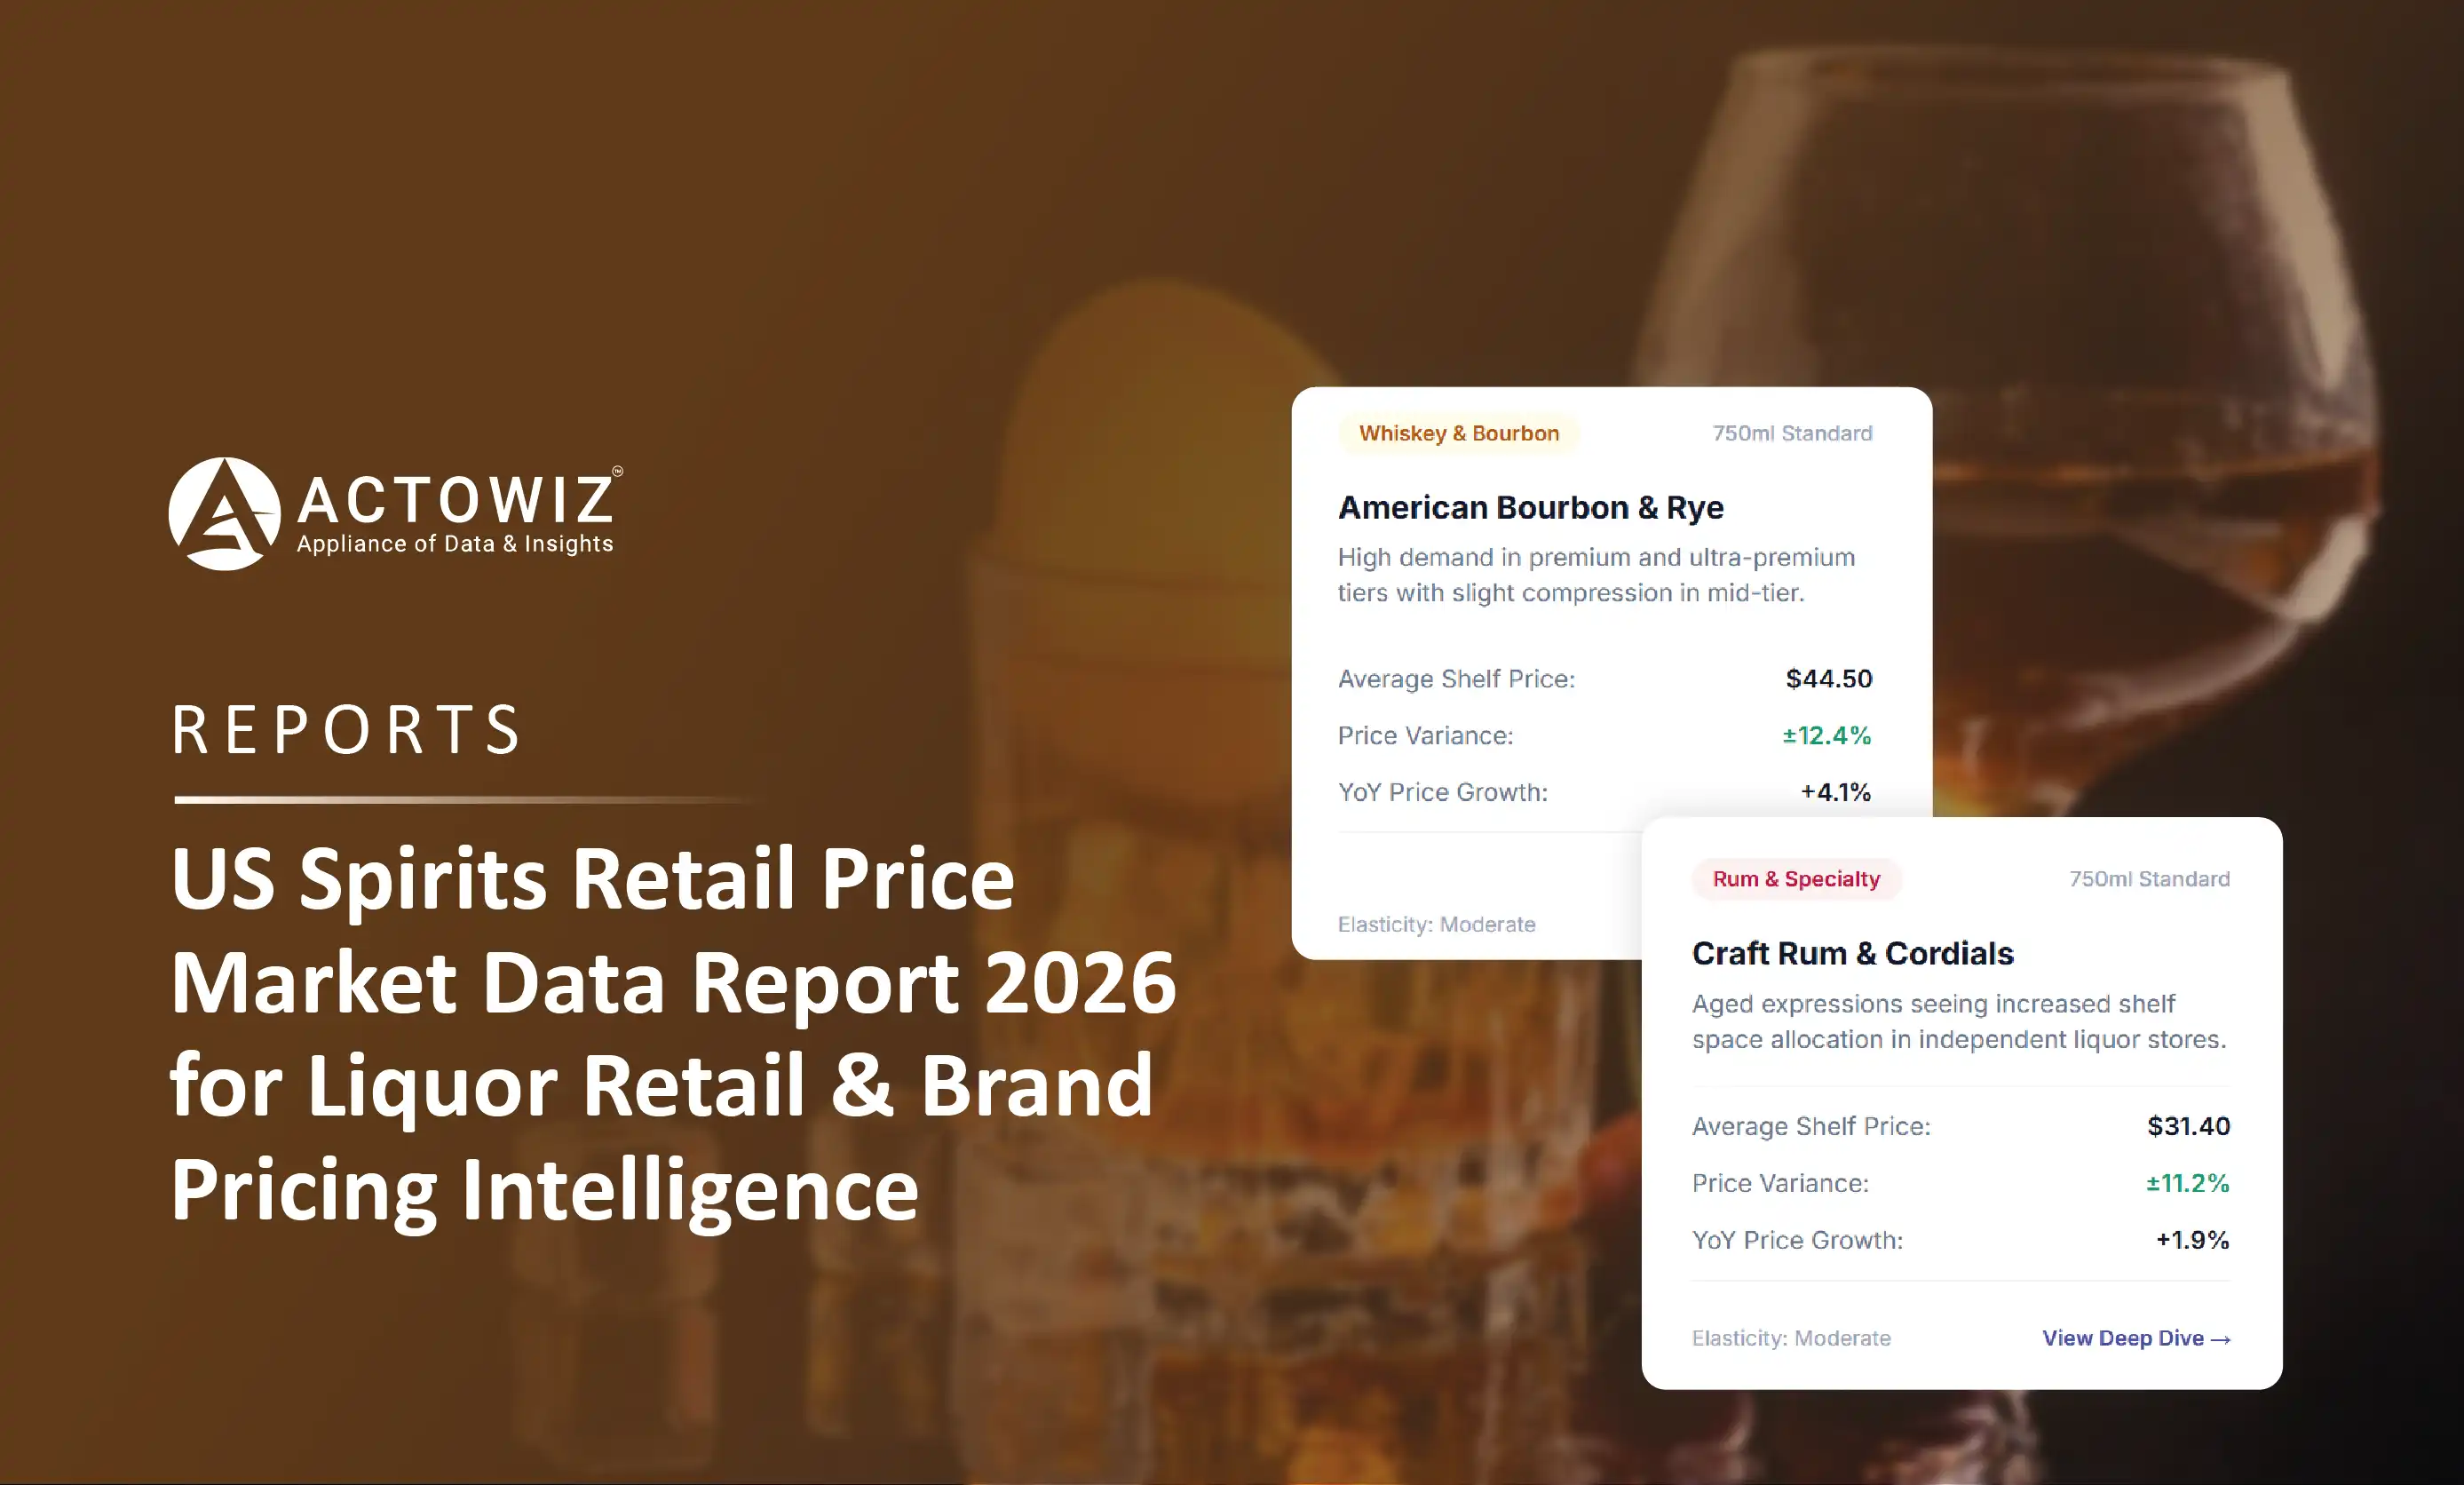
US spirits price data for 2026: DISCUS revenue and volume trends, category shifts, price tiers, control vs open states, tariffs and liquor price tracking.
US spirits had an unusually strong run from 2019 to 2022, then stalled. Supplier revenue has now fallen two years in a row while case volume keeps edging up. That gap between value and volume is the clearest sign that price, mix and promotions now matter more than raw demand.
US spirits price data is the structured record of what spirits cost at retail in the United States – shelf price, promotional price, bottle size, price per 750 ml, category, price tier and stock status by store and state – tracked over time. It shows how brands and retailers respond to slower demand, tier shifts and tariffs.
This report combines published industry figures from the Distilled Spirits Council of the United States (DISCUS), NABCA control-state data, trade and e-commerce sources for 2019–2026. It then sets out the signals and metrics we recommend for liquor price monitoring. All third-party figures are cited; values that should come from a live dataset are shown as placeholders.
US spirits supplier revenue rose from about US$29 billion in 2019 to a record US$37.7 billion in 2023, then fell to US$37.2 billion in 2024 and US$36.4 billion in 2025, according to DISCUS. Volume kept rising to 318.1 million 9-litre cases in 2025, so value per case is under pressure.
Revenue passed US$31 billion in 2020 and reached US$35.8 billion in 2021, up 12%. Growth slowed to 5.1% in 2022 and almost stopped in 2023 (+0.2%).
Since then, revenue and volume have moved in opposite directions. In 2025, revenue fell 2.2% while volume rose 1.9%. Spirits still gained share of total US alcohol revenue, reaching 42.4% in 2025 versus 42.2% in 2024. For pricing teams, that means consumers are still buying, but more cheaply or in different formats.
| Year | DISCUS supplier revenue | Change | Volume (9-litre cases) | Change | Source |
|---|---|---|---|---|---|
| 2019 | ~US$29.0B (record) | +5.3% | 239M (as reported) | +3.3% | DISCUS Economic Overview (revenue); Wooden Cork summary of DISCUS briefing (volume) |
| 2020 | Above US$31B | – | 251M | +5.5% | Shanken News Daily, 29 Jan 2021 |
| 2021 | US$35.8B | +12% | 291.1M | +9% | Shanken News Daily, 4 Feb 2022 |
| 2022 | US$37.6B (record) | +5.1% | 305M | +4.8% | CSP Daily News |
| 2023 | US$37.7B | +0.2% | 308.8M | +1.2% | DISCUS release, 7 Feb 2024 |
| 2024 | US$37.2B | −1.1% | 312.2M | +1.1% | Brewbound, 12 Feb 2025 |
| 2025 | US$36.4B | −2.2% | 318.1M | +1.9% | DISCUS, 5 Feb 2026 |
Note: the DISCUS 2019 overview deck confirms revenue of about US$29 billion (+5.3%); the 2019 volume figure is as reported by Wooden Cork's summary of the same briefing. URLs for every row are in the Sources list.
In 2025, premixed cocktails including spirits-based RTDs were the standout, up 16.4% to US$3.8 billion. Vodka (US$7.0 billion, −3%), tequila/mezcal (US$6.4 billion, −4.1%), American whiskey (US$5.1 billion, −0.9%) and cordials (US$2.7 billion, −3.2%) all lost value, DISCUS reported.
The 2025 picture is a reversal for tequila. In 2023, DISCUS reported tequila/mezcal up 7.9% to US$6.5 billion and American whiskey up 3.8% to US$5.3 billion, while RTD cocktails grew 26.8% to US$2.8 billion. Two years later, tequila is shrinking in value and RTDs are still growing, though more slowly.
For RTD cocktails pricing, the shift matters because RTDs sell in multi-packs and single cans at very different price points to 750 ml bottles. Comparing them requires unit pricing (per serve or per litre of spirit) rather than pack price. Vodka, still the largest category by value, is where discount depth and private-label pressure are easiest to see.
| Category | 2025 supplier revenue | 2025 change | 2023 reference | Source |
|---|---|---|---|---|
| Vodka | US$7.0B | −3% | – | DISCUS, 5 Feb 2026 |
| Tequila / mezcal | US$6.4B | −4.1% | US$6.5B (+7.9%) | DISCUS, 2026; DISCUS, 2024 |
| American whiskey | US$5.1B | −0.9% | US$5.3B (+3.8%) | DISCUS, 2026; DISCUS, 2024 |
| Premixed cocktails incl. spirits RTDs | US$3.8B | +16.4% | RTD cocktails US$2.8B (+26.8%) | DISCUS, 2026; DISCUS, 2024 |
| Cordials | US$2.7B | −3.2% | – | DISCUS, 5 Feb 2026 |
Sources: DISCUS Annual Economic Briefing 2025 (5 February 2026); DISCUS release, 7 February 2024. Category definitions may differ slightly between years.
Premiumisation has paused rather than reversed. In 2024, the value tier grew 3.5% while super premium fell 5.6%, premium fell 0.9% and high-end premium was flat at +0.2%, Brewbound reported from DISCUS data. High-end tiers still made up about 59% of supplier revenue.
Higher-priced bottles still earn most of the money, but shoppers are trading down at the margin. A brand that holds price while rivals discount can lose volume quickly.
For spirits retail pricing 2026, the practical question is where each brand sits in its tier and how often it is promoted. Tier data from DISCUS covers supplier revenue, not retail shelf prices, so retail tier positioning has to be built from store-level price data.
| Price tier (DISCUS) | 2024 revenue change | What to watch at retail |
|---|---|---|
| Super premium | −5.6% | Promotion frequency on prestige bottles; gift-pack pricing |
| High-end premium | +0.2% | Price gaps vs premium tier at the same bottle size |
| Premium | −0.9% | Discount depth and multi-buy offers |
| Value | +3.5% | Private-label and large-format (1.75 L) pricing |
| High-end tiers combined | ~59% of revenue | Share of shelf and promo slots |
Source: Brewbound, DISCUS: 2024 spirit sales flat, RTDs and tequila at vodka's heels (12 February 2025), https://www.brewbound.com/news/discus-2024-spirit-sales-flat-rtds-and-tequila-at-vodkas-heels. Retail columns are monitoring suggestions, not reported data.
In 18 control states, the state or its agent controls wholesale or retail sale of spirits, so prices are often set or published centrally. In open (licence) states such as Florida, private retailers set prices and compete directly. Price monitoring needs different methods for each.
NABCA data for the 18 control states shows spirits value down 2.8% to US$13.21 billion in 2025, with volume down 1.4% to about 60.4 million 9-litre cases. TD Cowen estimates that these states make up 20–25% of the US spirits market (Just Drinks, https://www.just-drinks.com/newsletters/us-spirits-sales-down-again-in-2025-nabca). Control-state results are often used as an early read on national trends.
Florida is a large open market. According to Park Street, Florida is a licence state, levies an excise tax of US$6.50 per gallon on spirits between 17.259% and 55.78% ABV, and ranks second in US spirits consumption behind California (Park Street, https://www.parkstreet.com/states/florida/; data covers 2020–2022, page last modified March 2024). With private retailers competing on shelf price and promotions, liquor store competitor pricing in Florida changes far more often than in a control state.
| Factor | Control states (NABCA, 18 states) | Open state example: Florida |
|---|---|---|
| Who sets retail prices | State agency or agent, often published | Private retailers and chains |
| 2025 spirits value | US$13.21B (−2.8%) | No Data |
| 2025 volume | ~60.4M 9-litre cases (−1.4%) | No Data |
| Share of US market | 20–25% (TD Cowen estimate) | 2nd in US consumption behind California (2020–2022 data) |
| Excise tax | Varies by state | US$6.50 per gallon (17.259–55.78% ABV) |
| Price-change frequency | Usually scheduled price lists | Frequent; store and chain promotions |
| Best monitoring method | Track published price lists and changes | Store-level and online price tracking |
Sources: Just Drinks, 30 January 2026; Park Street, Florida state page. Florida market value and volume are not published in these sources and should come from a live dataset.
For a retailer-level view in Florida and Texas, see our liquor price index covering selected chains: https://www.actowizsolutions.com/liquor-price-index-abc-fine-wine-spirits-specs-top-ten.php.
US spirits exports fell 3.8% to US$2.37 billion in 2025, Just Drinks reported. Exports to Canada fell about 70%, from US$203 million to US$60 million, after Canadian provinces removed US spirits from shelves in March 2025. American whiskey exports to the EU fell 35% to US$454 million.
When brands lose shelf space overseas, more stock is available for the home market, which can push suppliers to promote harder in the US, especially in American whiskey.
Online is not offsetting the pressure either. IWSR data reported by Drinks Intel shows global alcohol e-commerce value fell 1% in 2024, with slower growth in the US and China, and forecasts a US online value CAGR of only about 2% for 2024–2029 (Drinks Intel, https://drinks-intel.com/?p=168340). Online prices still matter, because they are the easiest for shoppers and competitors to compare.
| Pressure point | Figure | Source |
|---|---|---|
| Total US spirits exports, 2025 | US$2.37B (−3.8%) | Just Drinks via Yahoo Finance, 1 Apr 2026 |
| Exports to Canada, 2025 | US$203M → US$60M (about −70%) | Just Drinks via Yahoo Finance, 1 Apr 2026 |
| American whiskey exports to EU, 2025 | US$454M (−35%) | Just Drinks via Yahoo Finance, 1 Apr 2026 |
| Global alcohol e-commerce value, 2024 | −1% | IWSR via Drinks Intel, 12 Dec 2025 |
| US online alcohol value, 2024–2029 | ~+2% CAGR (forecast) | IWSR via Drinks Intel, 12 Dec 2025 |
| US supplier revenue, 2025 | −2.2% | DISCUS, 5 Feb 2026 |
Map prices at SKU level, store by store, with bottle size normalised to price per 750 ml. Track shelf price, promotional price, promo type, stock status and price tier on a fixed cadence across chains, independents and online stores. This turns scattered listings into a consistent view of competitor pricing.
Start with a defined basket: leading brands in each category and tier, at the bottle sizes that matter most (750 ml, 1 L, 1.75 L), plus top RTD packs. Match each item by brand, expression, size and proof, so a 1.75 L vodka is never compared directly with a 750 ml bottle.
Then add location. Open-state retailers price by store or region, and online prices may differ from in-store prices. National chains such as Total Wine show regional differences; our Total Wine price data service is described here: https://www.actowizsolutions.com/total-wine-data-scraping-api-regional-pricing.php. Delivery apps add another layer of pricing and fees, covered in our liquor delivery data page: https://www.actowizsolutions.com/liquor-delivery-data-scraping.php.
| Signal / metric | Definition | 2026 value |
|---|---|---|
| Median price per 750 ml by category | Normalised shelf price across matched SKUs | No Data |
| Promotion frequency | Share of SKUs on promotion per week | No Data |
| Average promo depth | Mean % off shelf price on promoted SKUs | No Data |
| Price gap by tier | Median price gap, high-end premium vs premium | No Data |
| RTD price per serve | Pack price divided by number of serves | No Data |
| Store-to-store price spread (Florida) | Max–min price for the same SKU across stores | No Data |
| Online vs in-store gap | Online price minus in-store price, same SKU and store | No Data |
| Stock-out rate | Share of basket out of stock per check | No Data |
US spirits have shifted from record growth to a value-led market. Supplier revenue fell in 2024 and 2025 while volume rose, the value tier outgrew premium tiers in 2024, RTD cocktails kept gaining, and tariffs cut exports to Canada and the EU. Control-state data shows the same softness. Each of these trends shows up first in shelf prices and promotions.
For spirits brands, liquor retailers, distributors and analysts, national figures set the context but do not show what a competitor charged last week in a given store. A matched, store-level price dataset – normalised per 750 ml, tagged by category and tier, and refreshed on a set cadence – fills that gap.
To get a sample of US spirits price data for your brands, categories or stores, contact us: https://www.actowizsolutions.com/contact-us.php
It is structured data on retail spirits prices in the US: shelf price, promo price, bottle size, price per 750 ml, category, tier, stock status and location, tracked over time. Brands, retailers and distributors use it for competitor pricing, promotion analysis and tier positioning.
The latest full-year data shows decline in value. DISCUS reported 2025 supplier revenue down 2.2% to US$36.4 billion, while volume rose 1.9% to 318.1 million 9-litre cases. That points to trading down and promotions rather than falling demand.
In the 18 NABCA control states, prices are often set and published centrally, so monitoring focuses on price-list changes. In open states such as Florida, private retailers set prices, so store-level tracking is needed to see promotions and competitor moves.
Convert both to a common unit, such as price per serve or per litre of spirit. RTDs are sold as single cans and multi-packs, so pack price alone is misleading. DISCUS reported premixed cocktails up 16.4% to US$3.8 billion in 2025.
Actowiz can collect publicly visible prices from retailer websites, including regional price differences where a site shows them by store. Collection follows each site's terms and covers public pages only.
Our web scraping expertise is relied on by 4,000+ global enterprises including Zomato, Tata Consumer, Subway, and Expedia — helping them turn web data into growth.
Watch how businesses like yours are using Actowiz data to drive growth.
From Zomato to Expedia — see why global leaders trust us with their data.
Backed by automation, data volume, and enterprise-grade scale — we help businesses from startups to Fortune 500s extract competitive insights across the USA, UK, UAE, and beyond.
We partner with agencies, system integrators, and technology platforms to deliver end-to-end solutions across the retail and digital shelf ecosystem.
Health insurance plan data guide 2026: sources by country, premium and benefits fields, network lists, compliance.
Explore Restaurant & Menu Data from RestaurantGuru UK to analyze restaurant listings, menus, pricing, ratings, and dining trends.
US spirits price data for 2026: DISCUS revenue and volume trends, category shifts, price tiers, control vs open states, tariffs and liquor price tracking.
Whether you're a startup or a Fortune 500 — we have the right plan for your data needs.