Core services
Enterprise Data Extraction

Scalable web, app and AI-powered collection across 40+ countries.

All 58 services →
New 2026
AI Training Data

Corpus building with provenance and opt-out compliance.

Learn more →
Free pilot
24-hour sample

We run collection on your own sources before you commit.

Get a sample →
58Services
40+Countries
DEVELOPER

Ready-Made Scrapers

Pre-built for top platforms. Self-serve, no setup.

View All →
TRY FREE

API Playground

Test endpoints instantly. No credit card.

Start Free →
28Tools
2SDKs
icons Delivery & SDKs
Streaming Crawl API Scheduler Realtime Alerts Webhook Delivery 🐍 Python SDK 💚 Node.js SDK
Need it managed instead?

Fixed monthly retainer, named engineer, no per-request metering.

Managed Data API →
HOT

Case Studies

How brands use Actowiz, with named outcomes.

Read →
FREE

Sample Datasets

Real output, no signup.

Download →
NEW

ROI Calculator

Model the return on a data engagement.

Calculate →
Big Basket India Twice a week Q-Commerce Dataset

Introduction

A diet app still shows last quarter's calorie figure for a popular burger. The chain changed its recipe last month, and the official number is now different. A meal-planning tool still lists a sauce as sesame-free after the supplier changed. Stale menu data is more than an inconvenience – for allergens it can mislead people.

Restaurant nutrition data is the structured record of calories, macronutrients and allergen information that restaurants publish for their menu items on nutrition pages, PDFs, delivery apps and menu boards. Restaurant-tech teams collect it, standardise it by item and portion, and monitor it for changes so apps and analytics stay current.

This guide is for restaurant-tech, nutrition and diet apps, food-service distributors, QSR brands and health-tech teams. It explains the rules that make restaurants publish this data, where it lives, which fields to capture, how to detect changes, and when to build or buy.

Last updated: 9 October 2026 | Author: Actowiz Solutions Data Team

Why does restaurant nutrition data exist in the first place?

Big Basket India Twice a week Q-Commerce Dataset

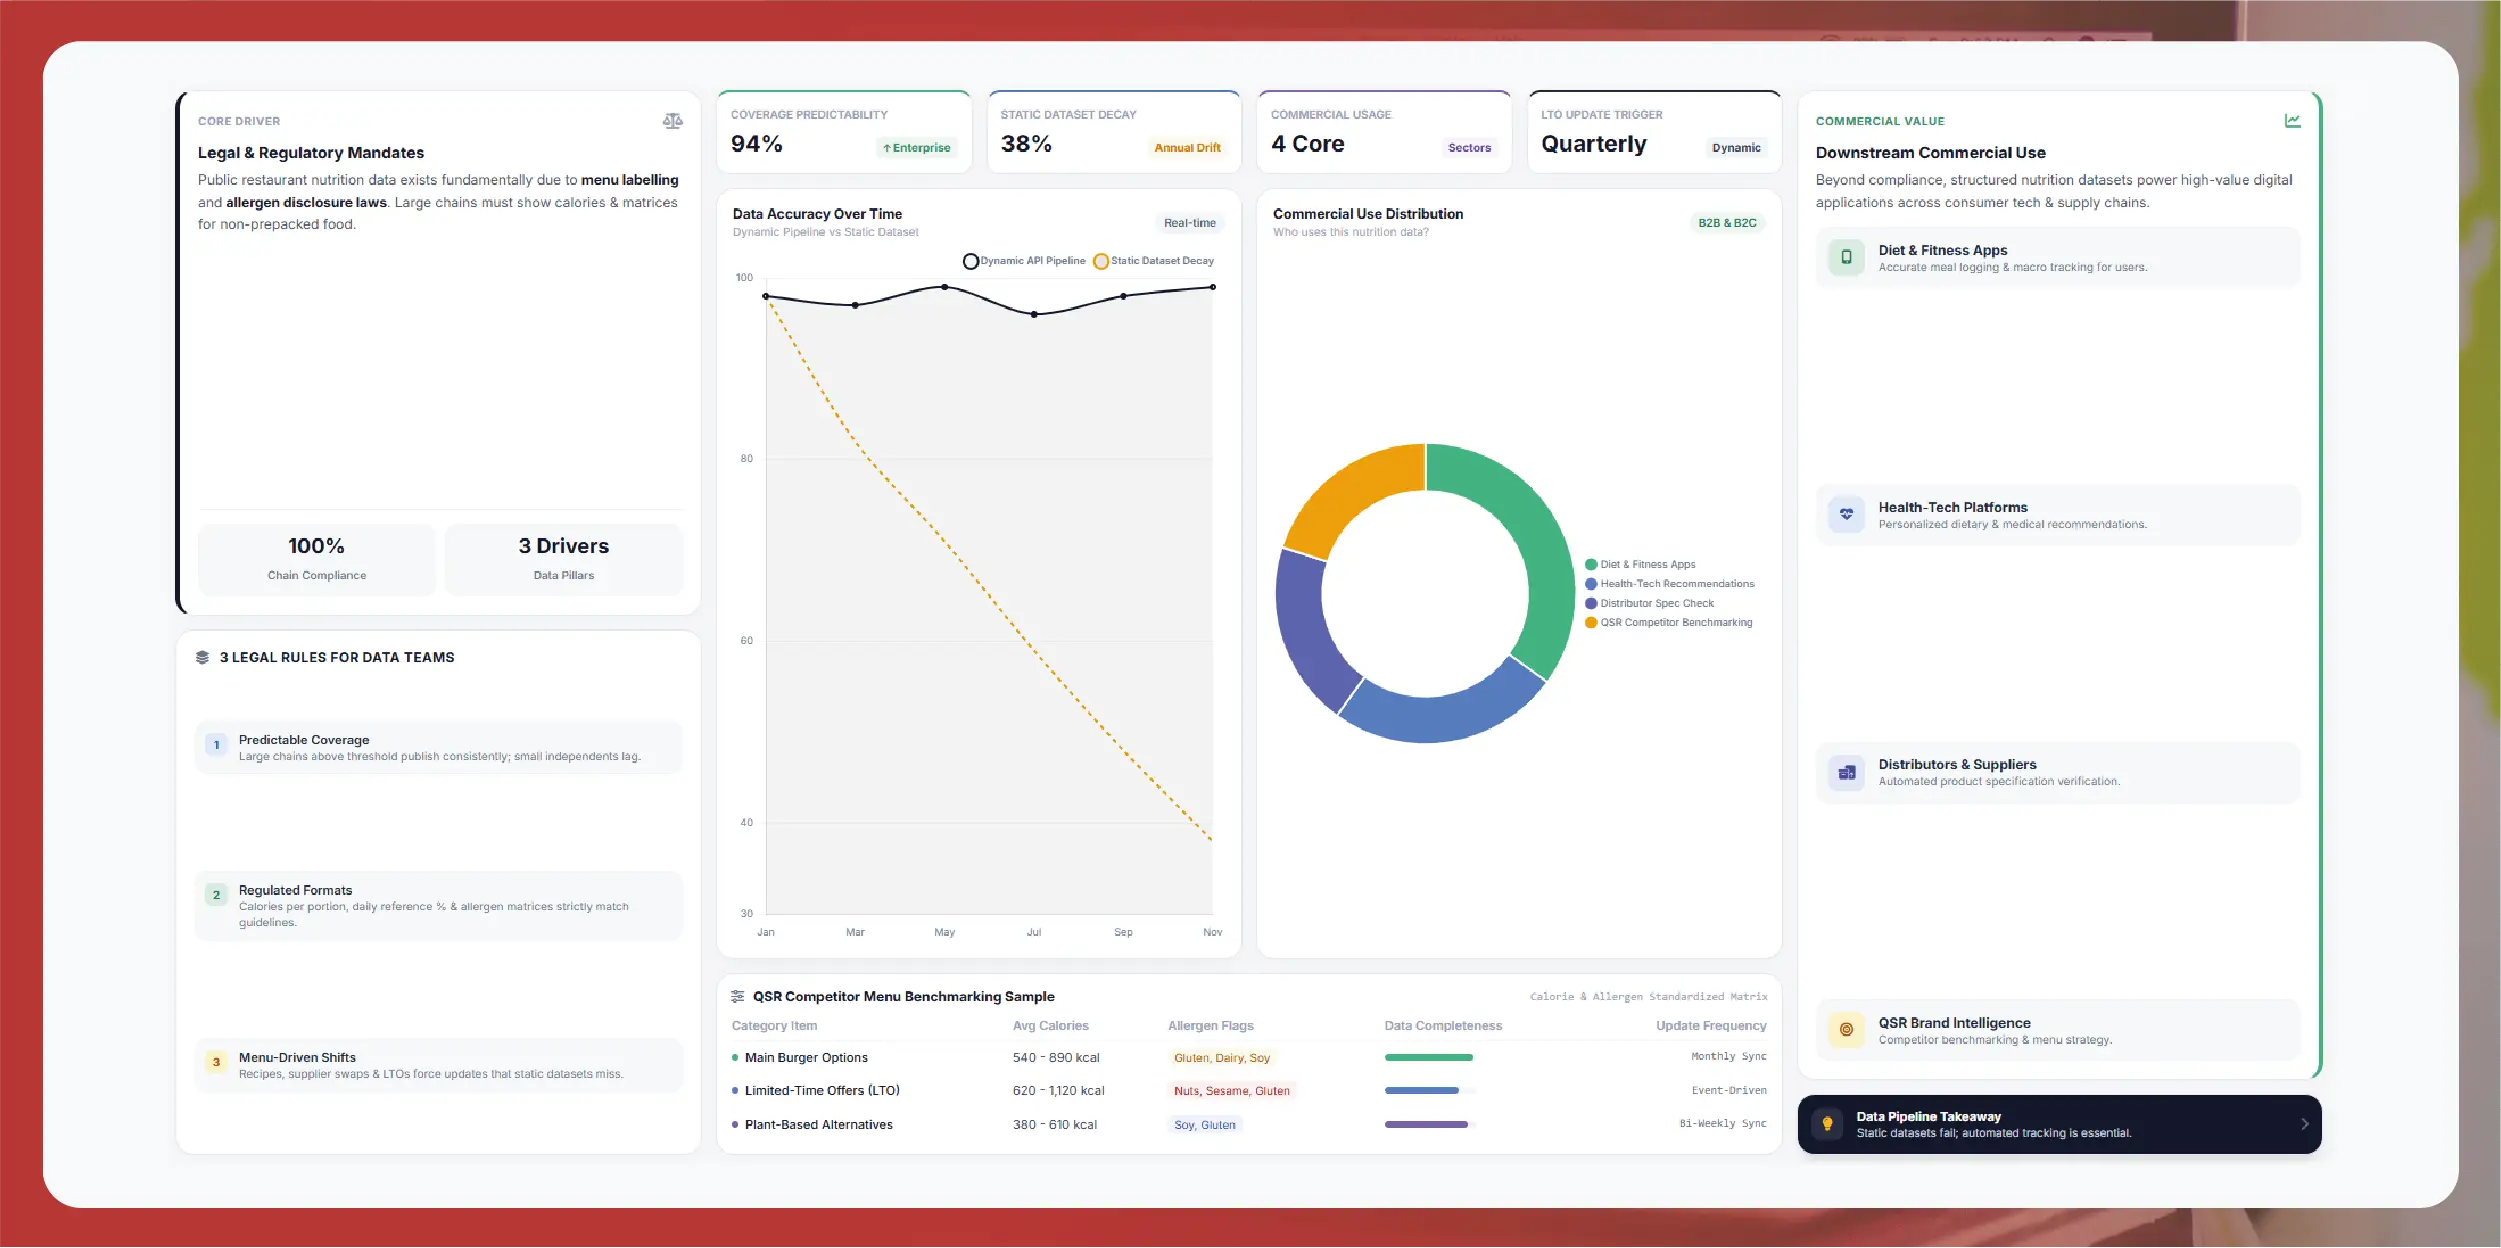
Most public restaurant nutrition data exists because menu labelling and allergen laws require it. Large chains in several countries must show calories on menus, and food businesses must give allergen information for non-prepacked food.

That legal backbone matters for data teams in three ways:

  • Coverage is predictable. Chains above a size threshold publish more consistently than small independents.
  • Formats follow the rule. Calories per portion, a daily reference statement and allergen matrices appear because regulators ask for them.
  • Changes follow menus. Recipe changes, new suppliers and limited-time offers all trigger updates that a static dataset will miss.

Nutrition and allergen data is also commercially useful. Diet apps need it to log meals, health-tech platforms use it in meal recommendations, distributors use it to check product specifications, and QSR brands benchmark their menus against competitors.

What do the rules require in each country?

Requirements differ by country, so a global restaurant nutrition data project must record which rule applies to each item. The table summarises the main official rules we checked today; always confirm current requirements with the regulator.

Country / region What is mandatory Who is covered Official source
United States Calories for standard menu items on menus and menu boards; written nutrition information (fats, cholesterol, sodium, carbohydrates, sugars, fibre, protein) available on request; compliance date 7 May 2018 Restaurants and similar retail food establishments in chains with 20 or more locations FDA menu labeling requirements
UK (England) – calories Kcal per portion next to the item, the portion size, and "adults need around 2000 kcal a day"; applies to online menus and delivery apps too; in force 6 April 2022 Businesses with 250 or more employees selling non-prepacked food for immediate consumption GOV.UK implementation guidance
UK – allergens Allergen information for every item containing any of the 14 allergens; can be given verbally if a clearly visible written notice is displayed Food businesses serving non-prepacked food GOV.UK allergen guidance
European Union 14 allergens must be declared for non-prepacked food under Regulation (EU) No 1169/2011 since 13 December 2014; national rules set the format (Ireland requires written information) Food businesses selling non-prepacked food FSAI – non-prepacked food
Australia – allergens For food not in packaging, allergen information must be displayed with the food or provided on request All food sellers FSANZ allergen labelling
Australia (NSW) – kilojoules Energy in kJ for each standard food item plus "The average adult daily energy intake is 8,700 kJ"; from 1 February 2011 Standard food outlets as defined by NSW law (other states have their own schemes) NSW Food Amendment Act 2010
India Calories (kcal per serving and serving size) on menu cards or boards, plus allergen information and veg/non-veg logos; effective 1 January 2022 Food service establishments with a central licence or outlets in 10 or more locations FSSAI notice (PDF)

The 14 allergens listed in the GOV.UK guidance are celery, cereals containing gluten, crustaceans, eggs, fish, lupin, milk, molluscs, mustard, peanuts, sesame, soybeans, sulphur dioxide and sulphites (above 10 parts per million), and tree nuts. Australia's list differs slightly – for example, FSANZ asks for each tree nut to be named separately – so store allergens as a country-aware code list, not free text.

Where does restaurant nutrition data live?

Restaurant nutrition data is spread across several public sources, and each one behaves differently. The richest source is usually the chain's own nutrition page or PDF; delivery apps add calories but rarely full nutrition panels.

  • Chain nutrition pages. Item-level calories, macronutrients and allergen filters, often with a nutrition calculator.
  • Nutrition and allergen PDFs. Full tables by item and size, typically versioned by date. These are the most complete and the hardest to parse.
  • Delivery apps and online menus. Calories by item where the law requires online display (for example in England), sometimes allergen notes.
  • In-store menu boards and kiosks. The legal display point for calories, but not practical to collect at scale; use the chain's digital equivalents instead.
  • Restaurant ordering websites. Item pages with portion sizes and customisation options.

Actowiz Solutions has delivered projects collecting menu calories and nutrition data from public restaurant nutrition pages. Our restaurant menu scraper and food data scraping services cover these sources; for packaged-food labels, see our nutrition data for grocery SKUs in Singapore example.

Which fields should a menu nutrition dataset include?

A useful dataset records the item, the portion, the nutrients, the allergens and the evidence behind each value. Without portion and source fields, two calorie numbers for the same burger cannot be compared.

Field Example Source type
brand / chain_name Example Burger Co. Nutrition page, delivery app
country / region UK (England) Site locale
item_name Classic Chicken Wrap Nutrition page, PDF, delivery app
item_category Wraps Menu structure
portion_size 1 wrap (230 g) PDF, nutrition page
energy_kcal / energy_kj 520 kcal / 2,180 kJ Menu, PDF, delivery app
fat_g, saturates_g, carbs_g, sugars_g, fibre_g, protein_g, salt_or_sodium 22 g, 6 g, 55 g… PDF, nutrition calculator
allergens_contains milk; cereals containing gluten; mustard Allergen matrix, PDF
allergens_may_contain sesame Allergen statement
dietary_flags vegetarian; veg/non-veg logo (India) Menu, delivery app
source_url / document_version PDF dated "September 2026" Every record
captured_at 2026-10-09T06:00Z Collection log

Example values are illustrative only. Keep "contains" and "may contain" separate, and never convert a missing allergen field into "allergen-free".

How do you detect nutrition and allergen changes?

Change detection means saving every version of each item's data, comparing it with the last version, and alerting only on meaningful differences. This is what turns a one-off scrape into a monitoring service.

A practical restaurant allergen tracking workflow:

  • Capture on a schedule. Collect nutrition pages, PDFs and delivery menus daily or weekly, depending on how often the chain updates.
  • Version everything. Store the raw file (HTML or PDF) with a hash, so you know instantly whether anything changed.
  • Parse to structured rows. Extract tables from PDFs into item-level fields; keep the page or table reference.
  • Diff by item key. Match items across versions using chain + item name + portion, then compare each field.
  • Classify the change. New item, removed item, calorie change, macro change, allergen added, allergen removed, portion change.
  • Set alert rules. Allergen additions or removals are high priority; small rounding changes in calories can be low priority.
  • Review and publish. A human checks high-priority alerts against the source before downstream apps update.

PDF diffing needs care: column shifts, merged cells and footnotes can look like changes. Compare parsed values, not raw text, and keep the before/after snippet in each alert.

Who uses menu calorie and allergen data?

The main buyers are teams that put menu items in front of consumers or make decisions about menus.

  • Nutrition and diet apps – let users log restaurant meals with up-to-date calories and macros.
  • Restaurant-tech platforms – power allergen filters, menu search and dietary tags.
  • Health-tech and meal-planning services – recommend items that fit a plan, with clear disclaimers.
  • Food-service distributors – check how customers' menus use their products and spot reformulations.
  • QSR brands – benchmark calorie ranges, portion sizes and allergen-free options against competitors. Our food delivery market intelligence work adds price and availability context, as in this menu and pricing tracking case study.

What are the accuracy and compliance caveats?

Restaurant nutrition data is informational. It reflects what the restaurant published at the time of capture, and recipes, suppliers and preparation can change before a dataset is refreshed.

  • Not medical advice. Apps should state that data is for general information and is not a substitute for professional advice.
  • Allergens: confirm with the restaurant. Consumers with allergies should always check with the restaurant before ordering. Cross-contact in kitchens is common and not always captured online.
  • Show the date and source. Display "as published by the restaurant on [date]" so users can judge freshness.
  • Public data only. Collect publicly available business information, respect site terms and applicable law, and avoid logins, paywalls or CAPTCHA workarounds. Menu data contains no personal data and should stay that way.

Should you build or buy a nutrition data pipeline?

Build if you track a handful of chains in one country and have engineers to maintain PDF parsers. Buy when you need many chains, several countries and reliable change alerts.

Factor Build in-house Managed data provider
Sources You write parsers for each site and PDF layout Provider maintains collectors for agreed sources
Change alerts You design versioning, diffing and alert rules Delivered as a feed or alert file on your schedule
Country rules You map allergen lists per country Country-aware fields and allergen codes included
Best fit One country, few chains Multi-country, many chains, frequent refresh

Ask any provider how they handle PDF changes, how they separate "contains" from "may contain", and how quickly they flag allergen changes.

Frequently Asked Questions

What is restaurant nutrition data?

Restaurant nutrition data is the set of calories, nutrients and allergen details that restaurants publish for their menu items. It usually comes from chain nutrition pages, downloadable PDFs and delivery apps. Data teams standardise it by item and portion size so apps, distributors and brands can compare menus and track changes over time.

Which restaurants must show calories on menus?

It depends on the country. In the US, chains with 20 or more locations must show calories under FDA rules. In England, businesses with 250 or more employees must show kcal per portion. In India, FSSAI rules cover establishments with a central licence or 10 or more outlets. Australian states run their own kilojoule schemes.

What are the 14 allergens?

Under EU and UK rules they are celery, cereals containing gluten, crustaceans, eggs, fish, lupin, milk, molluscs, mustard, peanuts, sesame, soybeans, sulphur dioxide and sulphites above 10 parts per million, and tree nuts. Australia uses a similar but not identical list, so datasets should store allergens with country-specific codes.

How often should menu allergen data be updated?

Weekly is a common baseline, with daily checks for chains that change menus often or run frequent limited-time offers. More important than frequency is versioning: keep each published version, diff it against the last one, and alert immediately when an allergen is added or removed so downstream apps can update quickly.

Can apps rely on scraped allergen data?

Apps can use published allergen data to help users filter menus, but it should never be the final word. Show the source and capture date, label it as informational, and tell users to confirm allergens with the restaurant before ordering. Recipes and kitchen practices can change faster than any dataset refreshes.

Tell us which chains, countries and fields you need. We'll share a sample of item-level calories, nutrients and allergens with source and capture date – contact sales to get started.
Talk to Actowiz Solutions
Social Proof That Converts

Trusted by Global Leaders Across Q-Commerce, Travel, Retail, and FoodTech

Our web scraping expertise is relied on by 4,000+ global enterprises including Zomato, Tata Consumer, Subway, and Expedia — helping them turn web data into growth.

4,000+ Enterprises Worldwide
50+ Countries Served
20+ Industries
Join 4,000+ companies growing with Actowiz →
Real Results from Real Clients

Hear It Directly from Our Clients

Watch how businesses like yours are using Actowiz data to drive growth.

▶
1 min
★★★★★
"Actowiz Solutions offered exceptional support with transparency and guidance throughout. Anna and Saga made the process easy for a non-technical user like me. Great service, fair pricing!"
TG
Thomas Galido
Co-Founder / Head of Product at Upright Data Inc.
▶
2 min
★★★★★
"Actowiz delivered impeccable results for our company. Their team ensured data accuracy and on-time delivery. The competitive intelligence completely transformed our pricing strategy."
II
Iulen Ibanez
CEO / Datacy.es
▶
1:30
★★★★★
"What impressed me most was the speed — we went from requirement to production data in under 48 hours. The API integration was seamless and the support team is always responsive."
FC
Febbin Chacko
-Fin, Small Business Owner
icons 4.8/5 Average Rating
icons 50+ Video Testimonials
icons 92% Client Retention
icons 50+ Countries Served

Join 4,000+ Companies Growing with Actowiz

From Zomato to Expedia — see why global leaders trust us with their data.

Why Global Leaders Trust Actowiz

Backed by automation, data volume, and enterprise-grade scale — we help businesses from startups to Fortune 500s extract competitive insights across the USA, UK, UAE, and beyond.

icons
7+
Years of Experience
Proven track record delivering enterprise-grade web scraping and data intelligence solutions.
icons
4,000+
Projects Delivered
Serving startups to Fortune 500 companies across 50+ countries worldwide.
icons
200+
In-House Experts
Dedicated engineers across scrapers, AI/ML models, APIs, and data quality assurance.
icons
9.2M
Automated Workflows
Running weekly across eCommerce, Quick Commerce, Travel, Real Estate, and Food industries.
icons
270+ TB
Data Transferred
Real-time and batch data scraping at massive scale, across industries globally.
icons
380M+
Pages Crawled Weekly
Scaled infrastructure for comprehensive global data coverage with 99% accuracy.

AI Solutions Engineered
for Your Needs

→
LLM-Powered Attribute Extraction: High-precision product matching using large language models for accurate data classification.
→
Advanced Computer Vision: Fine-grained object detection for precise product classification using text and image embeddings.
→
GPT-Based Analytics Layer: Natural language query-based reporting and visualization for business intelligence.
→
Human-in-the-Loop AI: Continuous feedback loop to improve AI model accuracy over time.
icons Product Matching icons Attribute Tagging icons Content Optimization icons Sentiment Analysis icons Prompt-Based Reporting

Connect the Dots Across
Your Retail Ecosystem

We partner with agencies, system integrators, and technology platforms to deliver end-to-end solutions across the retail and digital shelf ecosystem.

icons
Analytics Services
icons
Ad Tech
icons
Price Optimization
icons
Business Consulting
icons
System Integration
icons
Market Research
Become a Partner →

Popular Datasets — Ready to Download

Browse All Datasets →
icons
Amazon
eCommerce
Free 100 rows
icons
Zillow
Real Estate
Free 100 rows
icons
DoorDash
Food Delivery
Free 100 rows
icons
Walmart
Retail
Free 100 rows
icons
Booking.com
Travel
Free 100 rows
icons
Indeed
Jobs
Free 100 rows

Latest Insights & Resources

View All Resources →
thumb
Blog

Restaurant Nutrition Data: How Restaurant-Tech Teams Track Menu Calories and Allergen Changes (2026 Guide)

Restaurant nutrition data guide 2026: where menu calories and allergen data live, key fields, rules by country and how to track changes.

thumb
Case Study

How We Helped a Leading E-Commerce Brand Streamline Product Data Analysis Using Snapdeal Product Data API

Use Snapdeal Product Data API to collect product, pricing, catalog, and marketplace data for competitive analysis and smarter retail decisions.

thumb
Report

Amazon.ae vs Noon Price Data: Market Data Report 2026 for UAE E-Commerce Price Intelligence

Amazon.ae vs Noon price data for 2026: category price gaps, Buy Box and seller mix, delivery promises and sale events. Request a UAE sample dataset today.

Start Where It Makes Sense for You

Whether you're a startup or a Fortune 500 — we have the right plan for your data needs.

icons
Enterprise
Book a Strategy Call
Custom solutions, dedicated support, volume pricing for large-scale needs.
icons
Growing Brand
Get Free Sample Data
Try before you buy — 500 rows of real data, delivered in 2 hours. No strings.
icons
Just Exploring
View Plans & Pricing
Transparent plans from $500/mo. Find the right fit for your budget and scale.
Get in Touch
Let's Talk About
Your Data Needs
Tell us what data you need — we'll scope it for free and share a sample within hours.
  • icons
    Free Sample in 2 HoursShare your requirement, get 500 rows of real data — no commitment.
  • icons
    Plans from $500/monthFlexible pricing for startups, growing brands, and enterprises.
  • icons
    US-Based SupportOffices in New York & California. Aligned with your timezone.
  • icons
    ISO 9001 & 27001 CertifiedEnterprise-grade security and quality standards.
Request Free Sample Data
Fill the form below — our team will reach out within 2 hours.
+1 ▼
✓ Free 500-row sample · No credit card · Response within 2 hours

Request Free Sample Data

Our team will reach out within 2 hours with 500 rows of real data — no credit card required.

+1 ▼
✓ Free 500-row sample · No credit card · Response within 2 hours