Introduction
Brands operating in Saudi Arabia’s rapidly expanding quick-commerce ecosystem need accurate data to solve three connected problems: what customers want, where inventory should be positioned, and how quickly orders can be fulfilled. Saudi Arabia Quick Commerce Market Data 2026 helps retailers, marketplaces, grocery platforms, FMCG companies, and delivery businesses monitor product availability, prices, demand signals, competitors, delivery promises, and assortment changes.
The market is becoming increasingly competitive. One 2026 market estimate puts Saudi Arabia’s quick-commerce market at approximately US$2.38 billion in 2026, compared with US$1.93 billion in 2025, while forecasting continued expansion through 2032.
For brands, growth alone is not enough. A product being listed does not guarantee that it is actually available. A low advertised price may disappear when promotions change. A 15-minute delivery promise is valuable only when the nearest fulfillment point has the right stock.
This is where Quick Commerce Data Scraping Services can help businesses collect structured information from websites and mobile applications, normalize it, validate it, and turn it into analytics-ready intelligence.
What is changing across Saudi Arabia’s rapid-delivery ecosystem?
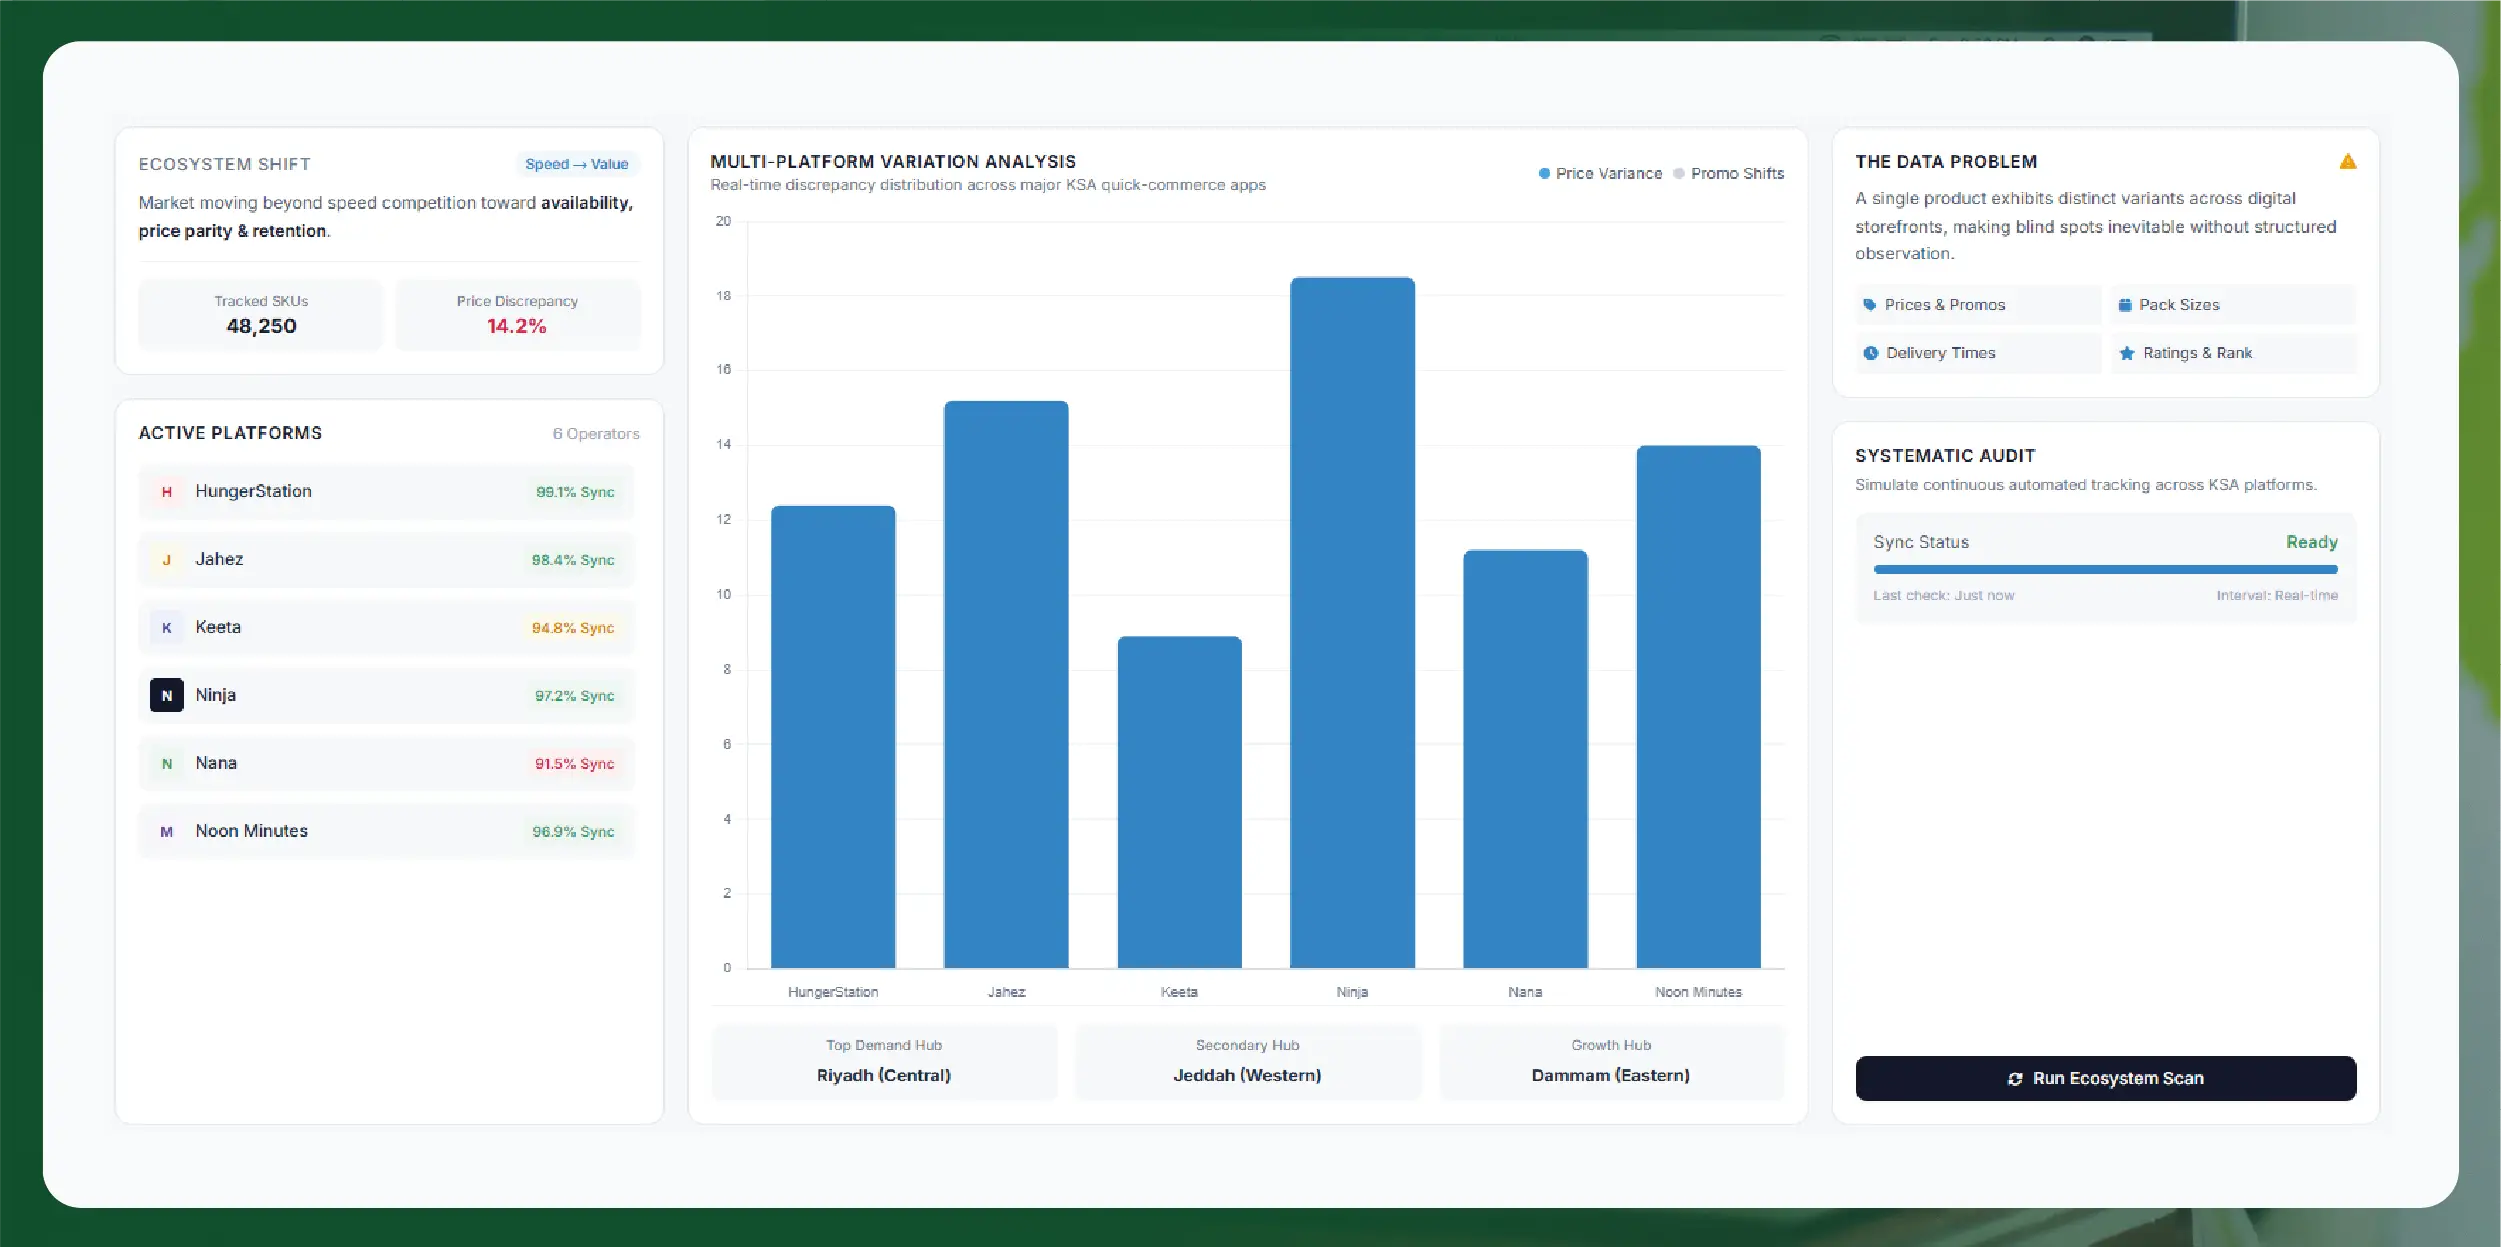
Saudi Arabia’s quick-commerce market is moving from simple speed competition toward a broader battle around availability, assortment, price, fulfillment efficiency, and customer retention.
Major platforms and operators such as HungerStation, Jahez, Keeta, Ninja, Nana, and Noon Minutes are contributing to an increasingly competitive digital delivery environment. Industry research also identifies Riyadh, Jeddah, Dammam, and other major urban centers as important demand hubs.
For consumer brands, this creates a data problem.
A single product can have different:
- Prices across platforms
- Promotional discounts
- Availability statuses
- Delivery times
- Product descriptions
- Pack sizes
- Ratings and reviews
- Search rankings
- Seller or merchant information
- Geographic availability
Without systematic monitoring, these changes are difficult to track at scale.
How can brands understand the competitive landscape more accurately?
Saudi Arabia Quick Commerce Industry Analysis gives brands a structured way to understand how the market is developing across platforms, categories, cities, and delivery models.
The objective is not simply to collect competitor information. The real value comes from connecting multiple data points to identify operational and commercial patterns.
For example, a grocery brand can compare:
| Intelligence Area |
What Brands Can Monitor |
Business Value |
| Product assortment |
SKUs and categories |
Identify assortment gaps |
| Price |
Regular and promotional prices |
Improve price positioning |
| Availability |
In-stock/out-of-stock status |
Detect supply issues |
| Delivery |
Promised delivery windows |
Benchmark service |
| Promotions |
Discounts and offers |
Track competitive pressure |
| Reviews |
Ratings and customer feedback |
Identify product issues |
| Visibility |
Search/category placement |
Measure digital presence |
Third-party estimates suggest that Saudi Arabia's quick-commerce market could increase from around US$1.93 billion in 2025 to US$2.38 billion in 2026, indicating that the competitive opportunity is expanding alongside the need for better operational intelligence.
For FMCG and grocery brands, the implication is straightforward: market growth creates more data, not less competition.
A structured dataset can help decision-makers determine which products are consistently visible, which competitors are discounting aggressively, and where availability problems may be reducing potential sales.
How does data improve competitive decision-making?
Saudi Arabia Q-Commerce Market Intelligence enables brands to move beyond isolated price checks and build a broader view of the competitive environment.
Consider a beverage brand selling products across several quick-commerce platforms. Monitoring only price could reveal that a competitor is cheaper. Monitoring price, stock, promotion, placement, and delivery together can reveal why that competitor is gaining visibility.
For example:
| Metric |
Brand A |
Brand B |
Brand C |
| Average listed price |
SAR 12.50 |
SAR 11.90 |
SAR 13.20 |
| Discount frequency |
18% |
31% |
12% |
| Availability |
94% |
87% |
96% |
| Average delivery promise |
24 min |
18 min |
27 min |
| Rating |
4.5 |
4.3 |
4.6 |
Illustrative example for analytical purposes.
The business question changes from “Who has the lowest price?” to:
“Which combination of price, availability, promotion, and delivery promise is creating the strongest competitive position?”
That distinction is important for brands trying to protect margins.
Market intelligence can also be segmented by city. Riyadh may show a different competitive structure from Jeddah or Dammam because assortment, fulfillment infrastructure, customer behavior, and delivery density can vary by location.
Brands can therefore create dashboards covering:
- Platform-level price comparisons
- City-level availability
- SKU-level stock movement
- Competitor promotion frequency
- Delivery-time benchmarking
- Category-level assortment
- Brand visibility
- Rating and review changes
- New product introductions
This transforms raw web and app information into decision-ready intelligence.
Which market trends should quick-commerce businesses monitor?
Saudi Arabia Q-Commerce Market Trends & Insights should focus on the signals that directly influence purchasing, fulfillment, and customer experience.
One important trend is the continued expansion from food delivery toward broader grocery, household, pharmacy, personal-care, electronics, and convenience categories. Industry reports identify grocery, pharmacy, and other everyday-use products as important parts of the Saudi Q-commerce opportunity.
Another trend is the importance of dark stores and micro-fulfillment. For rapid delivery, inventory must be located close enough to consumers to support the promised delivery window.
Research published in 2026 reports that Ninja had reached approximately 100 dark stores across 28 Saudi cities, illustrating the scale of physical infrastructure being developed to support rapid fulfillment.
What changed from 2020 to 2026?
From 2020 onward, Saudi Arabia’s digital grocery and delivery ecosystem has increasingly shifted toward convenience-led and high-frequency purchasing. The pandemic accelerated consumer acceptance of online ordering, while subsequent years brought stronger competition, broader assortments, more sophisticated delivery networks, and greater emphasis on profitability. Market estimates from one research provider put quick-commerce market value at roughly US$293 million in 2020 and US$1.93 billion in 2025, with a modeled 2026 value of US$2.38 billion. These figures are third-party estimates rather than official government statistics and should therefore be treated as market-sizing indicators.
The 2020–2022 period established convenience as a stronger purchasing behavior. Between 2023 and 2024, operators increasingly focused on assortment, delivery density, customer retention, and technology. By 2025, competition had become more concentrated, while operators increasingly looked beyond discount-led acquisition toward sustainable order economics. Redseer’s Q3 2025 analysis, for example, showed HungerStation, Jahez, and Keeta holding significant GBV positions while smaller players faced pressure from discounting and changing strategies.
By 2026, the strategic question is no longer simply whether consumers will use quick commerce. It is whether platforms and brands can efficiently satisfy demand while controlling stockouts, delivery costs, promotions, and customer expectations.
For brands, this makes continuous data collection more valuable than occasional market research.
What does the 2026 market outlook mean for businesses?
Saudi Arabia Q-Commerce Market Size and Growth 2026 is important because market expansion creates both opportunity and operational complexity.
One current market estimate projects Saudi Arabia’s quick-commerce market at approximately US$2.384 billion in 2026, up from US$1.930 billion in 2025. The same forecast estimates the market could reach approximately US$8.472 billion by 2032.
Estimated market trajectory
| Year |
Estimated Market Size |
Estimated YoY Growth |
| 2020 |
US$293M |
— |
| 2021 |
US$480M |
63.8% |
| 2022 |
US$720M |
50.0% |
| 2023 |
US$1.013B |
40.7% |
| 2024 |
US$1.444B |
42.5% |
| 2025 |
US$1.930B |
33.7% |
| 2026 |
US$2.384B |
23.5% |
Source: Third-party market estimate; figures should be treated as indicative market-sizing data, not official statistics.
The numbers point to a key business challenge: larger market opportunity means more SKUs, more competitors, more locations, and more pricing events to monitor.
Brands can use market data to answer questions such as:
- Which categories are expanding fastest?
- Which products appear most frequently across platforms?
- Which brands have the strongest availability?
- Where are stockouts increasing?
- Which competitors use aggressive promotions?
- Which cities show stronger assortment expansion?
- Which products have consistent customer demand?
- How does delivery speed vary between competitors?
The answers can inform assortment planning, pricing strategy, inventory allocation, promotional planning, and partner negotiations.
How can brands monitor grocery availability and pricing at scale?
Scrape Saudi grocery delivery market data, Saudi Arabia Quick Commerce Market Data 2026 can provide a structured foundation for monitoring the rapidly changing grocery environment.
The objective is not to collect data once. Quick commerce requires recurring monitoring because prices, availability, promotions, and delivery windows can change throughout the day.
A practical grocery dataset can include:
| Data Field |
Example Use |
| Product name |
Product identification |
| Brand |
Brand benchmarking |
| Category |
Category analysis |
| SKU/Product ID |
Unique product tracking |
| Pack size |
Like-for-like comparison |
| Regular price |
Baseline pricing |
| Discounted price |
Promotion analysis |
| Discount percentage |
Competitive promotion tracking |
| Availability |
Stock monitoring |
| Delivery estimate |
Service benchmarking |
| Product URL |
Source verification |
| Rating |
Customer perception |
| Review count |
Demand/engagement signal |
| Platform |
Competitive comparison |
| City/Location |
Geographic analysis |
| Collection timestamp |
Historical trend analysis |
For example, an FMCG manufacturer can monitor the same SKU across several quick-commerce platforms and compare its listed price with competitor products.
A retailer can monitor stockouts and determine whether unavailable products are concentrated in specific cities or categories.
A delivery platform can benchmark delivery promises against competing services.
An investor or market researcher can analyze assortment expansion and platform coverage over time.
The broader online grocery opportunity is also substantial. One 2026 market estimate values Saudi Arabia's online grocery delivery market at about US$4.29 billion in 2026, with more than 100 million estimated completed orders.
Because different research firms define market boundaries differently, these figures should not be directly combined with narrower Q-commerce estimates. Instead, they demonstrate the broader commercial scale surrounding digital grocery and rapid fulfillment.
Which metrics should a 2026 market dataset include?
A Saudi Quick Commerce Market Data Report 2026 should go beyond a simple list of products and prices. It should connect product-level information with competitive, geographic, and operational metrics.
Core metrics for businesses
Core metrics for businesses
| Metric |
Why It Matters |
| SKU availability rate |
Identifies stock reliability |
| Average selling price |
Supports price benchmarking |
| Promotion frequency |
Measures competitive intensity |
| Discount depth |
Identifies aggressive pricing |
| Assortment breadth |
Measures category strength |
| Delivery promise |
Benchmarks customer experience |
| Rating average |
Tracks customer perception |
| Review volume |
Measures engagement |
| New SKU rate |
Detects assortment expansion |
| Stockout frequency |
Highlights supply problems |
| Platform coverage |
Measures digital distribution |
| City coverage |
Supports geographic planning |
The dataset becomes more valuable when captured at regular intervals.
For example:
Daily monitoring can identify price and stock changes.
Weekly monitoring can reveal promotional patterns.
Monthly monitoring can show assortment and competitive shifts.
Historical monitoring can identify seasonal demand and recurring stockout patterns.
This supports a more proactive operating model.
Instead of discovering that a product was unavailable after losing sales, a brand can identify recurring stockout patterns and adjust replenishment.
Instead of learning about competitor promotions through customer feedback, a retailer can detect them directly through structured monitoring.
Instead of manually checking dozens of product pages, analysts can use a centralized dataset and dashboard.
How can brands turn market data into better operational decisions?
The real benefit of quick-commerce intelligence is its ability to connect market signals with business actions.
1. Improve inventory planning
Brands can compare availability across platforms and locations to identify persistent stock gaps. If a product repeatedly disappears from one city while remaining available elsewhere, the problem may be regional inventory allocation rather than overall supply.
2. Improve pricing decisions
Regular price monitoring can reveal competitor price movements, discount frequency, and promotional intensity. Businesses can use this information to create more informed pricing strategies without relying solely on manual checks.
3. Improve delivery benchmarking
Delivery promises can be captured by location and platform. Brands can then compare service levels and understand whether their delivery proposition is competitive.
4. Improve assortment decisions
Tracking product availability and new listings can show which categories competitors are expanding. This can support decisions around new SKUs, pack sizes, and category expansion.
5. Improve customer experience
Ratings, reviews, availability, and delivery information can collectively highlight friction points. A product may have strong demand but weak reviews because of packaging, freshness, substitutions, or delivery issues.
How can Actowiz Solutions help businesses solve these challenges?
Actowiz Solutions can help brands build scalable data pipelines for digital commerce intelligence across websites and mobile applications.
The focus is on converting fragmented marketplace and quick-commerce information into structured datasets that business teams can actually use.
A customized Saudi Arabia Quick Commerce Market Data 2026 solution can support:
- Product and SKU monitoring
- Price and discount tracking
- Inventory and stockout monitoring
- Competitor assortment analysis
- Delivery-time benchmarking
- City-level data collection
- Product ranking monitoring
- Ratings and review collection
- Historical data storage
- Recurring data collection
- Structured API or database delivery
- Analytics-ready datasets
- Custom dashboards and reporting
Actowiz Solutions can combine Web Scraping with Mobile App Scraping to capture relevant data from digital commerce environments where information may be presented differently across desktop websites and applications.
The resulting real-time dataset can be delivered in a structured format according to business requirements.
For brands operating across multiple cities and platforms, the solution can also be designed around a defined SKU universe. This allows the business to track the same products consistently rather than relying on broad, inconsistent searches.
A practical workflow
Source discovery → Data extraction → Product/SKU matching → Data normalization → Validation → Historical storage → Analytics → Business action
This approach helps reduce manual monitoring and creates a repeatable intelligence framework.
For example, an FMCG company could track 5,000 SKUs across several platforms, capture prices and availability at scheduled intervals, compare competitors, and generate alerts when important changes occur.
A grocery marketplace could monitor category assortment, competitor promotions, delivery promises, and stockouts.
A consumer brand could use historical data to determine whether its digital shelf visibility is improving or declining.
The exact collection frequency, platforms, locations, fields, and delivery format can be customized around the organization's commercial objectives.
What should businesses do with quick-commerce intelligence?
The most valuable datasets are not necessarily the largest. They are the datasets that answer specific business questions.
A brand should begin with a clear problem:
- Inventory problem: Which products are frequently unavailable?
- Pricing problem: Which competitors are undercutting us?
- Delivery problem: Where are our delivery promises weaker?
- Demand problem: Which products and categories are gaining visibility?
- Assortment problem: Which SKUs are competitors adding?
- Customer problem: Which products are receiving declining ratings?
Once the question is defined, the data collection architecture can be designed around the required fields and frequency.
This buyer-focused approach prevents unnecessary data collection and makes the resulting dataset easier for commercial, category, supply-chain, and strategy teams to use.
Conclusion
Saudi Arabia's rapid-delivery ecosystem is becoming more data-intensive as platforms expand assortment, improve fulfillment networks, and compete for high-frequency consumer spending. Businesses that rely only on occasional manual checks can miss critical changes in prices, inventory, promotions, delivery promises, and competitor activity.
A structured Saudi Arabia Quick Commerce Market Data 2026 strategy can help brands build continuous visibility into these changes and turn fragmented digital information into actionable intelligence.
The key is to connect product-level data with business outcomes. Price monitoring should support pricing decisions. Stock monitoring should improve inventory planning. Delivery monitoring should improve customer experience. Assortment monitoring should support category strategy.
With scalable data collection, businesses can replace fragmented manual checks with consistent, historical, and analytics-ready intelligence.
Ready to strengthen your quick-commerce intelligence and make faster, data-driven decisions? Connect with Actowiz Solutions for customized data collection and market intelligence solutions.
You can also reach us for all your mobile app scraping, data collection, web scraping , and instant data scraper service requirements!

 Pricing & Promotions
MAP Violations Brand Protection Counterfeit Detection Price Intelligence AI HOT Data Intelligence
Pricing & Promotions
MAP Violations Brand Protection Counterfeit Detection Price Intelligence AI HOT Data Intelligence Brand & Intelligence
Share of Search Content Audit & PDP Reviews & Ratings Retail Media Buy Box Monitoring Social Commerce HOT Live Commerce NEW Agentic Commerce NEW
Brand & Intelligence
Share of Search Content Audit & PDP Reviews & Ratings Retail Media Buy Box Monitoring Social Commerce HOT Live Commerce NEW Agentic Commerce NEW Digital Shelf & Search
Assortment Planning Competitive Benchmarking Product Availability Q-Commerce NEW
Digital Shelf & Search
Assortment Planning Competitive Benchmarking Product Availability Q-Commerce NEW AssortmentE-commerce Intelligence Hyperlocal Insights POI & Store Locator DTC Brand Analytics NEW
 For Retailers
 E-Commerce Dashboard
 Flipkart Insights (Live) #1
 Grocery Intelligence
.svg) Grocery Price (U.S.)
Grocery Price (U.S.)
.svg) Quick Commerce (India) HOT
Quick Commerce (India) HOT
 Food & Restaurant
 Fashion Intelligence
 Automotive
 Travel & Hospitality
 Real Estate
 Food Delivery Intelligence NEW
 OTT & Streaming NEW
 By Use Case
 Pricing Intelligence
 Digital Shelf Analytics
 MAP Monitoring HOT
 Cross-Border Price Parity NEW
 Share of Search
 Review Sentiment
 Kitchen Market Gaps NEW
 Dynamic Pricing / AI Repricing NEW
 Promotions & Deals Alerts NEW
 B2B / POI & Lead Data NEW
 By Region🇮🇳 India 🇺🇸 USA 🇦🇪 Middle East 🇬🇧 UK 🇦🇺 Australia 🌏 SE Asia 🇪🇺 Europe 🌎 LATAMIndia
 Flipkart Real-Time Insights
 Quick Commerce — Zepto · Blinkit
 Pincode Price Tracker
Middle East
Pincode Price Tracker
Middle East GCC Q-Commerce — Talabat · Noon NEW
UK & Australia
GCC Q-Commerce — Talabat · Noon NEW
UK & Australia UK Grocery — Tesco, Sainsbury's, Asda
 AU Grocery — Coles & Woolworths NEW
 Marketplace Scrapers
Amazon API TikTok Shop API HOT Uber Eats API Airbnb API Zepto / Blinkit API Instacart API NEW Talabat API NEW
Marketplace Scrapers
Amazon API TikTok Shop API HOT Uber Eats API Airbnb API Zepto / Blinkit API Instacart API NEW Talabat API NEW Developer APIsWeb Extract API Reviews API SERP API Pricing Webhook NEW
 Universal APIsStreaming Crawl API Scheduler Realtime Alerts Webhook Delivery 🐍 Python SDK 💚 Node.js SDK
 Delivery & SDKs
 Knowledge Center
Digital Shelf Playbook MAP Compliance Guide Pricing Intel Guide Scraping Compliance TikTok Shop Guide NEW Cross-Border Guide NEW
Knowledge Center
Digital Shelf Playbook MAP Compliance Guide Pricing Intel Guide Scraping Compliance TikTok Shop Guide NEW Cross-Border Guide NEW Guides & Playbooks
🎉 Seasonal & event tracking NEWBlack Friday pricing report Festive season, India Ramadan, GCC grocery All seasonal reportsSample Datasets HOT ROI Calculator NEW API Postman Collection Demo Dashboards Free API Playground NEW Press Kit
Guides & Playbooks
🎉 Seasonal & event tracking NEWBlack Friday pricing report Festive season, India Ramadan, GCC grocery All seasonal reportsSample Datasets HOT ROI Calculator NEW API Postman Collection Demo Dashboards Free API Playground NEW Press Kit Downloads & Tools
Trust Center About Us FAQs Careers
Downloads & Tools
Trust Center About Us FAQs Careers Trust & CompanyRetail shelf research NEWRetail shelf research






































 4.8/5 Average Rating
 50+ Video Testimonials
 92% Client Retention
 50+ Countries Served