Core services
Enterprise Data Extraction

Scalable web, app and AI-powered collection across 40+ countries.

All 58 services →
New 2026
AI Training Data

Corpus building with provenance and opt-out compliance.

Learn more →
Free pilot
24-hour sample

We run collection on your own sources before you commit.

Get a sample →
58Services
40+Countries
DEVELOPER

Ready-Made Scrapers

Pre-built for top platforms. Self-serve, no setup.

View All →
TRY FREE

API Playground

Test endpoints instantly. No credit card.

Start Free →
28Tools
2SDKs
icons Delivery & SDKs
Streaming Crawl API Scheduler Realtime Alerts Webhook Delivery 🐍 Python SDK 💚 Node.js SDK

Need it managed instead?

Fixed monthly retainer, named engineer, no per-request metering.

Managed Data API →
HOT

Case Studies

How brands use Actowiz, with named outcomes.

Read →
FREE

Sample Datasets

Real output, no signup.

Download →
NEW

ROI Calculator

Model the return on a data engagement.

Calculate →
UK Grocery Market Benchmarking 2026

Introduction

UK Grocery Market Benchmarking 2026 helps retailers understand how competitors price products, structure promotions, manage assortments, and respond to changing consumer demand. For grocery businesses, the core challenge is not simply collecting prices; it is creating a consistent, comparable view of the market across retailers, categories, SKUs, pack sizes, and promotional periods.

Food price inflation has changed considerably over the past few years. ONS data shows annual food and non-alcoholic beverage inflation averaged 0.6% in 2020, 0.3% in 2021, accelerated to 10.9% in 2022 and 14.5% in 2023, before easing to 2.7% in 2024 and 4.2% in 2025. In August 2026, the rate was 1.3%. (Office for National Statistics)

This volatility makes continuous benchmarking valuable for retailers, FMCG manufacturers, pricing teams, category managers, and market intelligence professionals.

With Grocery Data Scraping Services, businesses can collect structured product, price, promotion, availability, and assortment information from relevant retail channels. The resulting datasets can support price benchmarking, competitor analysis, assortment planning, promotional evaluation, and strategic decision-making.

What Has Changed in UK Grocery Pricing Since 2020?

The UK grocery market has experienced several distinct pricing phases since 2020. The pandemic changed shopping behaviour and accelerated digital adoption, while the inflationary period that followed created substantial pressure on household budgets and retailer pricing strategies.

YearFood & Non-Alcoholic Beverage Annual InflationMarket Context
20200.6%Pandemic-era shopping disruption
20210.3%Relatively subdued food inflation
202210.9%Major inflation acceleration
202314.5%Peak annual food inflation in this series
20242.7%Significant inflation easing
20254.2%Inflation increased again
2026*1.3%August annual rate
  • 2026 figure represents August 2026, not a full-year average. ONS. (Office for National Statistics)

2020–2026 Market Evolution

In 2020, grocery retailers operated in an environment shaped by pandemic restrictions, changing shopping missions, supply constraints, and increased online purchasing. In 2021, food inflation remained comparatively low at 0.3%, but grocery businesses were already adapting to changed consumer behaviour. In 2022, the environment shifted sharply as food inflation reached 10.9%. By 2023, annual food and non-alcoholic beverage inflation reached 14.5%, creating a much greater need for competitive price monitoring. Inflation then eased to 2.7% in 2024 before increasing to 4.2% in 2025. By August 2026, the annual rate had fallen to 1.3%, the lowest rate since September 2021 according to ONS. (Office for National Statistics)

The lesson for retailers is that annual market reports alone cannot explain weekly SKU-level movements. Benchmarking needs historical context and frequent product-level observations.

How Can Retailers Compare Prices More Consistently?

How Can Retailers Compare Prices More Consistently?

UK Grocery Price Benchmarking 2026 provides a framework for comparing equivalent products across retailers, categories, brands, pack sizes, and promotional states.

A useful benchmark should distinguish between regular shelf prices and temporary promotional prices. Comparing a £2.50 standard price with a £1.75 promotional price without recording the promotion period can create misleading conclusions. Retail teams therefore need datasets that retain price type, product identity, pack size, retailer, date, and promotional status.

Benchmarking MetricWhat It ShowsBusiness Use
Average SKU priceMarket price levelPricing reviews
Lowest comparable priceCompetitive floorPrice positioning
Price gap %Difference between retailersCompetitor monitoring
Promotional discount %Discount depthPromotion analysis
Price per unitNormalized comparisonPack-size benchmarking
Price movementChange over timeDynamic pricing analysis

2020–2026 Perspective

The 2020–2021 period established the importance of flexible grocery monitoring as consumers changed shopping patterns. The sharp inflation experienced during 2022 and 2023 made simple historical price comparisons less reliable because absolute price levels were moving rapidly. In 2024, easing inflation created a different challenge: retailers needed to distinguish between genuine competitive price movements and broader market normalization. During 2025, food inflation accelerated again to 4.2%, reinforcing the importance of ongoing monitoring. By August 2026, food and non-alcoholic beverage inflation was 1.3%, while prices still increased 0.4% month-on-month. (Office for National Statistics)

For pricing teams, this means benchmarks should be refreshed frequently. A monthly comparison may be useful for strategic planning, while daily or weekly collection can support tactical pricing decisions.

What Product and Pricing Signals Should Retailers Track?

UK Grocery Product & Pricing Intelligence combines product-level information with pricing and promotional signals to provide a broader view of competitive positioning.

Retailers should not benchmark price alone. Product availability, pack size, brand, category, promotion type, product attributes, and price-per-unit can materially affect the comparison.

What Should a Retail Dataset Contain?

Data FieldExample Application
Product nameSKU identification
BrandBrand-level comparison
CategoryCategory benchmarking
Pack sizeComparable product matching
Regular priceBaseline price
Sale pricePromotional comparison
DiscountPromotion intensity
AvailabilityAssortment visibility
Product URLSource verification
Collection dateHistorical tracking

2020–2026 Perspective

In 2020, product availability became a critical retail intelligence signal as demand shifted rapidly across categories. By 2021, retailers had more experience with digital grocery shopping and online product discovery. During 2022 and 2023, inflation made price data increasingly important, but product-level context remained essential because brands and retailers changed pack sizes, promotions, and assortment strategies. In 2024 and 2025, as inflation moderated and then increased again, retailers needed to distinguish between broad market price movements and retailer-specific decisions. In 2026, ONS reported food and non-alcoholic beverage inflation at 1.3% in August, while BRC reported UK food sales increased 2.6% year-on-year in August 2026. (Office for National Statistics)

For this reason, a useful benchmark should connect price with the exact product being compared. This improves SKU matching and prevents businesses from drawing conclusions from superficially similar products.

How Can Market Share and Pricing Be Connected?

UK Grocery Market Share & Pricing Analysis becomes more useful when retailers connect competitive pricing with observable sales, assortment, and channel signals.

Market share should not be inferred solely from scraped prices. Reliable share estimates require an appropriate sales or consumer measurement source. However, retail price and assortment datasets can provide important explanatory context around why competitive positions may change.

SignalBenchmarking Question
Retailer assortmentWhich categories receive the most shelf space?
SKU availabilityWhich products are consistently listed?
Price positionIs a retailer positioned above or below peers?
Promotion frequencyHow often are products discounted?
Discount depthHow aggressive are promotions?
New listingsWhich products are entering the market?

2020–2026 Perspective

The period from 2020 to 2021 changed grocery shopping frequency, channels, and digital purchasing behaviour. From 2022 through 2023, high food inflation altered consumer price sensitivity and increased the importance of value positioning. In 2024, overall Great Britain retail sales volumes increased 0.7%, following declines of 2.9% in 2023 and 4.1% in 2022; ONS also reported that food-store sales volumes fell in 2024, although the decline was smaller than in the preceding two years. (Office for National Statistics) In 2025, food inflation rose to 4.2%, while in August 2026 it was 1.3%. (Office for National Statistics)

For analysts, the key takeaway is that market share and pricing should be evaluated together but not conflated. A retailer's pricing position can be benchmarked from product data, while market share should be sourced from appropriate sales or consumer datasets. Combining the two creates a stronger analytical framework.

Which Data Points Create a Reliable Retail Benchmark?

UK Grocery Retail Benchmarking Data can transform fragmented retailer information into a consistent analytical structure.

A reliable benchmark requires common identifiers and standardized fields. Without normalization, a product listed as “500g,” “0.5kg,” or “500 gram” may incorrectly appear as different products. Similar issues can occur with brand names, product descriptions, multipacks, promotions, and unit prices.

Essential Data Quality Controls

ControlPurpose
SKU matchingPrevent duplicate product records
Brand normalizationImprove cross-retailer comparison
Pack-size standardizationEnable fair comparisons
Price validationDetect extraction errors
Duplicate removalMaintain dataset integrity
Date stampingBuild historical trends
Availability checksSeparate listed from unavailable products

2020–2026 Perspective

During 2020 and 2021, rapidly changing shopping conditions increased the need for flexible datasets. In 2022 and 2023, the scale of grocery price changes made historical comparisons more complex. A product price captured without its collection date could quickly become outdated. In 2024, food-store sales volumes remained under pressure even as overall retail volumes recovered, highlighting why category-specific analysis matters. (Office for National Statistics) In 2025, food and non-alcoholic beverage inflation reached 4.2%, while the food price index continued moving upward. (Office for National Statistics) By August 2026, annual food inflation had eased to 1.3%, but monthly prices still rose 0.4%. (Office for National Statistics)

A benchmark therefore needs historical snapshots rather than a single static dataset. Date-stamped records enable retailers to distinguish temporary movements from persistent pricing trends.

Why Does Real-Time Monitoring Matter for Grocery Retailers?

UK Grocery Real-time price monitoring allows retailers to detect changes closer to when they occur instead of relying only on periodic market reviews.

Grocery prices can change because of promotions, supplier costs, seasonal demand, competitor activity, inventory conditions, and retailer strategy. A monitoring system can alert teams when selected SKUs cross predefined thresholds or when competitor pricing changes.

Monitoring EventPotential Action
Competitor price decreaseReview price position
Competitor promotion startsAssess promotional response
SKU becomes unavailableInvestigate assortment position
Price increasesRecalculate benchmark
New product appearsUpdate assortment view
Promotion endsRestore baseline comparison

2020–2026 Perspective

The digital shift accelerated during 2020 and 2021, increasing the importance of online product visibility. During the inflation surge of 2022 and 2023, frequent price changes made static research less useful for operational decisions. In 2024, food-store sales volumes remained challenging even while overall retail volumes recovered. (Office for National Statistics) In 2025, food inflation rose to 4.2%, creating another period where price movements needed close observation. (Office for National Statistics) In August 2026, food and non-alcoholic beverage inflation was 1.3%, while BRC reported food sales growth of 2.6% year-on-year for the four weeks ending 29 August. (Office for National Statistics)

Real-time monitoring does not mean every SKU must be collected every minute. The appropriate frequency depends on the business objective. Daily collection may suit fast-moving competitive categories, while weekly collection can be sufficient for slower-moving assortment analysis.

How Can Daily Collection Improve Competitive Visibility?

Extract Daily Grocery Price Across UK Retailers gives pricing teams a structured way to maintain current competitive observations across selected retailers and categories.

Daily collection can be especially useful for high-priority SKUs, promotional products, private-label comparisons, and categories with frequent price movements. The goal is not simply to collect more data. The objective is to collect the right fields at a frequency that supports a specific business decision.

A Practical Daily Monitoring Framework

FrequencySuitable Use
DailyHigh-priority SKU monitoring
2–3 times weeklyPromotion-heavy categories
WeeklyGeneral grocery benchmarking
MonthlyStrategic category analysis
Historical snapshotsTrend and seasonal analysis

2020–2026 Perspective

In 2020, frequent collection became more relevant because product availability and consumer demand could change rapidly. In 2021, digital grocery channels continued to mature. The sharp inflationary period of 2022–2023 increased the value of frequent price observations because historical prices could become outdated quickly. In 2024, overall Great Britain retail volumes returned to growth, rising 0.7% year-on-year, although food-store volumes still declined. (Office for National Statistics) In 2025, food inflation increased to 4.2%, reinforcing the need to maintain current benchmarks. (Office for National Statistics) By August 2026, food inflation had eased to 1.3%, but the BRC still recorded 2.6% year-on-year food sales growth for August. (Office for National Statistics)

Daily datasets can therefore support both tactical and historical analysis. Retailers can compare today's prices with yesterday's, last week's, last month's, or the same period in a previous year.

How Can Actowiz Solutions Help Retailers Build Better Benchmarks?

UK Grocery Market Benchmarking 2026 requires more than a list of prices. Retailers need standardized, date-stamped, comparable datasets that can be connected to pricing, assortment, promotional, and competitive workflows.

Actowiz Solutions can design a data collection framework around specific retailers, categories, products, geographic markets, and collection frequencies. The workflow can include product discovery, SKU matching, price extraction, promotion identification, availability monitoring, normalization, validation, historical storage, and structured delivery.

Flexible Retail Data Collection

Businesses can select the retailers and categories most relevant to their competitive strategy. Data fields can be customized around product names, brands, pack sizes, regular prices, sale prices, discounts, product URLs, availability, and collection dates.

Automated Recurring Monitoring

Recurring workflows can capture updated information at daily, weekly, or other defined intervals. This creates a historical dataset rather than a one-time snapshot.

Analysis-Ready Output

Structured datasets can be delivered in formats suitable for analytics, dashboards, internal databases, and reporting workflows. This allows pricing and category teams to focus on interpretation rather than repetitive data preparation.

Supporting Broader Market Research

Actowiz Solutions can also support UK Grocery Market Analysis by combining product, pricing, promotional, and assortment signals into datasets designed around specific business questions.

What Can Retailers Learn From the 2020–2026 Data Pattern?

The 2020–2026 period demonstrates why grocery benchmarking needs both historical context and current observations.

PeriodKey Data SignalBenchmarking Implication
2020Food inflation 0.6%Establish baseline
2021Food inflation 0.3%Monitor post-pandemic shifts
2022Food inflation 10.9%Increase price tracking
2023Food inflation 14.5%Strengthen SKU-level comparison
2024Food inflation 2.7%Separate normalization from competition
2025Food inflation 4.2%Refresh competitive benchmarks
Aug. 2026Food inflation 1.3%Maintain current monitoring

ONS data shows that the food price environment moved from relatively low inflation in 2020–2021 to substantial inflation in 2022–2023 and then moderated considerably. (Office for National Statistics)

This pattern has a direct implication for retail data strategy: benchmark definitions should remain stable while the underlying observations are refreshed frequently. A retailer can then identify whether a price change is part of a broad market movement or a retailer-specific action.

Why Is Structured Data Better Than Manual Competitor Research?

Manual research can provide useful snapshots, but it becomes difficult to scale when teams need to compare thousands of products across several retailers.

A structured dataset can answer questions such as:

How frequently do promotions appear?

How does a retailer's private-label pricing compare with branded alternatives?

How have prices changed compared with previous periods?

The key advantage is consistency. Every observation can be captured using the same field structure, collection date, and normalization rules.

This makes the dataset easier to analyze and allows pricing teams to move from manually searching retailer websites toward repeatable competitive intelligence workflows.

Conclusion

UK Grocery Market Benchmarking 2026 is increasingly important for retailers that need to understand changing prices, promotions, assortments, and competitor positioning. ONS data demonstrates how dramatically the food inflation environment changed between 2020 and 2026, while recent BRC data shows that grocery sales continue to move within a changing retail environment. (Office for National Statistics)

The practical answer is a structured, recurring data strategy. Retailers can combine product-level pricing, promotions, availability, and historical observations to build a more consistent view of competitive movements.

Actowiz Solutions can help businesses collect, normalize, validate, and organize retail data for pricing intelligence, assortment analysis, competitor monitoring, and market research.

Ready to strengthen your UK grocery competitive intelligence? Contact Actowiz Solutions to build a customized retail data collection solution for your business!

You can also reach us for all your mobile app scraping, data collection, web scraping, and instant data scraper service requirements!

Web Scraping can support large-scale retailer data collection, while Mobile App Scraping can help businesses monitor relevant app-based grocery channels. A structured Real-time dataset can then support ongoing pricing and competitive analysis.

You can also reach us for all your mobile app scraping, data collection, web scraping , and instant data scraper service requirements!

Social Proof That Converts

Trusted by Global Leaders Across Q-Commerce, Travel, Retail, and FoodTech

Our web scraping expertise is relied on by 4,000+ global enterprises including Zomato, Tata Consumer, Subway, and Expedia — helping them turn web data into growth.

4,000+ Enterprises Worldwide
50+ Countries Served
20+ Industries
Join 4,000+ companies growing with Actowiz →
Real Results from Real Clients

Hear It Directly from Our Clients

Watch how businesses like yours are using Actowiz data to drive growth.

▶
1 min
★★★★★
"Actowiz Solutions offered exceptional support with transparency and guidance throughout. Anna and Saga made the process easy for a non-technical user like me. Great service, fair pricing!"
TG
Thomas Galido
Co-Founder / Head of Product at Upright Data Inc.
▶
2 min
★★★★★
"Actowiz delivered impeccable results for our company. Their team ensured data accuracy and on-time delivery. The competitive intelligence completely transformed our pricing strategy."
II
Iulen Ibanez
CEO / Datacy.es
▶
1:30
★★★★★
"What impressed me most was the speed — we went from requirement to production data in under 48 hours. The API integration was seamless and the support team is always responsive."
FC
Febbin Chacko
-Fin, Small Business Owner
icons 4.8/5 Average Rating
icons 50+ Video Testimonials
icons 92% Client Retention
icons 50+ Countries Served

Join 4,000+ Companies Growing with Actowiz

From Zomato to Expedia — see why global leaders trust us with their data.

Why Global Leaders Trust Actowiz

Backed by automation, data volume, and enterprise-grade scale — we help businesses from startups to Fortune 500s extract competitive insights across the USA, UK, UAE, and beyond.

icons
7+
Years of Experience
Proven track record delivering enterprise-grade web scraping and data intelligence solutions.
icons
4,000+
Projects Delivered
Serving startups to Fortune 500 companies across 50+ countries worldwide.
icons
200+
In-House Experts
Dedicated engineers across scrapers, AI/ML models, APIs, and data quality assurance.
icons
9.2M
Automated Workflows
Running weekly across eCommerce, Quick Commerce, Travel, Real Estate, and Food industries.
icons
270+ TB
Data Transferred
Real-time and batch data scraping at massive scale, across industries globally.
icons
380M+
Pages Crawled Weekly
Scaled infrastructure for comprehensive global data coverage with 99% accuracy.

AI Solutions Engineered
for Your Needs

→
LLM-Powered Attribute Extraction: High-precision product matching using large language models for accurate data classification.
→
Advanced Computer Vision: Fine-grained object detection for precise product classification using text and image embeddings.
→
GPT-Based Analytics Layer: Natural language query-based reporting and visualization for business intelligence.
→
Human-in-the-Loop AI: Continuous feedback loop to improve AI model accuracy over time.
icons Product Matching icons Attribute Tagging icons Content Optimization icons Sentiment Analysis icons Prompt-Based Reporting

Connect the Dots Across
Your Retail Ecosystem

We partner with agencies, system integrators, and technology platforms to deliver end-to-end solutions across the retail and digital shelf ecosystem.

icons
Analytics Services
icons
Ad Tech
icons
Price Optimization
icons
Business Consulting
icons
System Integration
icons
Market Research
Become a Partner →

Popular Datasets — Ready to Download

Browse All Datasets →
icons
Amazon
eCommerce
Free 100 rows
icons
Zillow
Real Estate
Free 100 rows
icons
DoorDash
Food Delivery
Free 100 rows
icons
Walmart
Retail
Free 100 rows
icons
Booking.com
Travel
Free 100 rows
icons
Indeed
Jobs
Free 100 rows

Latest Insights & Resources

View All Resources →
thumb
Blog

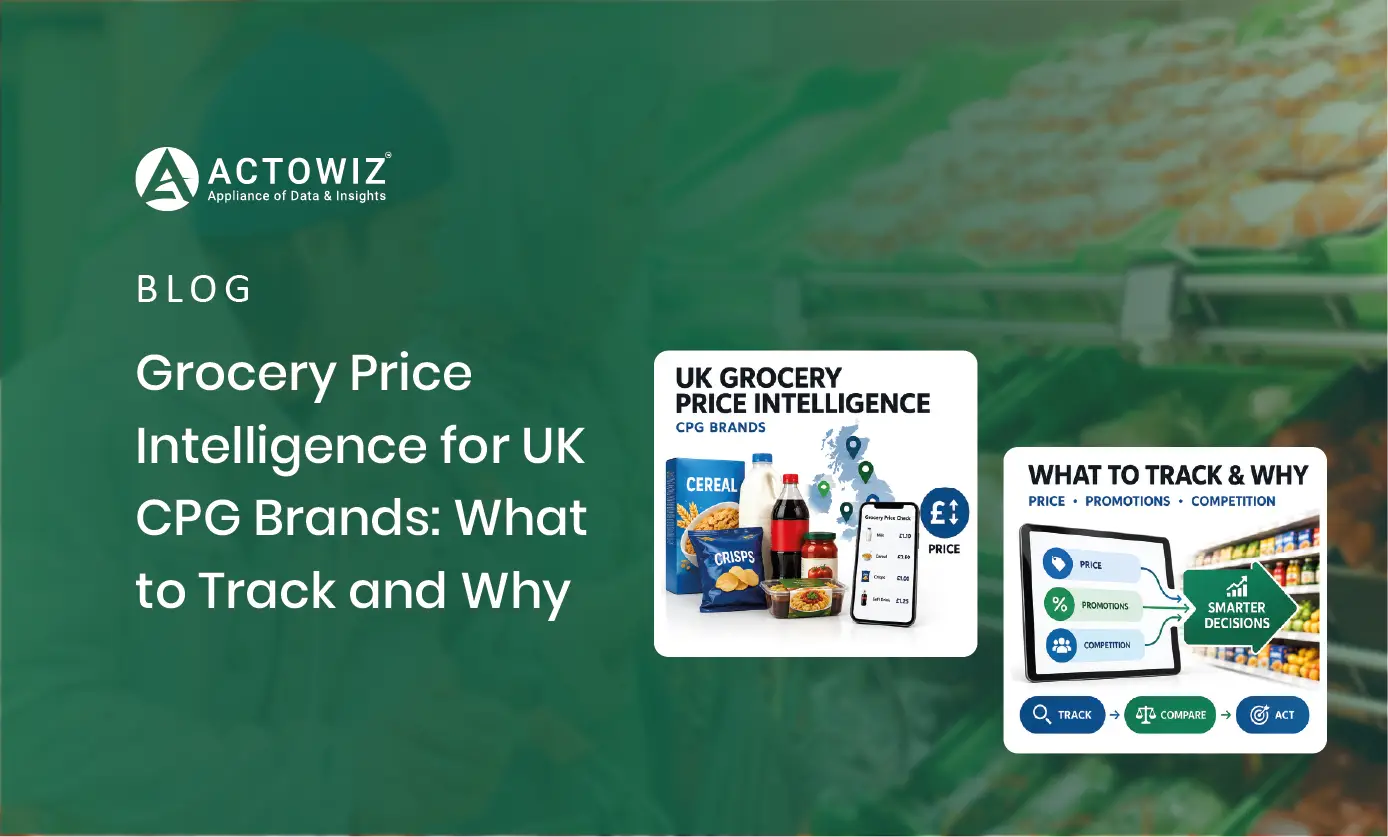
Grocery Price Intelligence for UK CPG Brands: What to Track and Why

Discover how UK CPG brands can use grocery price intelligence to track competitor prices, promotions, product availability, assortment, and market trends.

thumb
Case Study

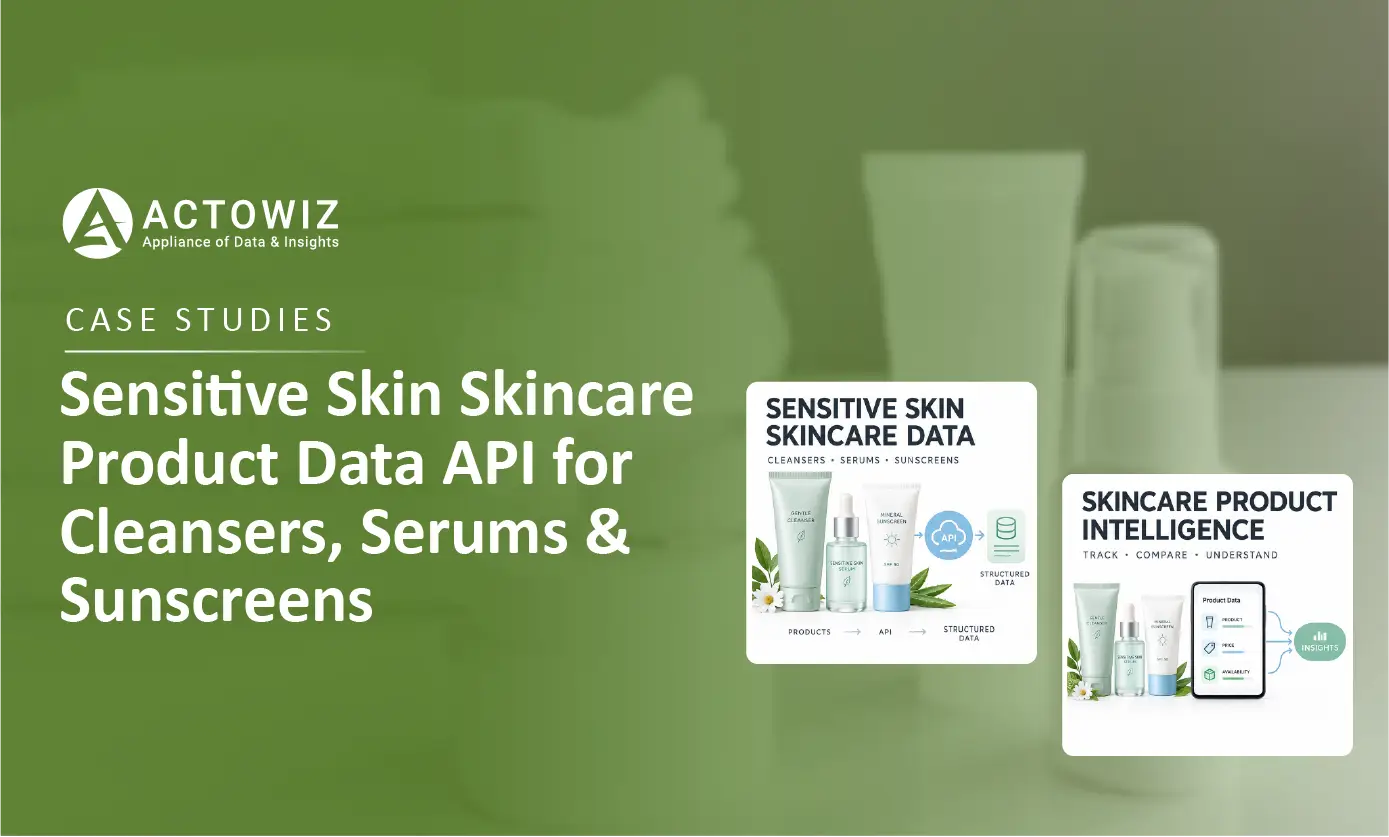
How Sensitive Skin Skincare Product Data API Helps Brands Track Cleansers, Serums, Moisturizers, and Sunscreens

Sensitive Skin Skincare Product Data API helps brands track cleansers, serums, moisturizers, and sunscreens with structured product data.

thumb
Report

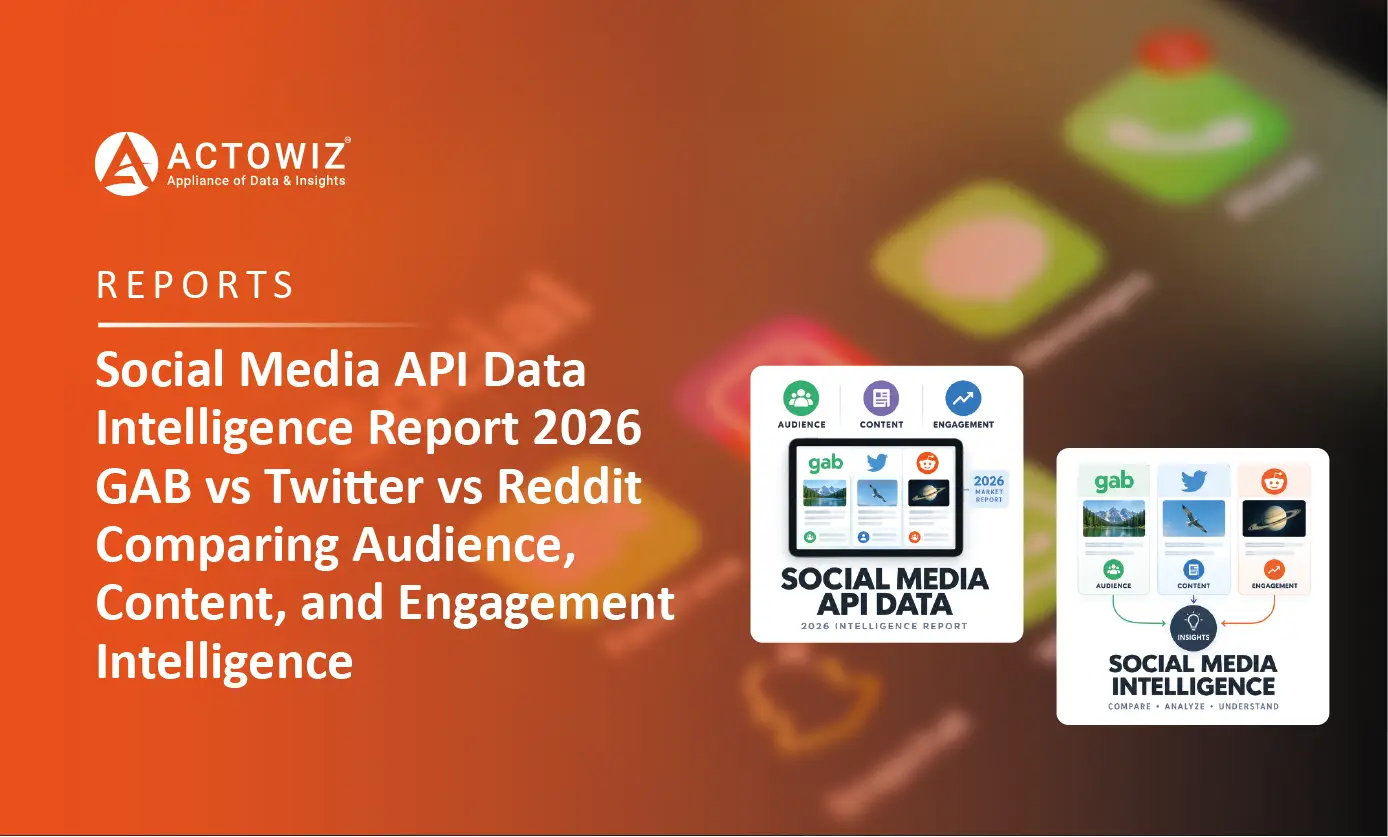
Social Media API Data Intelligence Report 2026 - GAB vs Twitter vs Reddit - Comparing Audience, Content, and Engagement Intelligence

Social Media API Data Intelligence Report 2026 compares GAB, Twitter, and Reddit to uncover audience, content, engagement, and market insights.

Start Where It Makes Sense for You

Whether you're a startup or a Fortune 500 — we have the right plan for your data needs.

icons
Enterprise
Book a Strategy Call
Custom solutions, dedicated support, volume pricing for large-scale needs.
icons
Growing Brand
Get Free Sample Data
Try before you buy — 500 rows of real data, delivered in 2 hours. No strings.
icons
Just Exploring
View Plans & Pricing
Transparent plans from $500/mo. Find the right fit for your budget and scale.
Get in Touch
Let's Talk About
Your Data Needs
Tell us what data you need — we'll scope it for free and share a sample within hours.
  • icons
    Free Sample in 2 HoursShare your requirement, get 500 rows of real data — no commitment.
  • icons
    Plans from $500/monthFlexible pricing for startups, growing brands, and enterprises.
  • icons
    US-Based SupportOffices in New York & California. Aligned with your timezone.
  • icons
    ISO 9001 & 27001 CertifiedEnterprise-grade security and quality standards.
Request Free Sample Data
Fill the form below — our team will reach out within 2 hours.
+1 ▼
✓ Free 500-row sample · No credit card · Response within 2 hours

Request Free Sample Data

Our team will reach out within 2 hours with 500 rows of real data — no credit card required.

+1 ▼
✓ Free 500-row sample · No credit card · Response within 2 hours