NEW 2026

GCC Quick Commerce

Talabat · Careem Quik · Noon Minutes — live pricing across Dubai, Riyadh, Abu Dhabi & Jeddah. 18 GCC cities.

Launch Demo →
HOT

KitchenIntel

Cloud kitchen market gaps, ghost-kitchen tracking & strategy simulator. Plans from ₹9,999/mo.

See Pricing →

UK Grocery Price Tracker

Tesco · Sainsbury's · Asda · Morrisons · Aldi — daily price comparison across all major UK grocers.

Get Early Access →
11+Dashboards
99.9%Accuracy
Want THIS view for your brand · your city · your category? Custom dashboard in 7 days. Free Consultation →
Crex Data Scraping - Solving Accuracy and Data Consistency Issues in Cricket Analytics

Introduction

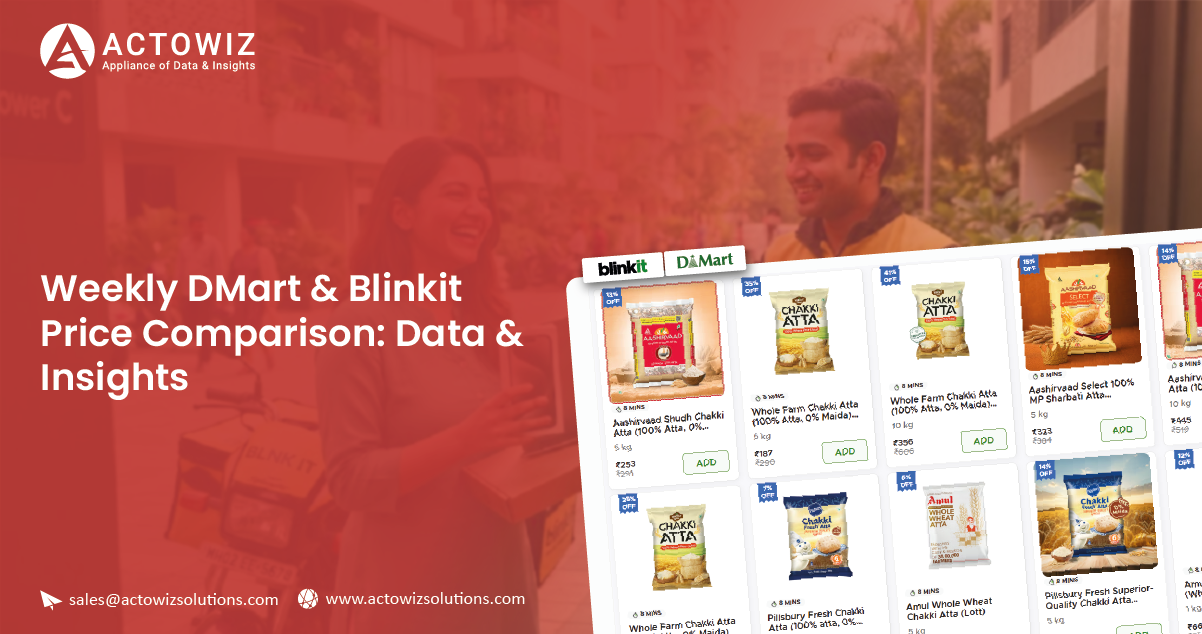
Two very different companies are competing for the same Indian grocery basket, and they are doing it with almost opposite business models.

DMart wins on price. Its entire operating philosophy — owned real estate, no-frills stores, ruthless supply-chain efficiency, everyday low pricing rather than deep-and-frequent promotions — is built to be structurally cheaper than everyone else on the shelf. You go there, you queue, you save.

Blinkit wins on time. Ten minutes, at your door, at 11pm, without changing out of your pyjamas. Convenience is the product, and convenience has a price.

The interesting question — the one that every FMCG brand, retailer, investor and category manager in India is quietly trying to answer — is: how much does that convenience cost? Is the gap 8%? 25%? Does it vary by category? By city? By day of the week? Does it narrow during Blinkit's promotional pushes and widen during DMart's? And is it moving?

Nobody can answer that from intuition, and nobody can answer it from a one-off screenshot comparison of ten SKUs. It needs a Weekly DMart & Blinkit price comparison built from real data — the same SKUs, matched properly, tracked consistently, week after week, at the category and pincode level.

This guide covers exactly how to build that: what to collect, how to match SKUs across two completely different catalogue structures, the sample data, what the comparison actually reveals, and how Actowiz Solutions runs these programs for brands, retailers and investors across India.

Why This Comparison Is Harder Than It Looks

Crex Data Scraping - Solving Accuracy and Data Consistency Issues in Cricket Analytics

A five-minute manual check will tell you that a 1kg bag of atta costs different amounts on DMart and Blinkit. It will not tell you anything reliable. Here is why.

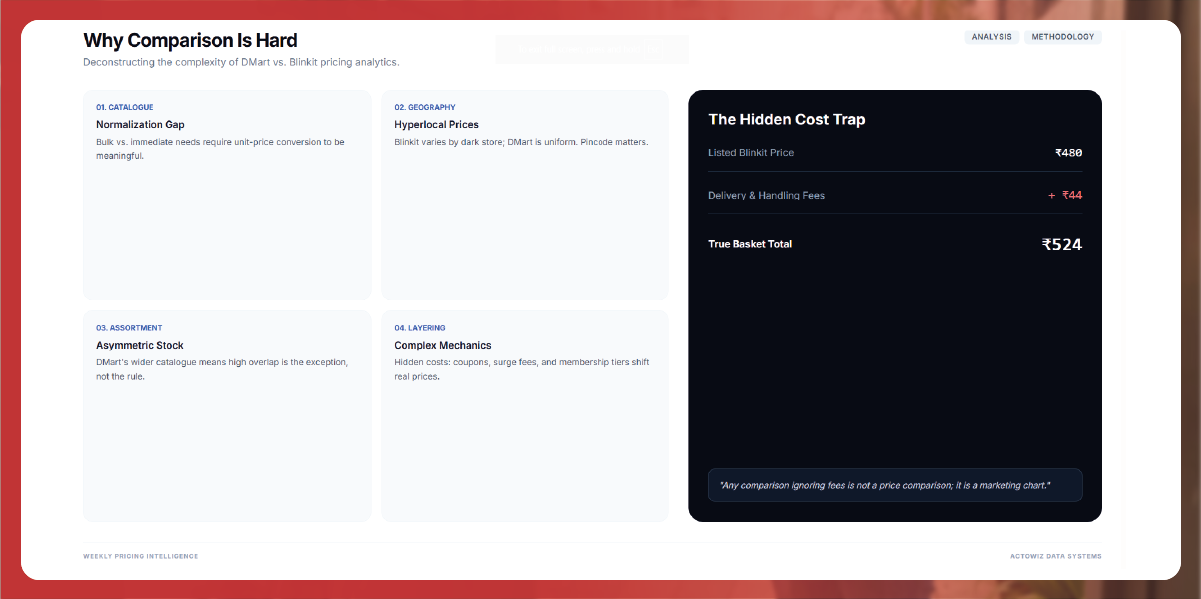
  • The catalogues do not align. DMart's assortment is built around bulk value packs — the 5kg oil can, the 10kg atta bag, the combo pack of four soaps. Blinkit's assortment is built around immediate need — the 1L oil bottle, the 1kg atta pack, the single soap. Comparing a 5kg pack to a 1kg pack on absolute price is meaningless. Everything must be normalized to price per unit — per kg, per litre, per 100g, per piece — before any comparison is legitimate.

  • Blinkit is hyperlocal; DMart is not. Blinkit prices and assortment vary by dark store, which means by pincode. DMart's pricing is far more uniform. A single "Blinkit price" does not exist — there is a Blinkit price in Powai, and a different one in Andheri. Any credible comparison has to fix a location, or explicitly compare across them.


  • Availability is not symmetric. A Blinkit dark store carries a few thousand SKUs. A DMart store carries far more. A large share of DMart's catalogue simply has no Blinkit equivalent — and the SKUs where they do overlap are precisely the interesting ones.
  • The discount mechanics are completely different. DMart's advantage is baked into the shelf price. Blinkit's pricing is layered — MRP, a strikethrough, an offer price, a coupon, a free-delivery threshold, a membership tier, a handling fee, a surge fee at peak hours. The listed price on Blinkit is frequently not what the customer pays, in either direction.
  • Fees are part of the price. A Blinkit basket at ₹480 with a ₹35 delivery fee and a ₹9 handling fee is a ₹524 basket. Comparing ₹480 to DMart's ₹455 understates the real gap by more than half. Any comparison that ignores fees is not a price comparison; it is a marketing chart.

A serious Weekly DMart & Blinkit Product Pricing analysis has to solve all five of these before it produces a single number.

What to Collect

Data Group Fields Why It Matters
Product identity Platform SKU/product ID, product name, brand, pack size, unit, variant The join key for everything
Matching GTIN/EAN where available, normalized brand, normalized pack size, matched product key, match confidence Legitimacy of the comparison
Category Platform category path, normalized category (Staples, Dairy, Snacks, Beverages, Personal Care, Home Care, Fruits & Veg) Category-level gap analysis
Price MRP, listed price, strikethrough, discount %, price per unit (per kg / L / 100g / piece) The actual comparison currency
Effective price Coupons, cart-level offers, membership price, delivery fee, handling fee, surge/peak fee What the customer actually pays
Availability In stock / out of stock, low-stock signal (Blinkit), store/pincode Is this price even buyable?
Location Pincode, city, dark store cluster (Blinkit); store/region (DMart) Hyperlocal variance
Promotions Bank offers, BOGO, combo packs, weekly deal flags, festival campaigns Weekly deal comparison
Time Capture timestamp, week number, day of week, time of day The weekly time series

Two fields carry more weight than everything else.

Price per unit is the comparison currency. Not price. Price divided by pack size, in a normalized unit. This single normalization is what makes a DMart 5kg atta bag comparable to a Blinkit 1kg pack. Skip it and every chart you produce will flatter whichever platform happens to sell bigger packs.

Effective price is what the customer pays. Listed price plus fees, minus coupons and cart-level offers, at a realistic basket size. DMart Product Pricing Data Scraping and Blinkit collection both need to capture the full ladder — not just the headline number.

The Matching Layer

You cannot compare what you have not matched. To Extract Blinkit SKU ID Data and map it correctly to the DMart equivalent, a cascade is needed:

  • Tier 1 — Identifier match. GTIN/EAN where exposed. Exact, high confidence. Covers packaged branded goods reasonably well.
  • Tier 2 — Brand + pack normalization. "Tata Sampann Toor Dal 1kg" and "Tata Sampann Unpolished Toor Dal (1 kg)" are the same product written by two different merchandising teams. Brand strings, pack sizes, unit notation and descriptive suffixes all need normalization before they will join.
  • Tier 3 — Attribute + image similarity. For private label (DMart Premia versus Blinkit's own brands), for loose produce, and for anything where the text is unhelpful.
  • Tier 4 — Equivalence class, not exact match. This is the important one, and it is where most naive comparisons fail. Sometimes the correct comparison is not SKU-to-SKU but unit-to-unit within an equivalence class — DMart's 5kg atta versus Blinkit's 1kg atta of the same brand, compared on price per kg, with the pack-size difference flagged explicitly. A bulk pack is genuinely cheaper per kg. That is a real finding, not a matching error, and it should be reported as such rather than hidden.
  • Tier 5 — Human review queue for anything below the confidence threshold.

Every matched pair carries a confidence score, and that score travels with every number derived from it. A comparison built on 0.7-confidence matches is not a comparison; it is a rumour.

Sample Data: What a Clean Record Looks Like

A single matched, normalized weekly comparison record:

{
  "capture_ts": "2026-07-13T09:30:00+05:30",
  "week": "2026-W29",
  "matched_product_key": "STP-ATTA-AASHIRVAAD-WHOLEWHEAT",
  "product_name": "Aashirvaad Shudh Chakki Atta",
  "brand": "Aashirvaad",
  "category_normalized": "Staples > Atta & Flour",
  "match_method": "gtin+pack_normalization",
  "match_confidence": 0.98,
  "location": {
    "city": "Mumbai",
    "pincode": "400076",
    "blinkit_dark_store_cluster": "Powai-01"
  },
  "dmart": {
    "sku_id": "DM-114902",
    "pack_size": "10 kg",
    "mrp": 545.00,
    "listed_price": 449.00,
    "price_per_kg": 44.90,
    "in_stock": true,
    "offer": "Bulk pack"
  },
  "blinkit": {
    "sku_id": "BLK-8827341",
    "pack_size": "5 kg",
    "mrp": 305.00,
    "listed_price": 274.00,
    "price_per_kg": 54.80,
    "in_stock": true,
    "low_stock_flag": false,
    "coupon": null,
    "delivery_fee": 25.00,
    "handling_fee": 9.00,
    "surge_fee": 0.00,
    "effective_price_per_kg_at_basket_600": 56.20
  },
  "derived": {
    "gap_per_kg_inr": 9.90,
    "gap_pct_listed": 22.0,
    "gap_pct_effective": 25.2,
    "cheaper_platform": "DMart",
    "pack_size_mismatch": true,
    "equivalence_note": "DMart 10kg vs Blinkit 5kg; compared on price/kg"
  }
}

Three things in that record are doing real work.

price_per_kg on both sides — without it, ₹449 versus ₹274 would suggest Blinkit is cheaper, which is exactly backwards.

effective_price_per_kg_at_basket_600 — the fee-loaded number, computed at a realistic basket value. The listed gap is 22%. The gap the customer actually pays is 25.2%. That 3.2-point difference is the convenience fee, made explicit.

equivalence_note — the honest disclosure that a pack-size difference exists. Hiding it would inflate DMart's advantage; omitting the comparison entirely would hide a real consumer choice. Flagging it is the only defensible option.

The Weekly Category View

Aggregate the matched records and you get the cut that people actually want — a DMart & Blinkit Category-wise Price Data Extraction rollup, refreshed every week:

Category SKUs Matched DMart Median (₹/unit) Blinkit Median (₹/unit) Listed Gap Effective Gap Blinkit Deal Depth WoW Change
Staples (Atta, Rice, Dal) 218 44.90 54.80 +22.0% +25.2% 8.1% +0.6 pts
Edible Oils 96 128.00 149.00 +16.4% +19.8% 11.4% −1.2 pts
Dairy 74 62.00 66.00 +6.5% +9.7% 4.2% +0.1 pts
Packaged Snacks 341 21.50 24.00 +11.6% +14.9% 14.8% −2.4 pts
Beverages 187 38.00 43.50 +14.5% +17.6% 12.0% +0.3 pts
Personal Care 264 96.00 104.00 +8.3% +11.5% 18.6% −3.1 pts
Home Care 149 71.00 82.00 +15.5% +18.9% 9.7% +0.4 pts
Fruits & Vegetables 58 44.00 61.00 +38.6% +42.3% 3.1% +1.8 pts
Blended 1,387 +15.9% +19.4% 10.2% −0.4 pts

Read that table properly and it stops being a price list and becomes a strategy document.

The convenience premium is not one number — it is a curve. Dairy sits at under 10% effective. Fruits and vegetables sit above 40%. That is not random. Dairy is a high-frequency, price-transparent, habit-driven category where a visible gap would cost Blinkit the basket. Fresh produce is where Blinkit's cost-to-serve is highest and consumer price memory is weakest. The gap tells you exactly where each platform believes it can charge.

The effective gap is always wider than the listed gap. Consistently 3 to 4 points, across every category. That is the fee load, and it is invisible to anyone benchmarking on listed price. It is also the single most under-reported number in Indian grocery comparisons.

Deal depth is where Blinkit fights. Personal Care shows 18.6% deal depth and a −3.1 point week-on-week move. Blinkit is discounting hard in a high-margin category to close the gap. That is a competitive posture, visible only in the time series, and it is the kind of thing a brand's trade marketing team needs to know this week, not next quarter.

Week-on-week movement is the actual signal. A static gap tells you the state of the market. The WoW column tells you where it is going.

Why Weekly Is the Right Cadence

Daily collection produces noise. Blinkit reprices frequently, surge fees come and go, dark store stock shifts hour to hour. A daily chart of the DMart–Blinkit gap looks like static.

Monthly collection misses everything. Promotional cycles, festival pushes and competitive responses all play out inside a month.

Weekly is the resolution at which the pattern becomes legible — and it aligns naturally with how retail actually operates: weekly promotional cycles, weekly category reviews, weekly trade meetings. The Weekly DMart & Blinkit price comparison is a weekly artefact because that is the rhythm of the decisions it feeds.

The collection underneath, though, should be daily or better. You aggregate to weekly for reporting; you collect at higher frequency so the weekly number is a genuine average rather than a single Tuesday-morning snapshot that happened to catch a flash sale.

This is the model behind a Real-Time DMart vs Blinkit Pricing dashboard: continuous collection, weekly reporting, real-time alerting on the exceptions that cannot wait for the weekly cycle — a competitor's sudden category-wide price cut, a stockout cascade, a festival campaign going live.

The underlying pipelines for this sit inside the dedicated DMart grocery & supermarket data extraction practice at Actowiz Solutions and Blinkit Data Scraping Services, feeding continuous Real-Time Price Monitoring and the broader Data Intelligence Services layer that turns the feed into decisions.

Weekly Deals & Discounts: The Second Half of the Story

Headline price is only half the picture. A DMart & Blinkit Weekly Deals & Discount comparison captures the other half.

The two platforms discount in structurally different ways, and the difference is worth understanding:

DMart discounts through the shelf price, bulk packs and combo offers. The discount is embedded, persistent and rarely dramatic. Their "deal" is that the everyday price is low. Weekly variation is modest, which is itself a finding — a stable DMart price is a reliable benchmark line to measure everyone else against.

Blinkit discounts through a stack: strikethrough offers, percentage-off deals, bank card offers, free-delivery thresholds, cart-level "spend ₹X get ₹Y off", membership pricing, and time-boxed flash campaigns. Deal depth swings sharply week to week and category to category.

Tracked weekly, that produces a promotional intensity index by category — a simple, comparable measure of how hard each platform is discounting right now. And when Blinkit's index spikes in a category, one of two things is true: they are defending share against a competitor, or they are pushing a brand-funded campaign. Either way, a brand selling in that category should know within days, not at the end of the quarter.

Sample weekly deal comparison:

SKU (matched) DMart Price/unit DMart Offer Blinkit Price/unit Blinkit Offer Effective Gap
Tata Salt 1kg ₹24.00 ₹28.00 10% off +20.4%
Fortune Sunflower Oil 1L ₹132.00 ₹5 off combo of 2 ₹149.00 Bank offer 10% (min ₹499) +16.2%
Amul Butter 500g ₹272.00 ₹280.00 +6.4%
Colgate Strong Teeth 300g ₹165.00 Combo pack ₹172.00 BOGO on 2nd unit −2.1%
Lay's Classic 52g ₹20.00 ₹22.00 Buy 3 @ ₹60 +4.8%

Note the Colgate row: on a BOGO week, Blinkit is cheaper per unit than DMart. That inversion is temporary, category-specific, and completely invisible to anyone comparing listed prices without the promotional layer. It is also exactly the sort of finding a brand's channel team needs before their next trade negotiation.

Who Uses This, and Why

FMCG brands monitor their own price realisation across both channels, detect unauthorised discounting, measure whether trade spend on Blinkit is actually converting to shelf price, and see where their brand is losing to private label on the price-per-unit metric that consumers implicitly use.

Retailers and quick-commerce operators benchmark their own positioning against both models, and identify categories where they are needlessly expensive or needlessly cheap.

Investors and analysts track the convenience premium as a leading indicator. A narrowing gap suggests quick commerce is buying growth with margin. A widening one suggests pricing power. Neither is visible in quarterly disclosures.

Category managers and buyers use category-level gap data to negotiate, plan promotions and time launches.

Consumer researchers and media get an evidence base instead of anecdote — the answer to "is quick commerce actually expensive?" turns out to be "between 6% and 42%, depending entirely on what you are buying."

Compliance and Method

  • Publicly displayed information only — the same prices, offers and availability any shopper sees in the app or on the site.
  • No personal data. Prices are not people; nothing collected identifies a customer.
  • Respectful, rate-limited collection that never degrades either platform's service.
  • Methodology published with the numbers. Sample size, pincode, capture window, match confidence and fee assumptions travel with every comparison. A gap percentage without its methodology is a headline, not a finding.
  • Benchmarking, not misrepresentation. The data informs pricing and strategy; it is never presented as inventory anyone holds.

KPIs for the Program

Metric Healthy Target
Matched SKU pairs 1,200+ for a credible category-level read
Match precision (audited) 95%+, with confidence exposed
Price-per-unit normalization coverage 99%
Fee/effective-price capture rate 95%+
Pincode coverage (Blinkit) Minimum 3 clusters per city; more for hyperlocal claims
Collection freshness Daily collection, weekly reporting
Category coverage All 8 major grocery categories
Deal capture rate 90%+ of visible offers, coupons and thresholds

FAQs

Is Blinkit really more expensive than DMart?

On the data, yes — but the honest answer is "by a margin that varies enormously by category." Blended, the effective gap sits in the mid-to-high teens. In dairy it is single digits; in fresh produce it can exceed 40%. Anyone quoting a single number for the whole basket is oversimplifying, and probably selling something.

Why compare on price per unit rather than price?

Because pack sizes differ systematically between the two platforms. DMart's model favours bulk; Blinkit's favours convenience packs. Comparing ₹449 for 10kg against ₹274 for 5kg on absolute price produces the exact opposite of the truth. Price per kg is the only honest currency.

Do delivery and handling fees really matter that much?

They consistently add 3 to 4 percentage points to the gap. On a typical basket, that is the difference between "slightly more expensive" and "meaningfully more expensive." Any comparison that omits them is understating the convenience premium by roughly a quarter.

How many SKUs do you need for a credible comparison?

For category-level claims, 1,200+ matched pairs across the major categories, with audited match precision above 95%. Below that, single outlier SKUs start moving the medians and the conclusions become fragile.

Why does Blinkit pricing vary by pincode?

Because Blinkit operates from dark stores, each of which has its own assortment, stock position and — in practice — its own pricing and fee behaviour. There is no single national Blinkit price. Any credible comparison fixes the location or explicitly reports the variance across locations.

Is this kind of data collection permissible?

Collecting publicly displayed prices, offers and availability for benchmarking and market analysis is a well-established practice across retail. The requirements are: public data only, no personal data, non-disruptive and rate-limited collection, and use for benchmarking rather than misrepresentation. Build strictly inside those lines.

Conclusion

The DMart versus Blinkit question is usually argued with anecdotes. Someone checked six items and concluded quick commerce is a ripoff. Someone else checked six different items during a BOGO week and concluded it is basically the same. Both are describing a real observation and neither is describing the market.

A Weekly DMart & Blinkit price comparison — built on properly matched SKUs, normalized to price per unit, loaded with the real fees, cut by category, fixed to a pincode, and tracked week over week — replaces that argument with a measurement. And the measurement is more interesting than either side of the argument: the convenience premium is real, it is large, it is wildly uneven across categories, and it is moving every single week in response to competitive pressure that only shows up in the time series.

For a brand, that movement is a trade-marketing signal. For an investor, it is a margin signal. For a category manager, it is next week's negotiation. For a consumer, it is the answer to a question they have been guessing at.

Actowiz Solutions builds and runs these comparison programs end to end — matched SKU pairs, daily collection, weekly reporting, pincode-level granularity, delivered as a dashboard or a feed.

You can also reach us for all your mobile app scraping, data collection, web scraping , and instant data scraper service requirements!

Social Proof That Converts

Trusted by Global Leaders Across Q-Commerce, Travel, Retail, and FoodTech

Our web scraping expertise is relied on by 4,000+ global enterprises including Zomato, Tata Consumer, Subway, and Expedia — helping them turn web data into growth.

4,000+ Enterprises Worldwide
50+ Countries Served
20+ Industries
Join 4,000+ companies growing with Actowiz →
Real Results from Real Clients

Hear It Directly from Our Clients

Watch how businesses like yours are using Actowiz data to drive growth.

1 min
★★★★★
"Actowiz Solutions offered exceptional support with transparency and guidance throughout. Anna and Saga made the process easy for a non-technical user like me. Great service, fair pricing!"
TG
Thomas Galido
Co-Founder / Head of Product at Upright Data Inc.
2 min
★★★★★
"Actowiz delivered impeccable results for our company. Their team ensured data accuracy and on-time delivery. The competitive intelligence completely transformed our pricing strategy."
II
Iulen Ibanez
CEO / Datacy.es
1:30
★★★★★
"What impressed me most was the speed — we went from requirement to production data in under 48 hours. The API integration was seamless and the support team is always responsive."
FC
Febbin Chacko
-Fin, Small Business Owner
icons 4.8/5 Average Rating
icons 50+ Video Testimonials
icons 92% Client Retention
icons 50+ Countries Served

Join 4,000+ Companies Growing with Actowiz

From Zomato to Expedia — see why global leaders trust us with their data.

Why Global Leaders Trust Actowiz

Backed by automation, data volume, and enterprise-grade scale — we help businesses from startups to Fortune 500s extract competitive insights across the USA, UK, UAE, and beyond.

icons
7+
Years of Experience
Proven track record delivering enterprise-grade web scraping and data intelligence solutions.
icons
4,000+
Projects Delivered
Serving startups to Fortune 500 companies across 50+ countries worldwide.
icons
200+
In-House Experts
Dedicated engineers across scrapers, AI/ML models, APIs, and data quality assurance.
icons
9.2M
Automated Workflows
Running weekly across eCommerce, Quick Commerce, Travel, Real Estate, and Food industries.
icons
270+ TB
Data Transferred
Real-time and batch data scraping at massive scale, across industries globally.
icons
380M+
Pages Crawled Weekly
Scaled infrastructure for comprehensive global data coverage with 99% accuracy.

AI Solutions Engineered
for Your Needs

LLM-Powered Attribute Extraction: High-precision product matching using large language models for accurate data classification.
Advanced Computer Vision: Fine-grained object detection for precise product classification using text and image embeddings.
GPT-Based Analytics Layer: Natural language query-based reporting and visualization for business intelligence.
Human-in-the-Loop AI: Continuous feedback loop to improve AI model accuracy over time.
icons Product Matching icons Attribute Tagging icons Content Optimization icons Sentiment Analysis icons Prompt-Based Reporting

Connect the Dots Across
Your Retail Ecosystem

We partner with agencies, system integrators, and technology platforms to deliver end-to-end solutions across the retail and digital shelf ecosystem.

icons
Analytics Services
icons
Ad Tech
icons
Price Optimization
icons
Business Consulting
icons
System Integration
icons
Market Research
Become a Partner →

Popular Datasets — Ready to Download

Browse All Datasets →
icons
Amazon
eCommerce
Free 100 rows
icons
Zillow
Real Estate
Free 100 rows
icons
DoorDash
Food Delivery
Free 100 rows
icons
Walmart
Retail
Free 100 rows
icons
Booking.com
Travel
Free 100 rows
icons
Indeed
Jobs
Free 100 rows

Latest Insights & Resources

View All Resources →
thumb
Blog

Building RAG-Ready Data Pipelines from Scraped Web Content: A Python + Vector DB Tutorial (2026)

Step-by-step tutorial by Actowiz Solutions: turn scraped web content into RAG-ready pipelines cleaning, chunking, embeddings & vector DB ingestion with Python code.

thumb
Case Study

How a Pre-Seed Grocery-Savings App Built Basket Comparison Across 50+ US Chains Without Blowing Its Data Budget.

How a US grocery-savings startup built a real-time basket-comparison engine across 50+ chains and 28,000+ stores with a freshness SLA, self-healing feeds and a staged plan that fit a pre-seed budget.

thumb
Report

Extract Superdrug Products Data for Competitive Pricing, Product Assortment, and Category Insights

Extract Superdrug Products Data to analyze pricing, product trends, promotions, and inventory for smarter retail market intelligence.

Start Where It Makes Sense for You

Whether you're a startup or a Fortune 500 — we have the right plan for your data needs.

icons
Enterprise
Book a Strategy Call
Custom solutions, dedicated support, volume pricing for large-scale needs.
icons
Growing Brand
Get Free Sample Data
Try before you buy — 500 rows of real data, delivered in 2 hours. No strings.
icons
Just Exploring
View Plans & Pricing
Transparent plans from $500/mo. Find the right fit for your budget and scale.
Get in Touch
Let's Talk About
Your Data Needs
Tell us what data you need — we'll scope it for free and share a sample within hours.
  • icons
    Free Sample in 2 HoursShare your requirement, get 500 rows of real data — no commitment.
  • icons
    Plans from $500/monthFlexible pricing for startups, growing brands, and enterprises.
  • icons
    US-Based SupportOffices in New York & California. Aligned with your timezone.
  • icons
    ISO 9001 & 27001 CertifiedEnterprise-grade security and quality standards.
Request Free Sample Data
Fill the form below — our team will reach out within 2 hours.
+1
Free 500-row sample · No credit card · Response within 2 hours

Request Free Sample Data

Our team will reach out within 2 hours with 500 rows of real data — no credit card required.

+1
Free 500-row sample · No credit card · Response within 2 hours