Core services
Enterprise Data Extraction

Scalable web, app and AI-powered collection across 40+ countries.

All 58 services →
New 2026
AI Training Data

Corpus building with provenance and opt-out compliance.

Learn more →
Free pilot
24-hour sample

We run collection on your own sources before you commit.

Get a sample →
58Services
40+Countries
DEVELOPER

Ready-Made Scrapers

Pre-built for top platforms. Self-serve, no setup.

View All →
TRY FREE

API Playground

Test endpoints instantly. No credit card.

Start Free →
28Tools
2SDKs
icons Delivery & SDKs
Streaming Crawl API Scheduler Realtime Alerts Webhook Delivery 🐍 Python SDK 💚 Node.js SDK

Need it managed instead?

Fixed monthly retainer, named engineer, no per-request metering.

Managed Data API →
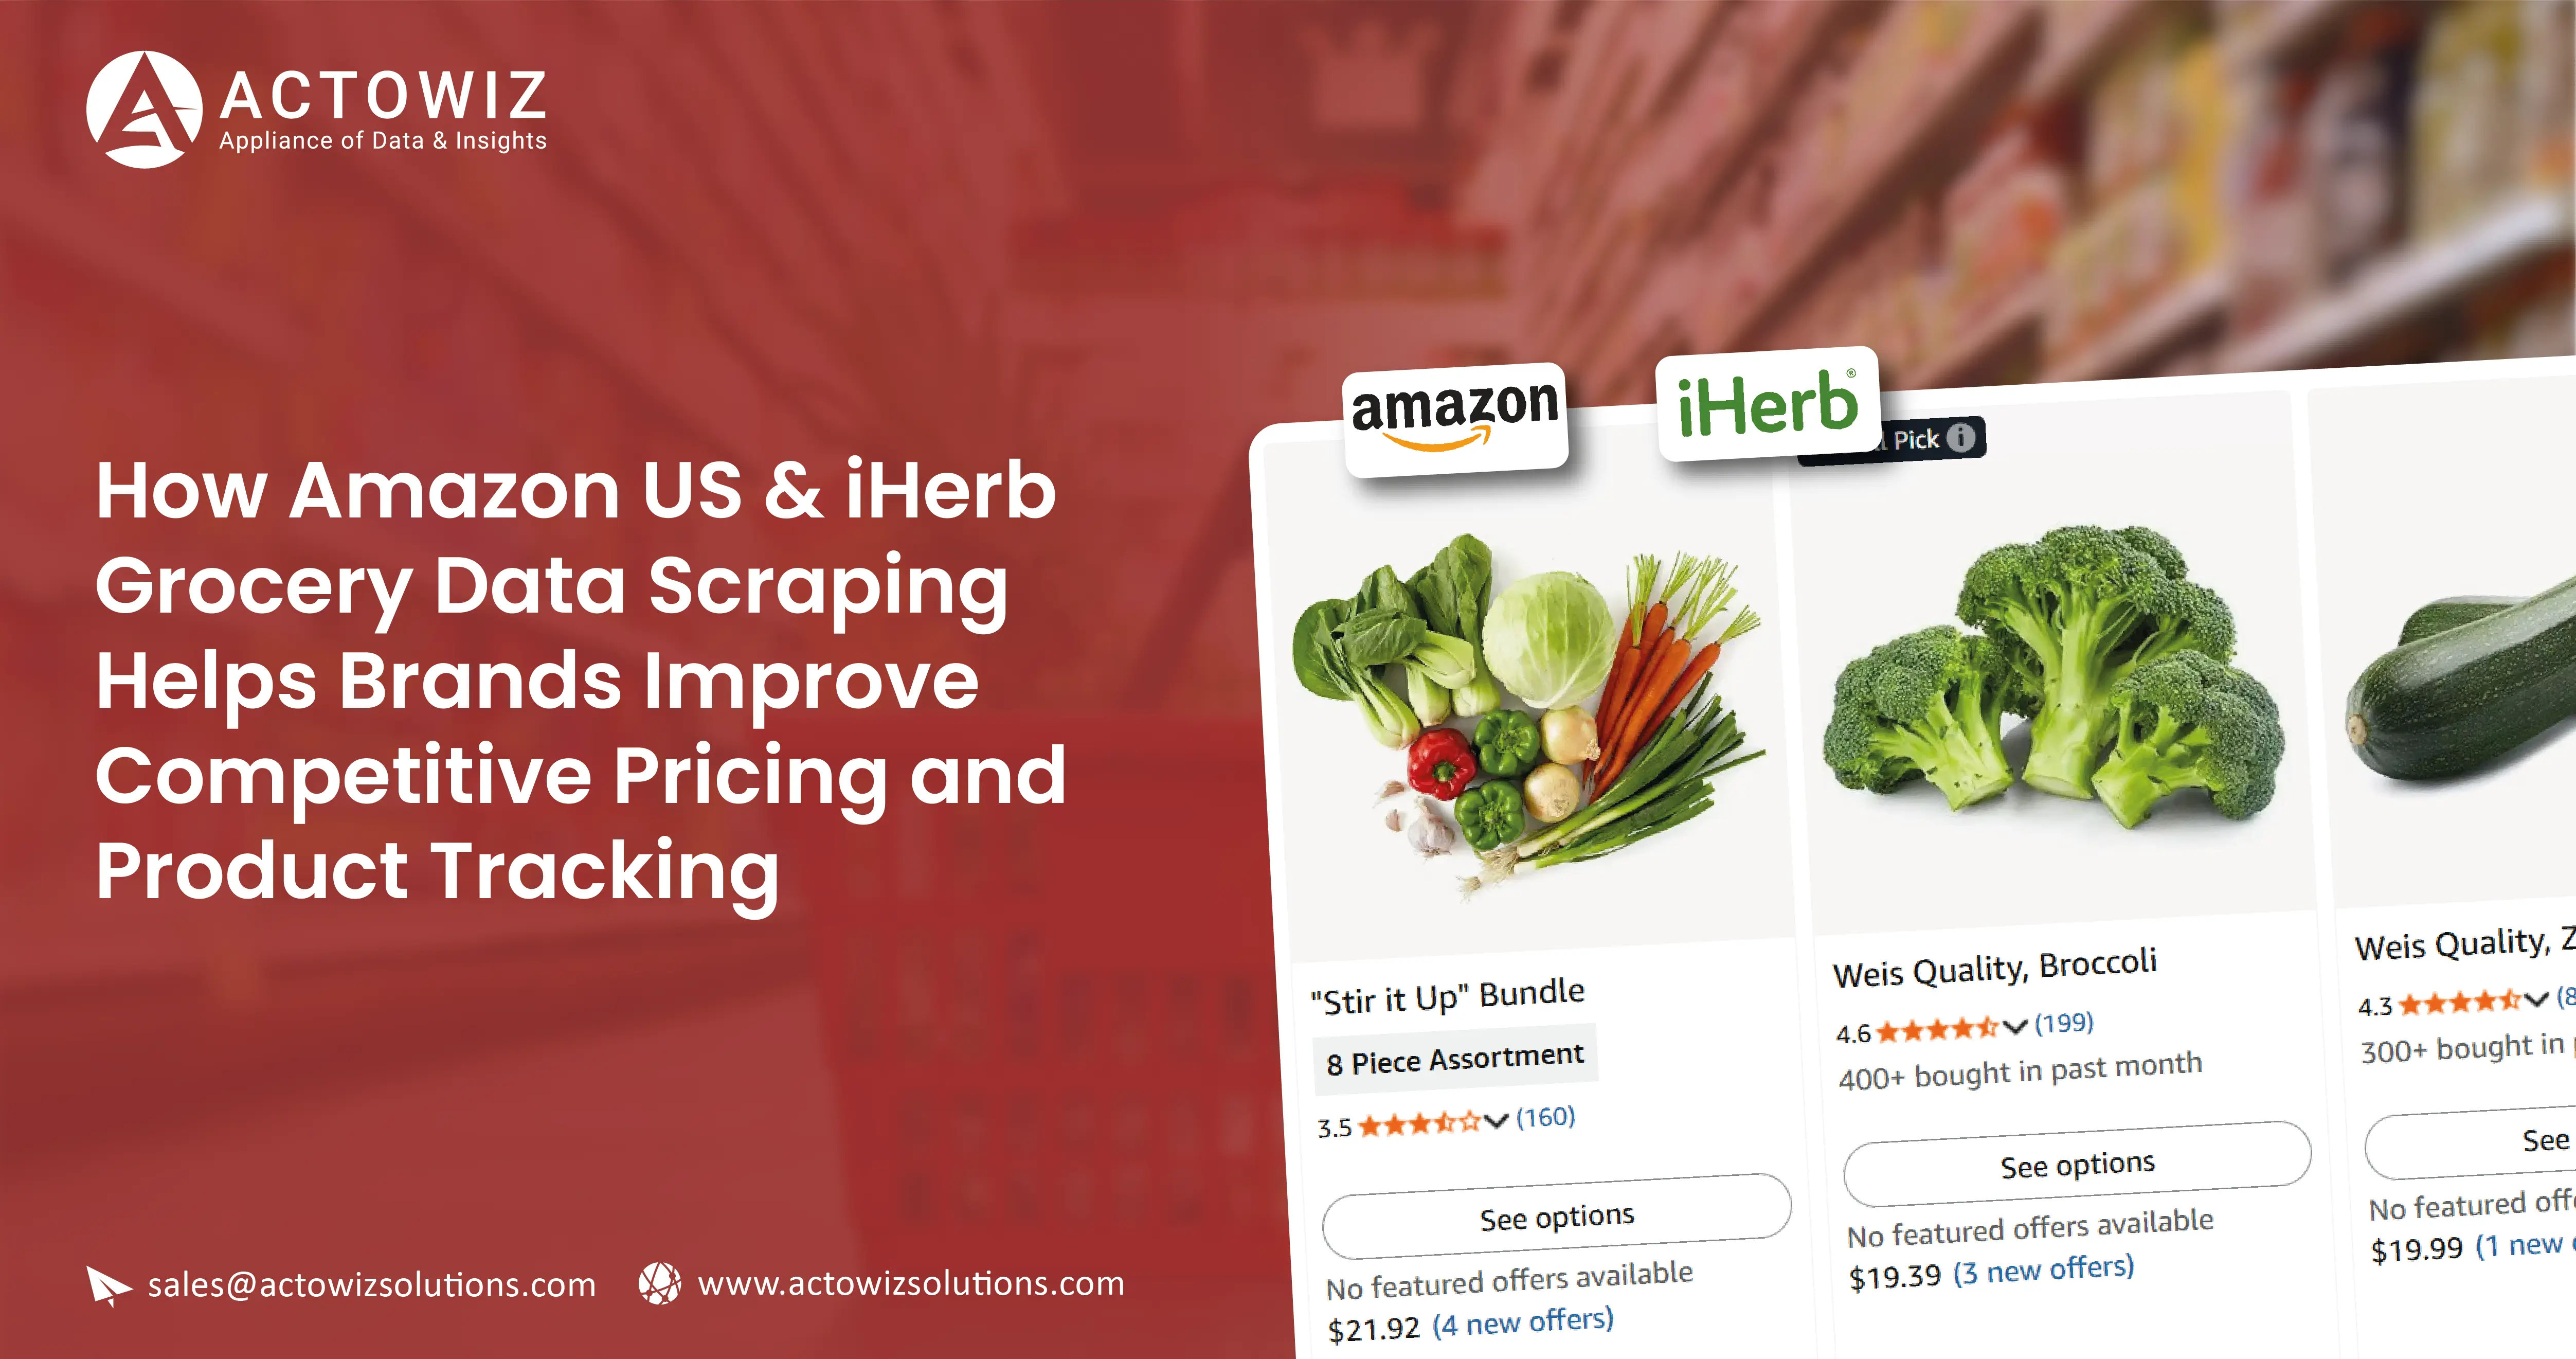
How Amazon US & iHerb Grocery Data Scraping Helps Brands Improve Competitive Pricing and Product Tracking

Introduction

Amazon US & iHerb Grocery Data Scraping helps grocery brands, retailers, distributors, and market research teams monitor product prices, SKUs, promotions, availability, and competitor movements so they can make faster pricing and assortment decisions.

Online grocery competition changes continuously. Product prices fluctuate, promotional offers appear and disappear, new SKUs enter categories, and inventory availability can vary by marketplace or location. For businesses managing hundreds or thousands of grocery products, manually tracking these changes is difficult and often produces incomplete market intelligence.

A structured data strategy can solve this problem by converting marketplace information into standardized datasets. Teams can compare product prices, identify price gaps, monitor competitor assortment, detect product launches, and evaluate promotional strategies across marketplaces.

This is particularly useful when businesses need to answer questions such as: Which products have experienced the largest price changes? Where are competitors offering deeper discounts? Which grocery categories are expanding? Which SKUs are unavailable? How does a brand's price position compare with similar products?

For teams looking to Extract Amazon Product Prices with Web Scraping, automated data collection can provide historical observations that make pricing movements easier to analyze. The objective is not simply to collect more data. It is to collect consistent, relevant data that supports commercial decisions.

How Can Product-Level Data Improve Grocery Market Intelligence?

How Can Product-Level Data Improve Grocery Market Intelligence

Amazon US Grocery Product Data Extraction can help businesses create a structured view of grocery products across categories, brands, pack sizes, prices, ratings, reviews, availability, and other publicly visible attributes.

For grocery brands, product-level information is valuable because marketplace competition often occurs at the SKU level. A brand may have several similar products competing at different price points, while competitors can introduce new pack sizes or promotional bundles.

A product dataset allows analysts to standardize these attributes and compare products more effectively. For example, a business can compare the listed price of a 12-pack beverage against similar pack sizes rather than simply comparing headline prices.

Product extraction can also support assortment research. Businesses can identify which categories contain the highest number of competing SKUs, which brands have expanded their product ranges, and where product availability changes frequently.

Illustrative product extraction dataset
Year Products Monitored Categories Brands Tracked SKU Changes Detected
2020 75,000 420 8,500 18,000
2021 92,000 470 10,200 22,500
2022 115,000 530 12,100 29,000
2023 145,000 590 14,500 36,500
2024 180,000 650 17,200 45,000
2025 225,000 720 20,100 56,000
2026 280,000 800 23,500 70,000

These figures are hypothetical.

The commercial value comes from turning product records into comparable benchmarks. Category managers can identify assortment gaps, pricing teams can establish competitive benchmarks, and product teams can monitor new entrants.

For example, if a competitor adds multiple products to a rapidly growing category, a brand can investigate whether its own assortment adequately covers the segment.

This approach gives businesses a more detailed view of marketplace competition than relying on periodic manual research.

How Can Businesses Combine Data From Two Major Grocery Platforms?

Scraping iHerb Grocery Data alongside Amazon US & iHerb Grocery Data Scraping can help businesses build a broader competitive dataset covering different marketplace environments.

The value of combining marketplaces is that product positioning may differ from one platform to another. A brand might offer a different price, pack size, promotion, or assortment depending on the marketplace. Monitoring only one platform can therefore create an incomplete view of competitive positioning.

Businesses can create a unified product schema containing fields such as product name, brand, category, SKU, price, promotional price, package size, rating, review count, availability, and product URL. Standardizing these fields makes cross-platform comparison more practical.

Illustrative cross-platform monitoring
Year Amazon SKUs iHerb SKUs Shared Categories Cross-Platform Matches
2020 75,000 28,000 180 15,000
2021 92,000 34,000 205 19,000
2022 115,000 41,000 230 24,500
2023 145,000 50,000 260 31,000
2024 180,000 61,000 295 39,500
2025 225,000 74,000 330 49,000
2026 280,000 90,000 370 61,000

These are hypothetical values for illustration.

Cross-platform normalization creates opportunities for price benchmarking, assortment comparison, promotion monitoring, and brand positioning analysis.

A useful implementation should account for differences in product naming and package sizes. Matching products purely by title can create inaccurate comparisons. SKU-level identifiers, brand names, package quantities, product attributes, and normalized units can improve matching accuracy.

The result is a more reliable view of how products are positioned across different digital grocery environments.

How Can Brands Track Price Changes More Effectively?

iHerb Product Price Monitoring helps brands and retailers identify changes in product prices and promotions over time.

Price monitoring becomes increasingly important as online grocery competition intensifies. A competitor's price can change without warning, and temporary discounts can create the appearance of a permanent price shift if businesses only conduct occasional checks.

Historical monitoring solves this problem by recording prices at defined intervals. Businesses can then calculate price changes, promotional frequency, minimum and maximum prices, and average observed prices.

For example, a brand might discover that a competing supplement or grocery product is discounted every weekend but returns to its normal price during weekdays. That insight is more useful than simply knowing the product was discounted.

Illustrative price-monitoring framework
Year Products Monitored Price Observations Promotions Detected Significant Price Changes
2020 28,000 1.2M 95,000 120,000
2021 34,000 1.5M 120,000 155,000
2022 41,000 1.9M 155,000 195,000
2023 50,000 2.4M 195,000 245,000
2024 61,000 3.0M 250,000 310,000
2025 74,000 3.7M 315,000 390,000
2026 90,000 4.5M 400,000 480,000

The data above is hypothetical.

Effective price monitoring should distinguish between base price, sale price, coupon-based discounts, multi-unit offers, and other promotional mechanics where these are observable.

This allows pricing teams to calculate meaningful benchmarks instead of comparing inconsistent price types.

The resulting intelligence can support repricing decisions, promotion planning, competitor response strategies, and margin management.

How Can Cross-Marketplace Price Comparison Reveal Competitive Gaps?

Amazon and iHerb Grocery Price Comparison enables businesses to evaluate how the same or comparable products are positioned across two different online marketplaces.

A basic price comparison may seem straightforward, but accurate analysis requires normalization. Products can differ by size, flavor, quantity, formulation, bundle composition, or packaging. Businesses should therefore compare equivalent products wherever possible and normalize prices by unit, weight, volume, or count when appropriate.

For example, comparing a 500-gram product with a 250-gram product using only headline price could produce an incorrect conclusion. Unit-level price calculations provide a more useful benchmark.

Illustrative price comparison
Year Matched SKUs Avg. Amazon Price Avg. iHerb Price Average Price Gap
2020 15,000 $18.40 $17.90 2.7%
2021 19,000 $18.90 $18.30 3.2%
2022 24,500 $19.50 $18.80 3.6%
2023 31,000 $20.20 $19.40 4.0%
2024 39,500 $21.00 $20.10 4.3%
2025 49,000 $21.80 $20.70 5.0%
2026 61,000 $22.60 $21.40 5.3%

These figures are hypothetical examples.

A cross-marketplace comparison can reveal which products have consistent price gaps and which show relatively stable positioning. Businesses can then investigate whether differences are caused by promotions, marketplace fees, brand strategy, pack sizes, or other commercial factors.

The analysis becomes more valuable when combined with ratings and availability. A lower-priced product with poor availability may represent a different competitive situation from a consistently available lower-priced product.

How Can SKU-Level Monitoring Improve Assortment Decisions?

Amazon US & iHerb Grocery SKU Level Data Collection helps businesses move from broad category analysis to precise product-level intelligence.

SKU-level monitoring is particularly useful for brands managing large product portfolios. It can track individual products across price, availability, ratings, reviews, promotions, pack sizes, and category placement.

A historical SKU dataset can also identify products that are frequently added, removed, repriced, or promoted. These patterns may provide useful signals for category managers.

For example, if several competitors repeatedly launch smaller pack sizes within a particular category, brands can investigate whether consumers may be responding to lower entry prices. If competitors discontinue certain SKUs, the change may warrant further research into category economics or product lifecycle trends.

Illustrative SKU-level dataset
Year SKUs Monitored Availability Checks New SKUs Discontinued/Changed SKUs
2020 90,000 3.2M 12,000 7,500
2021 110,000 3.9M 15,000 9,000
2022 135,000 4.8M 18,500 11,000
2023 165,000 5.9M 22,000 13,500
2024 205,000 7.2M 27,000 16,000
2025 255,000 8.8M 33,000 19,500
2026 320,000 10.8M 41,000 24,000

These figures are hypothetical.

SKU-level data is most useful when it is connected to business rules. A company might flag a product when its price changes by more than a defined threshold, disappears from a marketplace, receives a major rating change, or is replaced by a new competitor product.


This turns product data into an operational intelligence system.

How Can Automated Grocery Data Collection Support Market Intelligence?

Grocery Data Scraping Services can help organizations collect large volumes of structured grocery marketplace information without depending entirely on manual research.

For businesses managing thousands of products, automation improves consistency and makes historical tracking more practical. A data collection workflow can be designed around specific marketplaces, categories, brands, geographic markets, and product attributes.

A useful system should capture the fields required for the business objective rather than collecting unnecessary information. For pricing intelligence, price and promotional fields may be the priority. For assortment intelligence, SKU, category, brand, and availability fields may be more important.

Illustrative data collection growth
Year Records Collected Marketplaces Categories Refresh Cycles
2020 2.5M 2 150 Monthly
2021 3.4M 2 180 Monthly
2022 4.8M 2 220 Biweekly
2023 6.5M 2 260 Weekly
2024 8.7M 2 300 Weekly
2025 11.5M 2 350 Multiple/week
2026 15.0M 2 400 Multiple/week

These are hypothetical examples demonstrating how a data program could evolve.

Automation also makes it easier to maintain historical snapshots. Historical data enables businesses to answer questions that a single current dataset cannot answer, such as when a competitor changed its price, how frequently promotions occur, or when a product disappeared.

The strongest implementations connect collection, validation, normalization, storage, analysis, and reporting into a single workflow.

How Can Actowiz Solutions Help?

Actowiz Solutions can help businesses develop customized marketplace data workflows for grocery pricing, assortment, competitive intelligence, and product monitoring.

A major use case is Real-Time Price Monitoring, combined with Amazon US & iHerb Grocery Data Scraping, to help businesses track marketplace price movements and identify significant changes. Depending on project requirements, monitoring can be organized around specific products, brands, categories, competitors, or marketplaces.

Actowiz Solutions can also support structured Web Scraping workflows for collecting publicly available marketplace information and transforming it into standardized datasets. Data fields can be designed around the client's analytical requirements, such as SKU, product name, brand, category, price, promotional price, rating, review count, availability, package size, and timestamp.

For businesses whose customers primarily interact with marketplaces through mobile applications, Mobile App Scraping can be incorporated into a broader data collection strategy where technically and legally appropriate. This can help organizations design data pipelines around app-based marketplace information rather than relying solely on desktop web views.

The output can be provided as a real-time dataset or according to a refresh frequency appropriate to the business requirement. Historical snapshots can also support trend analysis, price benchmarking, assortment monitoring, and competitor research.

The most important step is defining the business use case before designing the collection workflow. Actowiz Solutions can structure the solution around the products, categories, marketplaces, geographic markets, refresh frequency, and analytical fields that matter most to the client.

This approach ensures that data collection supports measurable business decisions instead of becoming an isolated technical exercise.

Conclusion

Amazon US & iHerb Grocery Data Scraping can give brands, retailers, distributors, and market researchers a structured way to monitor grocery prices, products, promotions, availability, and competitor assortment. When historical marketplace observations are standardized and analyzed consistently, businesses can identify pricing gaps, track SKU changes, compare marketplace positioning, and investigate emerging assortment opportunities.

The key is to move beyond simple data collection. Product information becomes commercially valuable when businesses connect it to decisions such as repricing, promotion planning, assortment expansion, competitor response, and product lifecycle management.

A well-designed workflow can combine Web Scraping, Mobile App Scraping, and a real-time dataset strategy where appropriate, enabling organizations to build a more comprehensive view of digital grocery markets. Historical snapshots further allow teams to understand not only what changed but also when and how frequently changes occurred.

For pricing teams, this can support faster competitive benchmarking. For category managers, it can reveal assortment gaps. For market researchers, it can provide structured evidence for category and competitor analysis.

Want to monitor grocery prices, SKUs, promotions, and competitor movements at scale? Contact Actowiz Solutions to build a customized marketplace data collection and analytics solution for your business!

You can also reach us for all your mobile app scraping, data collection, web scraping , and instant data scraper service requirements!

Social Proof That Converts

Trusted by Global Leaders Across Q-Commerce, Travel, Retail, and FoodTech

Our web scraping expertise is relied on by 4,000+ global enterprises including Zomato, Tata Consumer, Subway, and Expedia — helping them turn web data into growth.

4,000+ Enterprises Worldwide
50+ Countries Served
20+ Industries
Join 4,000+ companies growing with Actowiz →
Real Results from Real Clients

Hear It Directly from Our Clients

Watch how businesses like yours are using Actowiz data to drive growth.

1 min
★★★★★
"Actowiz Solutions offered exceptional support with transparency and guidance throughout. Anna and Saga made the process easy for a non-technical user like me. Great service, fair pricing!"
TG
Thomas Galido
Co-Founder / Head of Product at Upright Data Inc.
2 min
★★★★★
"Actowiz delivered impeccable results for our company. Their team ensured data accuracy and on-time delivery. The competitive intelligence completely transformed our pricing strategy."
II
Iulen Ibanez
CEO / Datacy.es
1:30
★★★★★
"What impressed me most was the speed — we went from requirement to production data in under 48 hours. The API integration was seamless and the support team is always responsive."
FC
Febbin Chacko
-Fin, Small Business Owner
icons 4.8/5 Average Rating
icons 50+ Video Testimonials
icons 92% Client Retention
icons 50+ Countries Served

Join 4,000+ Companies Growing with Actowiz

From Zomato to Expedia — see why global leaders trust us with their data.

Why Global Leaders Trust Actowiz

Backed by automation, data volume, and enterprise-grade scale — we help businesses from startups to Fortune 500s extract competitive insights across the USA, UK, UAE, and beyond.

icons
7+
Years of Experience
Proven track record delivering enterprise-grade web scraping and data intelligence solutions.
icons
4,000+
Projects Delivered
Serving startups to Fortune 500 companies across 50+ countries worldwide.
icons
200+
In-House Experts
Dedicated engineers across scrapers, AI/ML models, APIs, and data quality assurance.
icons
9.2M
Automated Workflows
Running weekly across eCommerce, Quick Commerce, Travel, Real Estate, and Food industries.
icons
270+ TB
Data Transferred
Real-time and batch data scraping at massive scale, across industries globally.
icons
380M+
Pages Crawled Weekly
Scaled infrastructure for comprehensive global data coverage with 99% accuracy.

AI Solutions Engineered
for Your Needs

LLM-Powered Attribute Extraction: High-precision product matching using large language models for accurate data classification.
Advanced Computer Vision: Fine-grained object detection for precise product classification using text and image embeddings.
GPT-Based Analytics Layer: Natural language query-based reporting and visualization for business intelligence.
Human-in-the-Loop AI: Continuous feedback loop to improve AI model accuracy over time.
icons Product Matching icons Attribute Tagging icons Content Optimization icons Sentiment Analysis icons Prompt-Based Reporting

Connect the Dots Across
Your Retail Ecosystem

We partner with agencies, system integrators, and technology platforms to deliver end-to-end solutions across the retail and digital shelf ecosystem.

icons
Analytics Services
icons
Ad Tech
icons
Price Optimization
icons
Business Consulting
icons
System Integration
icons
Market Research
Become a Partner →

Popular Datasets — Ready to Download

Browse All Datasets →
icons
Amazon
eCommerce
Free 100 rows
icons
Zillow
Real Estate
Free 100 rows
icons
DoorDash
Food Delivery
Free 100 rows
icons
Walmart
Retail
Free 100 rows
icons
Booking.com
Travel
Free 100 rows
icons
Indeed
Jobs
Free 100 rows

Latest Insights & Resources

View All Resources →
thumb
Blog

Wegman's Grocery Product Data Extraction - How Retailers Can Turn Grocery Data Into Better Market Decisions

Wegmans Grocery Product Data Extraction helps retailers track prices, products, availability, and assortment changes to improve grocery market intelligence and decisions.

thumb
Case Study

How We Empowered a Leading Food Brand Using Scrape Ready-to-Cook Cut Veg Product Data from Blinkit TN for Smarter Product & Pricing Decisions

Track Scrape Ready-to-Cook Cut Veg Product Data from Blinkit TN to monitor prices, availability, SKUs, and trends for smarter retail insights.

thumb
Report

Brazil Car Rental Pricing Intelligence Report 2026

Brazil Car Rental Pricing Intelligence Report 2026 reveals rental price trends, market shifts, competitor rates, and opportunities for smarter pricing.

Start Where It Makes Sense for You

Whether you're a startup or a Fortune 500 — we have the right plan for your data needs.

icons
Enterprise
Book a Strategy Call
Custom solutions, dedicated support, volume pricing for large-scale needs.
icons
Growing Brand
Get Free Sample Data
Try before you buy — 500 rows of real data, delivered in 2 hours. No strings.
icons
Just Exploring
View Plans & Pricing
Transparent plans from $500/mo. Find the right fit for your budget and scale.
Get in Touch
Let's Talk About
Your Data Needs
Tell us what data you need — we'll scope it for free and share a sample within hours.
  • icons
    Free Sample in 2 HoursShare your requirement, get 500 rows of real data — no commitment.
  • icons
    Plans from $500/monthFlexible pricing for startups, growing brands, and enterprises.
  • icons
    US-Based SupportOffices in New York & California. Aligned with your timezone.
  • icons
    ISO 9001 & 27001 CertifiedEnterprise-grade security and quality standards.
Request Free Sample Data
Fill the form below — our team will reach out within 2 hours.
+1
Free 500-row sample · No credit card · Response within 2 hours

Request Free Sample Data

Our team will reach out within 2 hours with 500 rows of real data — no credit card required.

+1
Free 500-row sample · No credit card · Response within 2 hours