Introduction
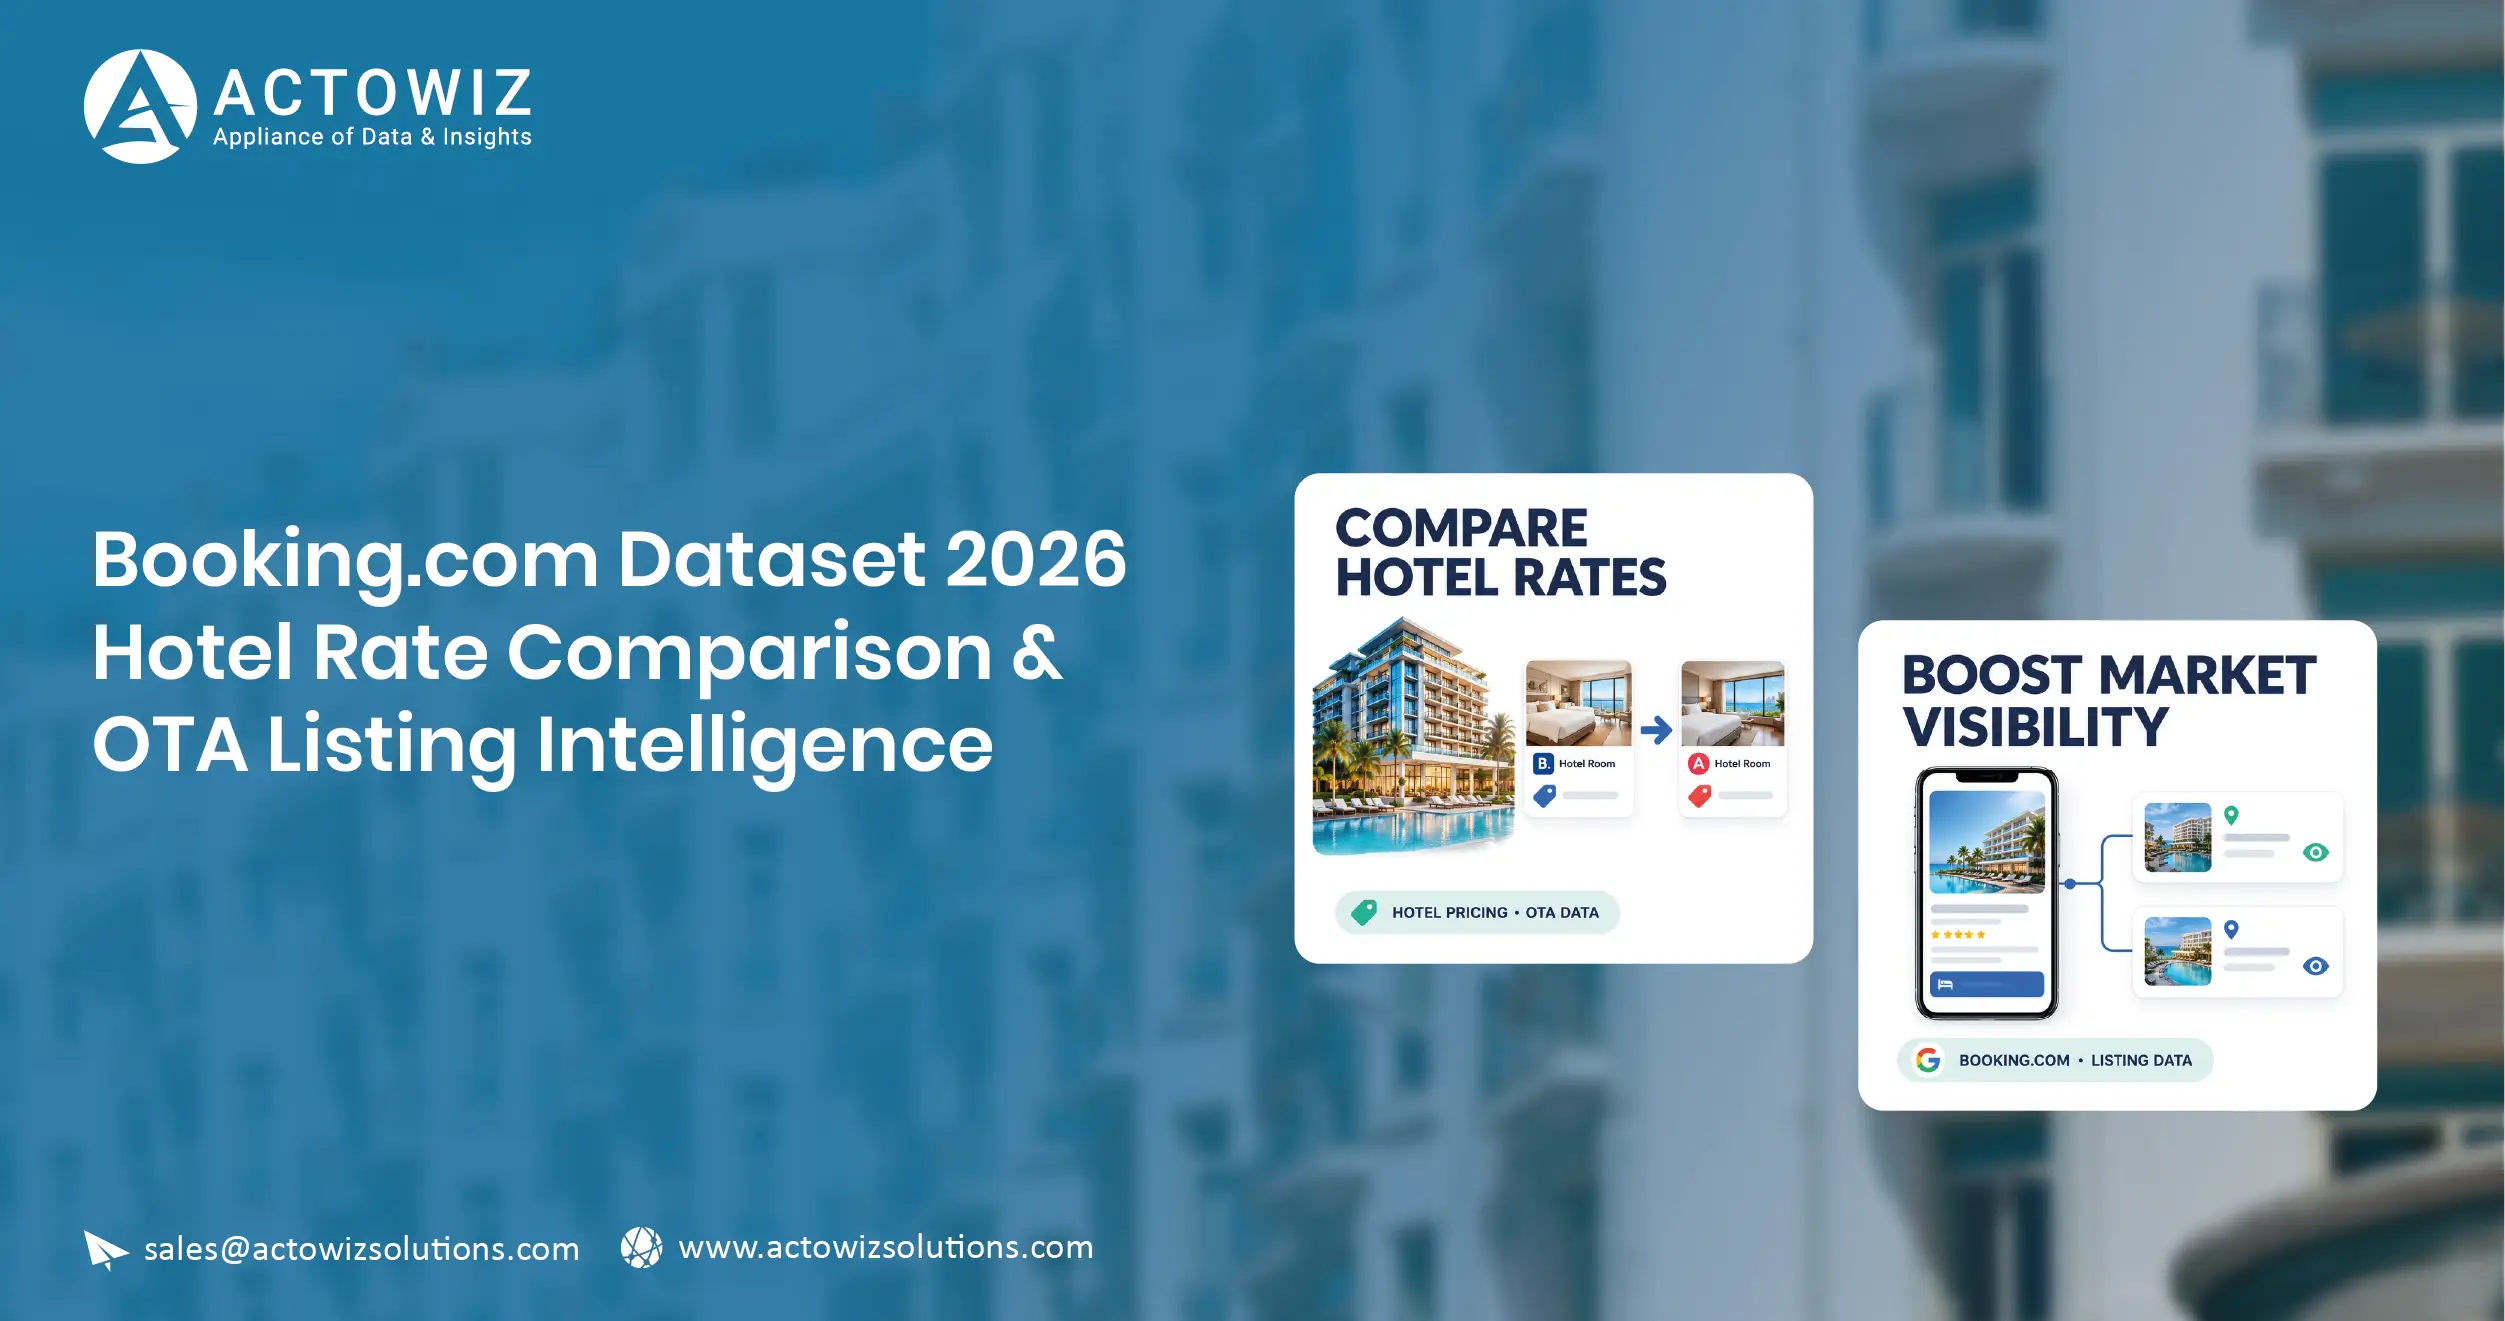
Travel businesses can improve hotel rate comparisons and market visibility by organizing accommodation listings, nightly prices, availability, ratings, amenities, and location details into a structured dataset. The Booking.com Dataset 2026 can help hotels, travel agencies, revenue managers, and hospitality analysts compare competitors, understand pricing differences, and identify market patterns using consistently collected and verified observations.
Hotel pricing changes with travel dates, room types, occupancy, cancellation policies, booking conditions, and local demand. A hotel that appears cheaper in a search result may offer a non-refundable room, while a competitor’s higher price may include breakfast or flexible cancellation. Comparing headline prices without these details can lead to inaccurate conclusions.
A structured Travel Dashboard can help teams compare similar accommodation offers, monitor rate movements, analyze customer feedback, and review market coverage in one place. The goal is to turn scattered listing information into actionable insights for pricing decisions, destination research, and competitive benchmarking.
The dataset should be treated as an analytical resource, not as a guarantee of future prices or room availability. Rates and inventory can change quickly, and every comparison should record the search date, stay dates, occupancy, room conditions, currency, and source. Businesses must also use permitted collection methods and respect applicable website terms and access restrictions.
What do real travel-industry statistics tell us?
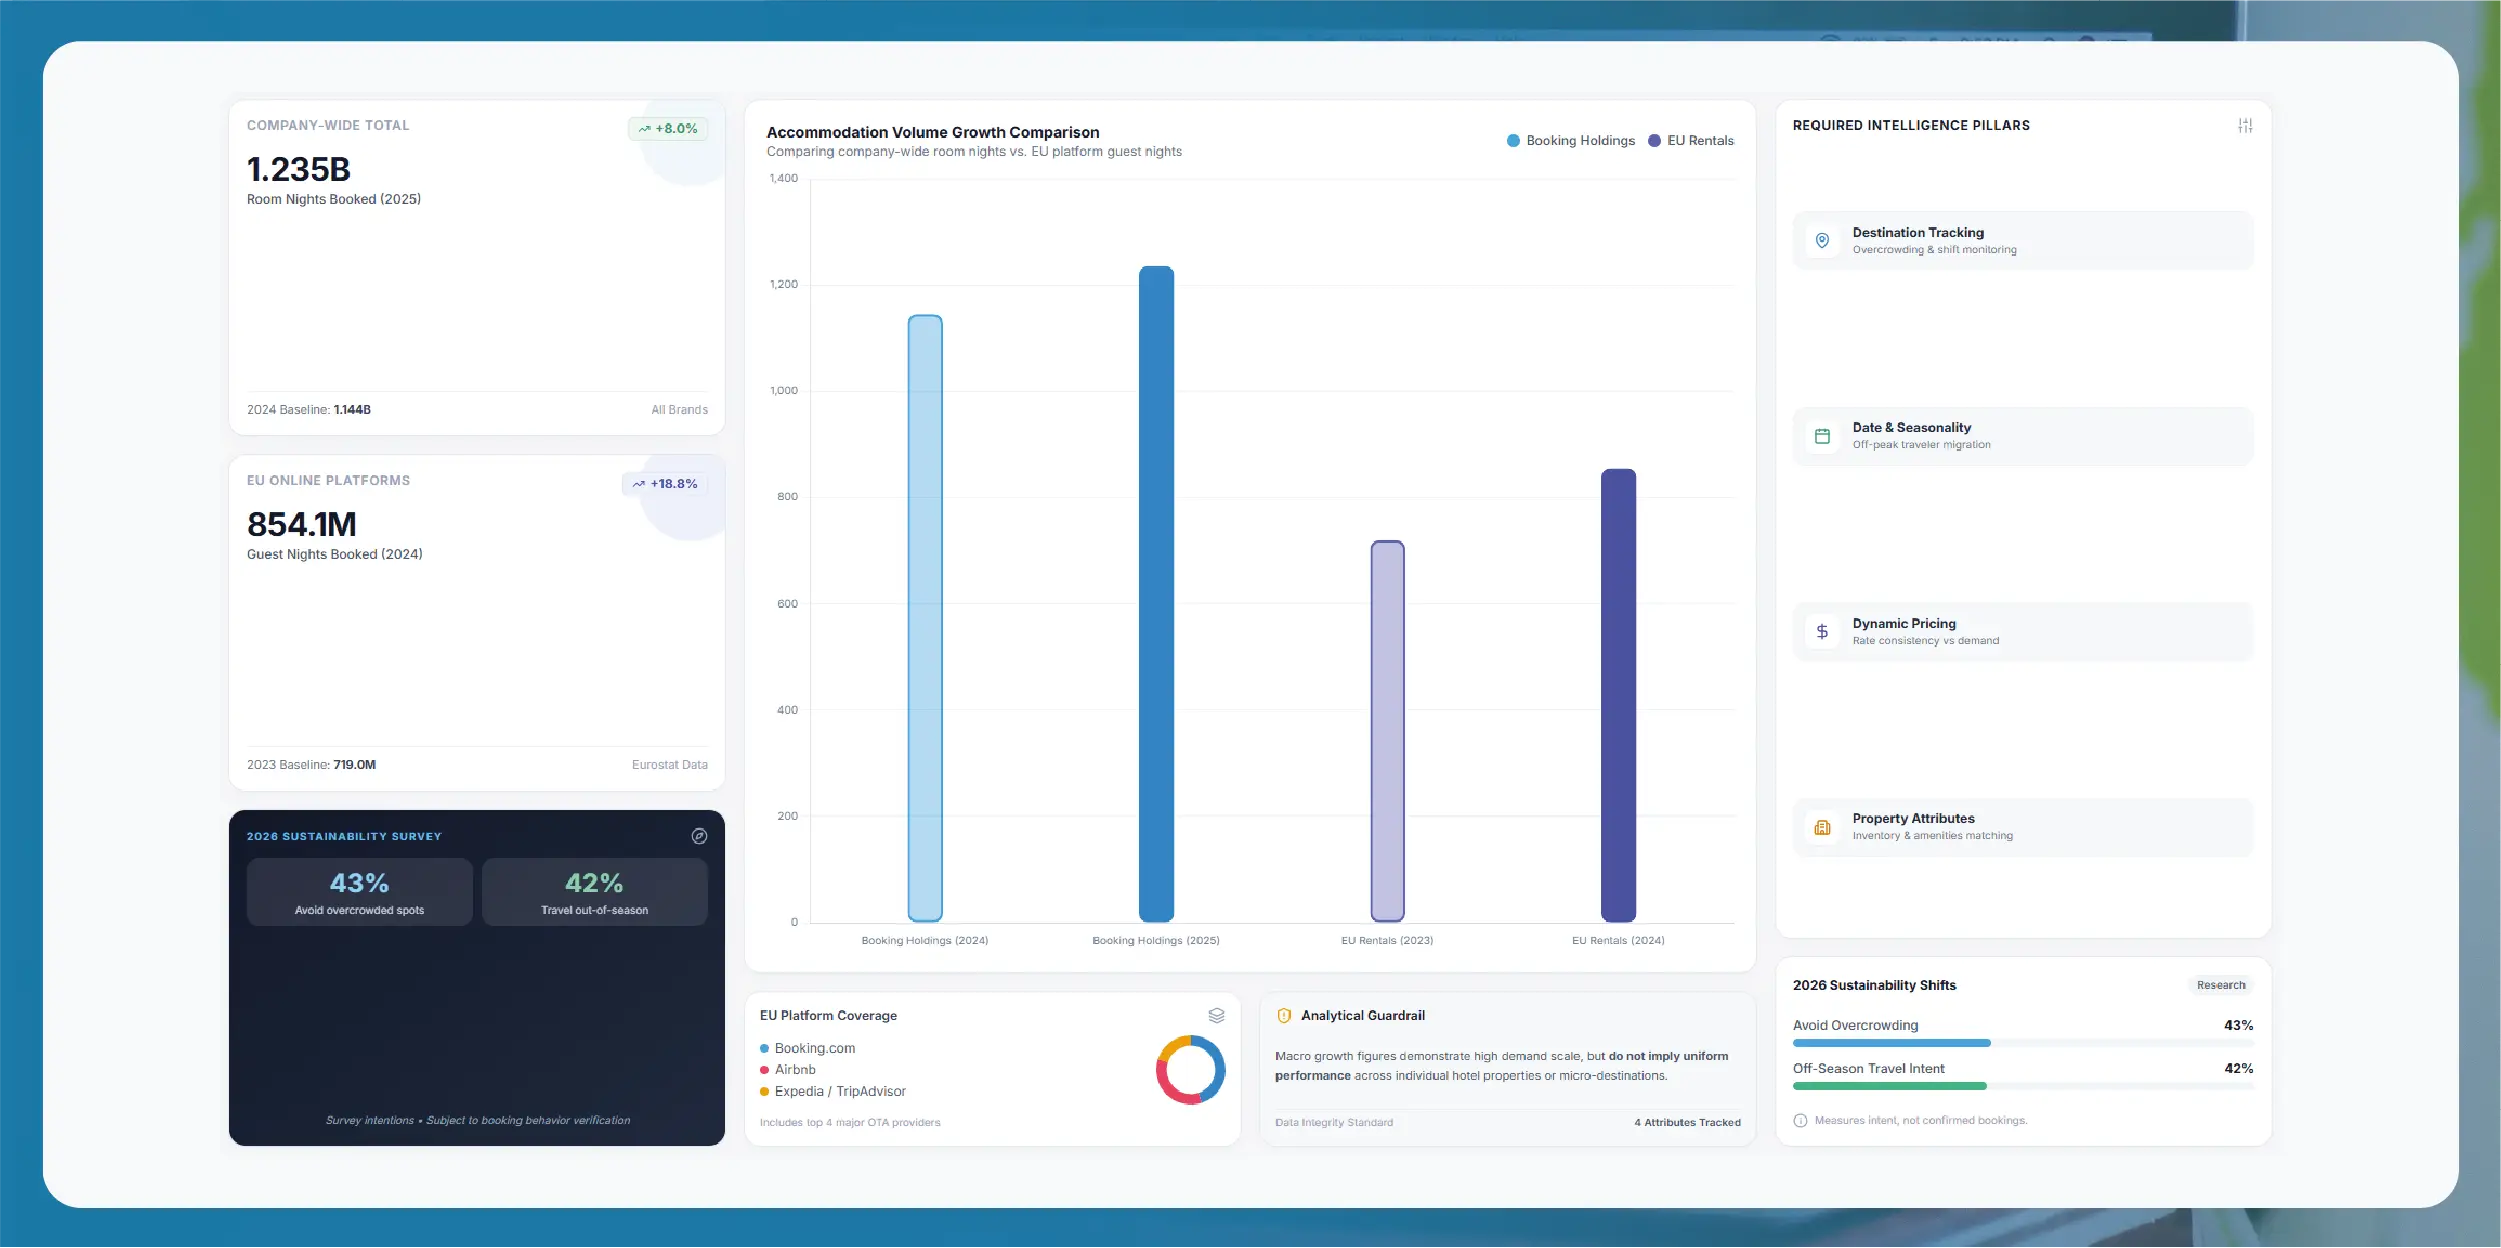
Published industry data demonstrates why consistent accommodation intelligence matters:
- Booking Holdings reported 1.235 billion room nights booked in 2025, an increase of 8% from 1.144 billion in 2024 across its brands. This is a company-wide figure, not a Booking.com-only metric.
- Eurostat reported 854.1 million guest nights in EU short-term rental accommodation booked through online platforms—including Booking, Airbnb, Expedia Group, and TripAdvisor—in 2024, up 18.8% from 719 million in 2023.
- Booking.com’s 2026 sustainability research found that 43% of surveyed travelers planned to avoid overcrowded destinations, while 42% planned to travel out of season. These are survey intentions, not confirmed booking behavior.
Together, these figures show the scale of online accommodation activity and the value of tracking destination, date, price, and property attributes consistently. They do not prove that every destination or hotel experienced the same growth.
How Can Businesses Compare Hotel Prices More Accurately?
A structured Booking.com hotel listings and pricing dataset 2026 can help travel businesses compare accommodation offers using consistent fields instead of relying on headline prices alone. For meaningful comparisons, records should distinguish the property, stay dates, room category, guest count, meal inclusion, cancellation conditions, taxes, and currency wherever this information is available.
For example, a revenue manager comparing three hotels in London should align the dates, number of guests, room type, and booking conditions before deciding which competitor offers the lowest comparable rate. Otherwise, differences in room inventory or cancellation terms can make the comparison misleading.
Which fields should a hotel-pricing dataset contain?
| Data field |
Why it matters |
| Property name and location |
Identifies the accommodation and its local market |
| Check-in and check-out dates |
Makes rate comparisons date-specific |
| Number of guests |
Aligns occupancy assumptions |
| Room type |
Prevents comparisons between unlike offers |
| Displayed price and currency |
Enables price benchmarking |
| Taxes and additional charges, when shown |
Improves total-cost comparisons |
| Cancellation and payment terms |
Explains differences between offers |
| Meal and other inclusions |
Helps compare value rather than price alone |
| Observation timestamp |
Records when the rate was seen |
| Source URL |
Allows verification of the original offer |
How should businesses interpret 2020–2026 market changes?
| Period |
Recommended analytical focus |
Business application |
| 2020–2021 |
Account for pandemic disruption and uneven travel restrictions |
Avoid treating unusual periods as normal seasonal baselines |
| 2022–2023 |
Monitor the recovery of online accommodation activity |
Compare rate patterns across destinations and seasons |
| 2024–2025 |
Use consistent observations alongside industry booking indicators |
Improve competitor and market benchmarking |
| 2026 |
Track current prices with precise search conditions |
Support date-specific pricing and revenue reviews |
UN Tourism reported that international tourist arrivals fell by 72% in 2020 compared with 2019, highlighting why pandemic-era data needs special treatment.
The 2020–2026 timeline above is a recommended analytical framework, not a claim that all destinations followed the same recovery pattern.
For reliable price analysis, businesses should calculate comparable medians and ranges, not just overall averages. They should also retain missing-value indicators and exclude offers that cannot be matched fairly. This creates a clearer view of a hotel’s competitive position and reduces the risk of pricing decisions based on incomplete comparisons.
How Can Businesses Monitor Hotel Rates and Room Availability?
Travel businesses need to understand both the price shown for a stay and whether a suitable room is actually offered for the selected dates. Extract Booking.com hotel price and availability data describes a workflow for capturing permitted accommodation observations with the search conditions needed to interpret them.
Availability is date-specific. A hotel may have several room categories, but only one may be available for a given occupancy or cancellation policy. Likewise, a displayed starting price may not represent the room a traveler selects after changing dates, adding guests, or choosing breakfast.
How can a rate-monitoring workflow operate?
- Define the comparison: Select the destination, properties, stay dates, occupancy, and room conditions.
- Capture the observation: Store the displayed rate, currency, visible conditions, and timestamp.
- Match comparable offers: Group observations by property, dates, room category, and booking terms.
- Compare with the previous observation: Flag rate changes and availability differences.
- Validate unusual results: Recheck large changes, missing prices, or inconsistent room details.
- Deliver an alert or report: Route useful findings to revenue managers or travel analysts.
Which metrics should be monitored?
| Metric |
How it helps |
| Comparable rate difference |
Shows how a hotel’s observed rate compares with competitors |
| Rate-change percentage |
Measures movement between comparable observations |
| Availability observation rate |
Shows how often selected properties return usable results |
| Data freshness |
Indicates the age of the latest observation |
| Match confidence |
Measures how reliably room offers are aligned |
| Missing-data rate |
Reveals gaps in the monitoring process |
From 2020 to 2021, travel restrictions and cancellations made historical rate comparisons unusually difficult. In 2022 and 2023, businesses could compare reopening patterns and changing seasonal rates where consistent data existed. During 2024 and 2025, broader online accommodation activity made cross-destination monitoring a useful analytical area. In 2026, scheduled observations can support more frequent reviews, provided collection is permitted and the source allows reliable access.
These are practical stages for organizing analysis, not verified adoption statistics. A monitoring system should never assume that a property is sold out simply because no room appeared in one search. The result could reflect the selected dates, occupancy, room conditions, a temporary technical issue, or a change in listing visibility.
The most useful output is therefore an observation with context: what was searched, what was returned, when it was checked, and what changed. That context helps revenue teams distinguish meaningful market signals from misleading fluctuations.
How Can Discount Analysis Reveal the True Cost of a Hotel Stay?
Promotional pricing can make hotel-rate comparisons difficult. A discount badge may refer to a particular room, travel period, membership condition, or booking requirement. Businesses should distinguish the displayed discount from the final comparable cost before using promotional information to make commercial decisions.
Booking.com Deals & Discount Data Extraction can help organize visible promotional labels, displayed prices, original reference prices where shown, and relevant conditions. The objective is to understand how offers differ—not to assume that every discount applies to every traveler or that a displayed reference price represents a price previously paid by customers.
Which promotional fields should be captured?
| Field |
Analytical value |
| Displayed rate |
Provides the price visible under the selected search conditions |
| Reference or crossed-out price, if shown |
Records the platform’s displayed comparison price |
| Discount label |
Identifies the promotion presented with the offer |
| Eligibility conditions |
Shows whether restrictions apply |
| Stay dates and booking window |
Establishes the period to which the offer relates |
| Cancellation policy |
Distinguishes flexible from restrictive offers |
| Taxes and fees, where available |
Supports more accurate total-cost comparisons |
| Capture timestamp |
Records when the promotion was observed |
A simple discount calculation is:
Displayed discount %=Reference price−Offer priceReference price×100\text{Displayed discount \%}= \frac{\text{Reference price}-\text{Offer price}} {\text{Reference price}}\times100Displayed discount %=Reference priceReference price−Offer price×100
This calculation is appropriate only when the two prices are comparable and the reference price is genuinely displayed. It does not establish whether the reference price is a typical market price.
How can discount patterns be analyzed from 2020 to 2026?
| Period |
Suggested focus |
Potential use |
| 2020–2021 |
Record unusual restrictions and promotional conditions |
Avoid misleading comparisons with normal travel periods |
| 2022–2023 |
Compare offers across reopening and recovery periods |
Understand changes in promotional presentation |
| 2024–2025 |
Standardize promotion labels and booking conditions |
Improve competitor-offer analysis |
| 2026 |
Compare eligible offers using matched stay conditions |
Support evidence-based campaign reviews |
This timeline describes a proposed analysis framework, not a verified history of Booking.com discount rates. Businesses should not infer a market-wide discount trend without a consistent historical sample.
For example, if a hotel shows a lower price for a non-refundable room than a competitor’s flexible room, the lower rate does not automatically mean it is more competitive. A useful dashboard can show the price difference alongside the policy difference. Revenue managers can then determine whether the offer suits the target customer and the hotel’s own pricing strategy.
Discount monitoring should also identify repeated observations of the same promotion. Without deduplication, one campaign can be counted many times and distort reports. A consistent record of the displayed offer, conditions, dates, and source gives analysts a more dependable basis for comparing promotional strategies.
How Can Reviews, Ratings, and Amenities Help Explain Competitor Positioning?
Travelers assess accommodation on more than price. Ratings, review themes, location, breakfast, Wi-Fi, parking, accessibility, and other amenities can influence how travelers compare hotels. A Booking.com hotel reviews ratings and amenities dataset can help hospitality businesses organize these attributes and evaluate how competing properties present their offerings.
Reviews and ratings need careful interpretation. A rating is a platform-specific signal, while individual reviews describe experiences that may depend on room type, visit date, expectations, and service conditions. A property’s rating should not be treated as a direct measure of its current operating quality without considering the volume and recency of feedback.
Which indicators are useful?
| Indicator |
What it can reveal |
| Displayed rating |
Summarizes the platform’s published rating |
| Review count |
Provides context for the rating |
| Review dates |
Helps distinguish recent feedback from older experiences |
| Recurring review themes |
Highlights topics such as cleanliness, service, or location |
| Amenity availability |
Supports feature-based comparisons |
| Property category |
Helps compare similar accommodation types |
| Location attributes |
Adds context to price and review differences |
How should this information be used from 2020 to 2026?
For 2020–2021, analysts should consider the unusual travel environment when interpreting review timing and volume. During 2022–2023, comparisons can be made across destinations and accommodation types where sufficient records exist. In 2024–2025, standardized review-theme categories can support more consistent competitor analysis. In 2026, current observations can be compared with historical snapshots if those records were lawfully collected and retained.
These periods are an analytical guide, not evidence of a specific increase or decrease in hotel ratings. Reviews may be unavailable for some listings, and older feedback may not be representative of present service levels.
For practical use, travel businesses can group feedback into themes such as cleanliness, staff service, room comfort, noise, location, and value for money. Automated text analysis can help categorize large collections, but ambiguous or potentially serious comments should be reviewed by a person. Businesses should not infer demographic traits or other sensitive personal details from guest reviews.
Amenities also require consistent interpretation. “Parking available” may mean on-site parking, nearby paid parking, or parking subject to availability. A useful dataset preserves the wording or supporting details where possible rather than collapsing every variation into a single unchecked yes/no field.
Combining rates, ratings, amenities, and location allows analysts to compare similar properties more fairly. For example, a hotel charging a higher rate may offer a different amenity mix or a more flexible policy. These attributes help explain price differences without assuming that the highest-rated or lowest-priced option is automatically the best competitor.
How Can Market Intelligence Identify Destination-Level Opportunities?
Hotel listing data becomes more useful when individual properties are analyzed in the context of their destination. Booking.com hotel market Data intelligence can help travel businesses compare accommodation supply, observed prices, rating distributions, property types, and amenities across cities or tourism regions.
For example, a destination manager may want to know whether the monitored accommodation options are concentrated in premium hotels, budget stays, apartments, or family-friendly properties. A hotel group may compare the range of rates offered by competing properties across multiple locations. A travel agency may use location-level patterns to identify gaps in its accommodation portfolio.
What real-world indicators can guide market analysis?
Eurostat reported that online platforms recorded 854.1 million nights in EU short-term rental accommodation during 2024, up 18.8% from 2023. This covers bookings through multiple platforms and should not be interpreted as Booking.com’s individual performance.
Booking Holdings also reported that room nights booked across its brands increased from 1.144 billion in 2024 to 1.235 billion in 2025, an 8% rise. Again, this is a company-wide measure, not a property-level dataset or a Booking.com-only total.
| Market indicator |
How a travel business can use it |
| Number of observed properties |
Assess the scope of monitored accommodation supply |
| Median observed rate by destination |
Compare prices while reducing the effect of extreme values |
| Distribution of property types |
Understand the composition of accommodation options |
| Rating distribution |
Compare published guest-rating patterns |
| Amenity coverage |
Identify common and less common property features |
| Seasonal rate variation |
Compare observed rates for matched dates across seasons |
| Listing coverage over time |
Identify changes in the monitored sample |
How can the 2020–2026 period support planning?
The pandemic created a significant disruption: UN Tourism reported a 72% decline in international tourist arrivals in 2020 compared with 2019.
Therefore, 2020–2021 should be interpreted as an exceptional period rather than an ordinary demand baseline. The years 2022–2023 can help examine recovery patterns where consistent data is available. The 2024–2025 period offers more recent context from online accommodation activity, while 2026 monitoring can extend the dataset with current observations.
Businesses should keep platform-level observations separate from broader tourism statistics. Listing counts are not the same as actual bookings, and displayed prices do not establish the number of guests who paid those rates. Similarly, more properties appearing in a search does not necessarily mean the destination has experienced equivalent growth in accommodation capacity.
A useful market report should include its geographic scope, observation dates, number of records, exclusions, and data limitations. These details make comparisons easier to interpret and help management distinguish genuine signals from changes caused by the dataset’s coverage.
How Can Businesses Track Changes Without Misreading Availability?
Hotel listings can change frequently as rates, room inventory, stay dates, and booking conditions change. Booking.com hotel Review & Rating Data Collection can support the ongoing review of guest feedback and rating observations, especially when each record includes its source, observation date, and the rating or review information visible at that time.
For a wider monitoring workflow, businesses can combine these records with rate and availability observations. The purpose is to identify changes that merit investigation, not to assume every change reflects a shift in customer demand or hotel performance.
What should a monitoring process capture?
- Establish the baseline: Save the selected property, search conditions, visible rating, review count, and timestamp.
- Repeat comparable checks: Use consistent search conditions wherever possible.
- Detect changes: Flag observed changes in ratings, review counts, displayed prices, and availability.
- Deduplicate observations: Prevent the same unchanged record from being treated as a new event.
- Verify important findings: Check the original listing before reporting material changes.
- Retain the history: Keep dated observations so analysts can compare the latest result with earlier records.
Which measures should teams track?
| Measure |
Why it matters |
| Observation freshness |
Shows how recently a property was checked |
| Review-count change |
Indicates a change in the displayed volume of feedback |
| Rating movement |
Identifies a change in the displayed score |
| Rate-change frequency |
Measures how often observed prices change |
| Availability observation |
Records whether a matching offer was visible under defined conditions |
| Alert precision |
Measures how often alerts identify a meaningful change |
| Record-match reliability |
Helps prevent changes from being attributed to the wrong property |
From 2020 to 2021, historical records may reflect unusually disrupted travel conditions. In 2022–2023, consistent snapshots can support comparisons during recovery. During 2024–2025, businesses can examine whether changes in observed listing attributes align with broader accommodation-market indicators. In 2026, regular monitoring can continue the history and help teams spot changes relevant to their target destinations.
These stages are suggested practices, not claims that complete historical records are available for every property. A listing disappearing from search results should not automatically be classified as a closure or a sold-out property. It may no longer match the search conditions, or the source may have changed its presentation.
The same caution applies to ratings. A score change may reflect new reviews, a change in the displayed rating, or a data-capture issue. Monitoring tools should flag the observation and preserve evidence rather than assign a cause without verification.
A reliable monitoring process therefore combines consistent collection, careful matching, alert thresholds, and human review of material findings. This helps travel businesses use changing data as an early signal while avoiding unsupported conclusions.
How Can Actowiz Solutions Help Travel Businesses Use Accommodation Data?
Actowiz Solutions can help travel businesses design structured data workflows for hotel rate comparison, accommodation benchmarking, destination research, and ongoing listing analysis. The objective is to organize permitted listing information into reliable records that support business decisions instead of requiring teams to repeat manual searches.
A project based on the Booking.com Dataset 2026 should begin with clear requirements: which destinations to monitor, which accommodation attributes matter, how frequently observations are needed, and which systems will use the output. Collection methods must be selected according to source permissions, available interfaces, and applicable terms.
What can a tailored data solution include?
- Source and requirements assessment: Define the properties, destinations, fields, and search conditions relevant to the business.
- Structured data collection: Organize available prices, room attributes, ratings, amenities, and listing details into consistent records.
- Data normalization: Standardize currencies, dates, property categories, and other fields while preserving source information.
- Rate comparison: Match accommodation offers with comparable dates, occupancy, room types, and booking conditions.
- Historical tracking: Retain dated observations where they have been collected or are available through authorized sources.
- Data-quality checks: Identify duplicates, missing values, inconsistent records, and results that need verification.
- Dashboard-ready delivery: Prepare outputs for supported databases, spreadsheets, dashboards, or business applications.
Travel Data Scraping can support these workflows when businesses need structured accommodation information for competitive research and market analysis. Actowiz Solutions can help scope a suitable process around the client’s objectives, source limitations, data requirements, and preferred output format.
How should a business evaluate the project?
| Implementation stage |
Main activity |
Success measure |
| Discovery |
Define business questions and target sources |
Requirements coverage |
| Pilot |
Collect a limited set of representative records |
Record completeness |
| Validation |
Check prices, conditions, and property matching |
Data accuracy and match reliability |
| Analysis |
Compare prices and accommodation attributes |
Relevance of insights |
| Monitoring |
Repeat permitted checks and detect changes |
Freshness and alert quality |
| Expansion |
Add destinations or use cases after validation |
Consistent performance at larger scale |
A pilot should establish measurable baselines before the workflow expands. For example, a travel company could evaluate whether its team can compare rates more consistently, reduce duplicate records, identify missing conditions, or prepare competitor reports more efficiently. Results should be measured against the company’s own starting point rather than relying on generic claims about savings or accuracy.
The workflow should also preserve source links and observation timestamps. These details help analysts confirm important findings and understand whether two offers were genuinely comparable. For sensitive commercial decisions, human review should remain part of the process.
Conclusion
Travel businesses need more than isolated hotel prices to understand their competitive position. They need comparable rates, clear booking conditions, property attributes, guest-rating context, and dated observations that show how listings change. A well-structured dataset can bring these elements together to support hotel benchmarking, destination analysis, and revenue planning.
Booking.com Travel Datasets can provide a foundation for analyzing permitted accommodation information when the dataset’s scope, freshness, and limitations are clearly documented. Web Scraping may support collection from accessible sources where permitted, while Mobile App Scraping should be considered only when the relevant data can be accessed lawfully and in accordance with applicable terms. A Real-time dataset should accurately reflect the collection frequency and source update behavior rather than promise instantaneous information without evidence.
Actowiz Solutions can help your business define its data requirements, organize accommodation records, establish validation rules, and prepare analysis-ready outputs for your travel intelligence workflow.
Ready to improve hotel rate comparison and market visibility? Contact Actowiz Solutions to discuss a tailored accommodation data collection and analytics solution.

 By industry🏷 By platform🌐 By market
 Pricing & Promotions
MAP Violations Brand Protection Counterfeit Detection Price Intelligence AI HOT Data Intelligence
 Brand & Intelligence
Share of Search Content Audit & PDP Reviews & Ratings Retail Media Buy Box Monitoring Social Commerce HOT Live Commerce NEW Agentic Commerce NEW
 Digital Shelf & Search
Assortment Planning Competitive Benchmarking Product Availability Q-Commerce NEW
 AssortmentE-commerce Intelligence Hyperlocal Insights POI & Store Locator DTC Brand Analytics NEW
 For Retailers
 E-Commerce Dashboard
 Flipkart Insights (Live) #1
 Grocery Intelligence
.svg) Grocery Price (U.S.)
.svg) Quick Commerce (India) HOT
 Food & Restaurant
 Fashion Intelligence
 Automotive
 Travel & Hospitality
 Real Estate
 Food Delivery Intelligence NEW
 OTT & Streaming NEW
 Fuel & EV Charging Price Tracker NEW
 By Use Case
 Pricing Intelligence
 Digital Shelf Analytics
 MAP Monitoring HOT
 Cross-Border Price Parity NEW
 Share of Search
 Review Sentiment
 Kitchen Market Gaps NEW
 Dynamic Pricing / AI Repricing NEW
 Promotions & Deals Alerts NEW
 B2B / POI & Lead Data NEW
 AI Search Visibility Dashboard NEW
 Baby Products on Quick Commerce NEW
 Hotel & Flight Rate Parity NEW
 By Region🇮🇳 India 🇺🇸 USA 🇦🇪 Middle East 🇬🇧 UK 🇦🇺 Australia 🌏 SE Asia 🇪🇺 Europe 🌎 LATAMIndia
 Flipkart Real-Time Insights
 Quick Commerce — Zepto · Blinkit
 Pincode Price Tracker
Middle East
 GCC Q-Commerce — Talabat · Noon NEW
UK & Australia
 UK Grocery — Tesco, Sainsbury's, Asda
 AU Grocery — Coles & Woolworths NEW
 Marketplace Scrapers
Amazon API TikTok Shop API HOT Uber Eats API Airbnb API Zepto / Blinkit API Instacart API NEW Talabat API NEW
 Developer APIsWeb Extract API Reviews API SERP API Pricing Webhook NEW
 Universal APIsStreaming Crawl API Scheduler Realtime Alerts Webhook Delivery 🐍 Python SDK 💚 Node.js SDK
 Delivery & SDKs
 Knowledge Center
Digital Shelf Playbook MAP Compliance Guide Pricing Intel Guide Scraping Compliance TikTok Shop Guide NEW Cross-Border Guide NEW
 Guides & Playbooks
🎉 Seasonal & event tracking NEWBlack Friday pricing report Festive season, India Ramadan, GCC grocery All seasonal reportsSample Datasets HOT ROI Calculator NEW API Postman Collection Demo Dashboards Free API Playground NEW Press Kit
 Downloads & Tools
Trust Center About Us FAQs Careers
 Trust & CompanyRetail shelf research NEWRetail shelf research


 4.8/5 Average Rating
 50+ Video Testimonials
 92% Client Retention
 50+ Countries Served