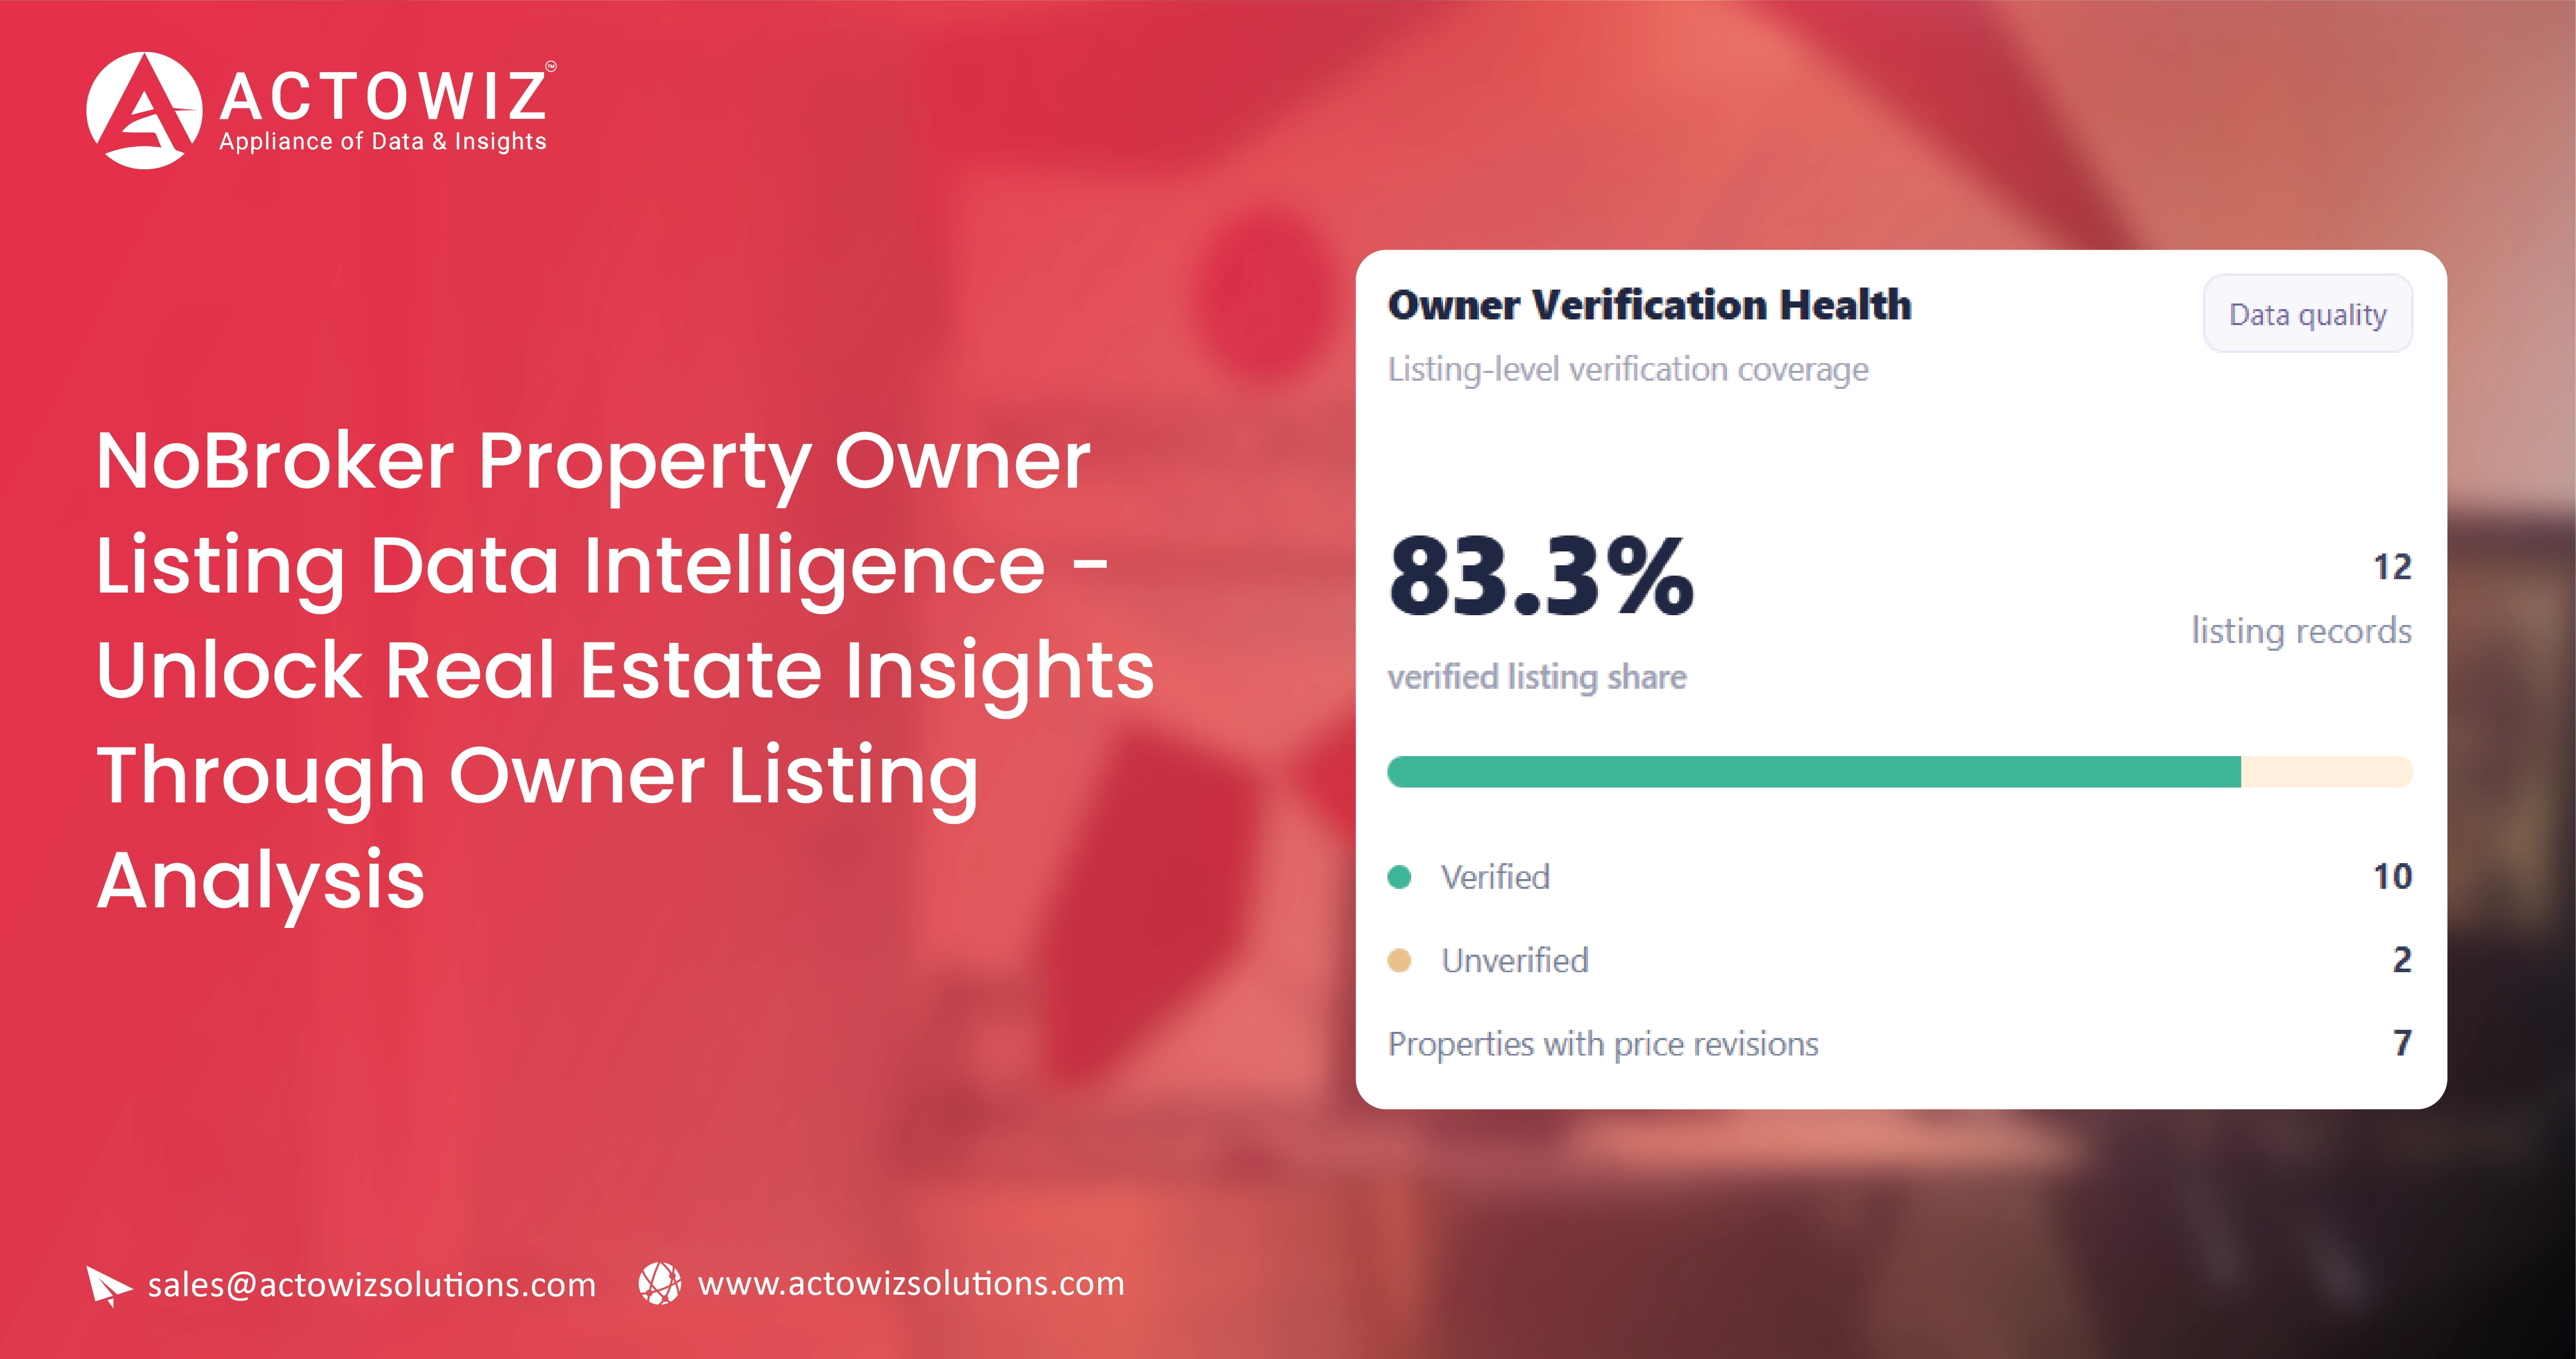
NoBroker Property Owner Listing Data Intelligence helps real estate businesses, property consultants, investors, and market researchers analyze publicly accessible property listings, advertised prices, rental trends, property configurations, and location-level market activity. By organizing listing observations into structured datasets, businesses can compare market conditions, identify changes, and make more informed decisions.
India's property market is increasingly influenced by digital discovery, online property advertising, and data-driven research. NoBroker is a real estate platform that connects property seekers with owners and offers services related to renting, buying, and selling property. Its owner-listed inventory can provide useful signals about advertised prices, property characteristics, and the locations in which listings appear.
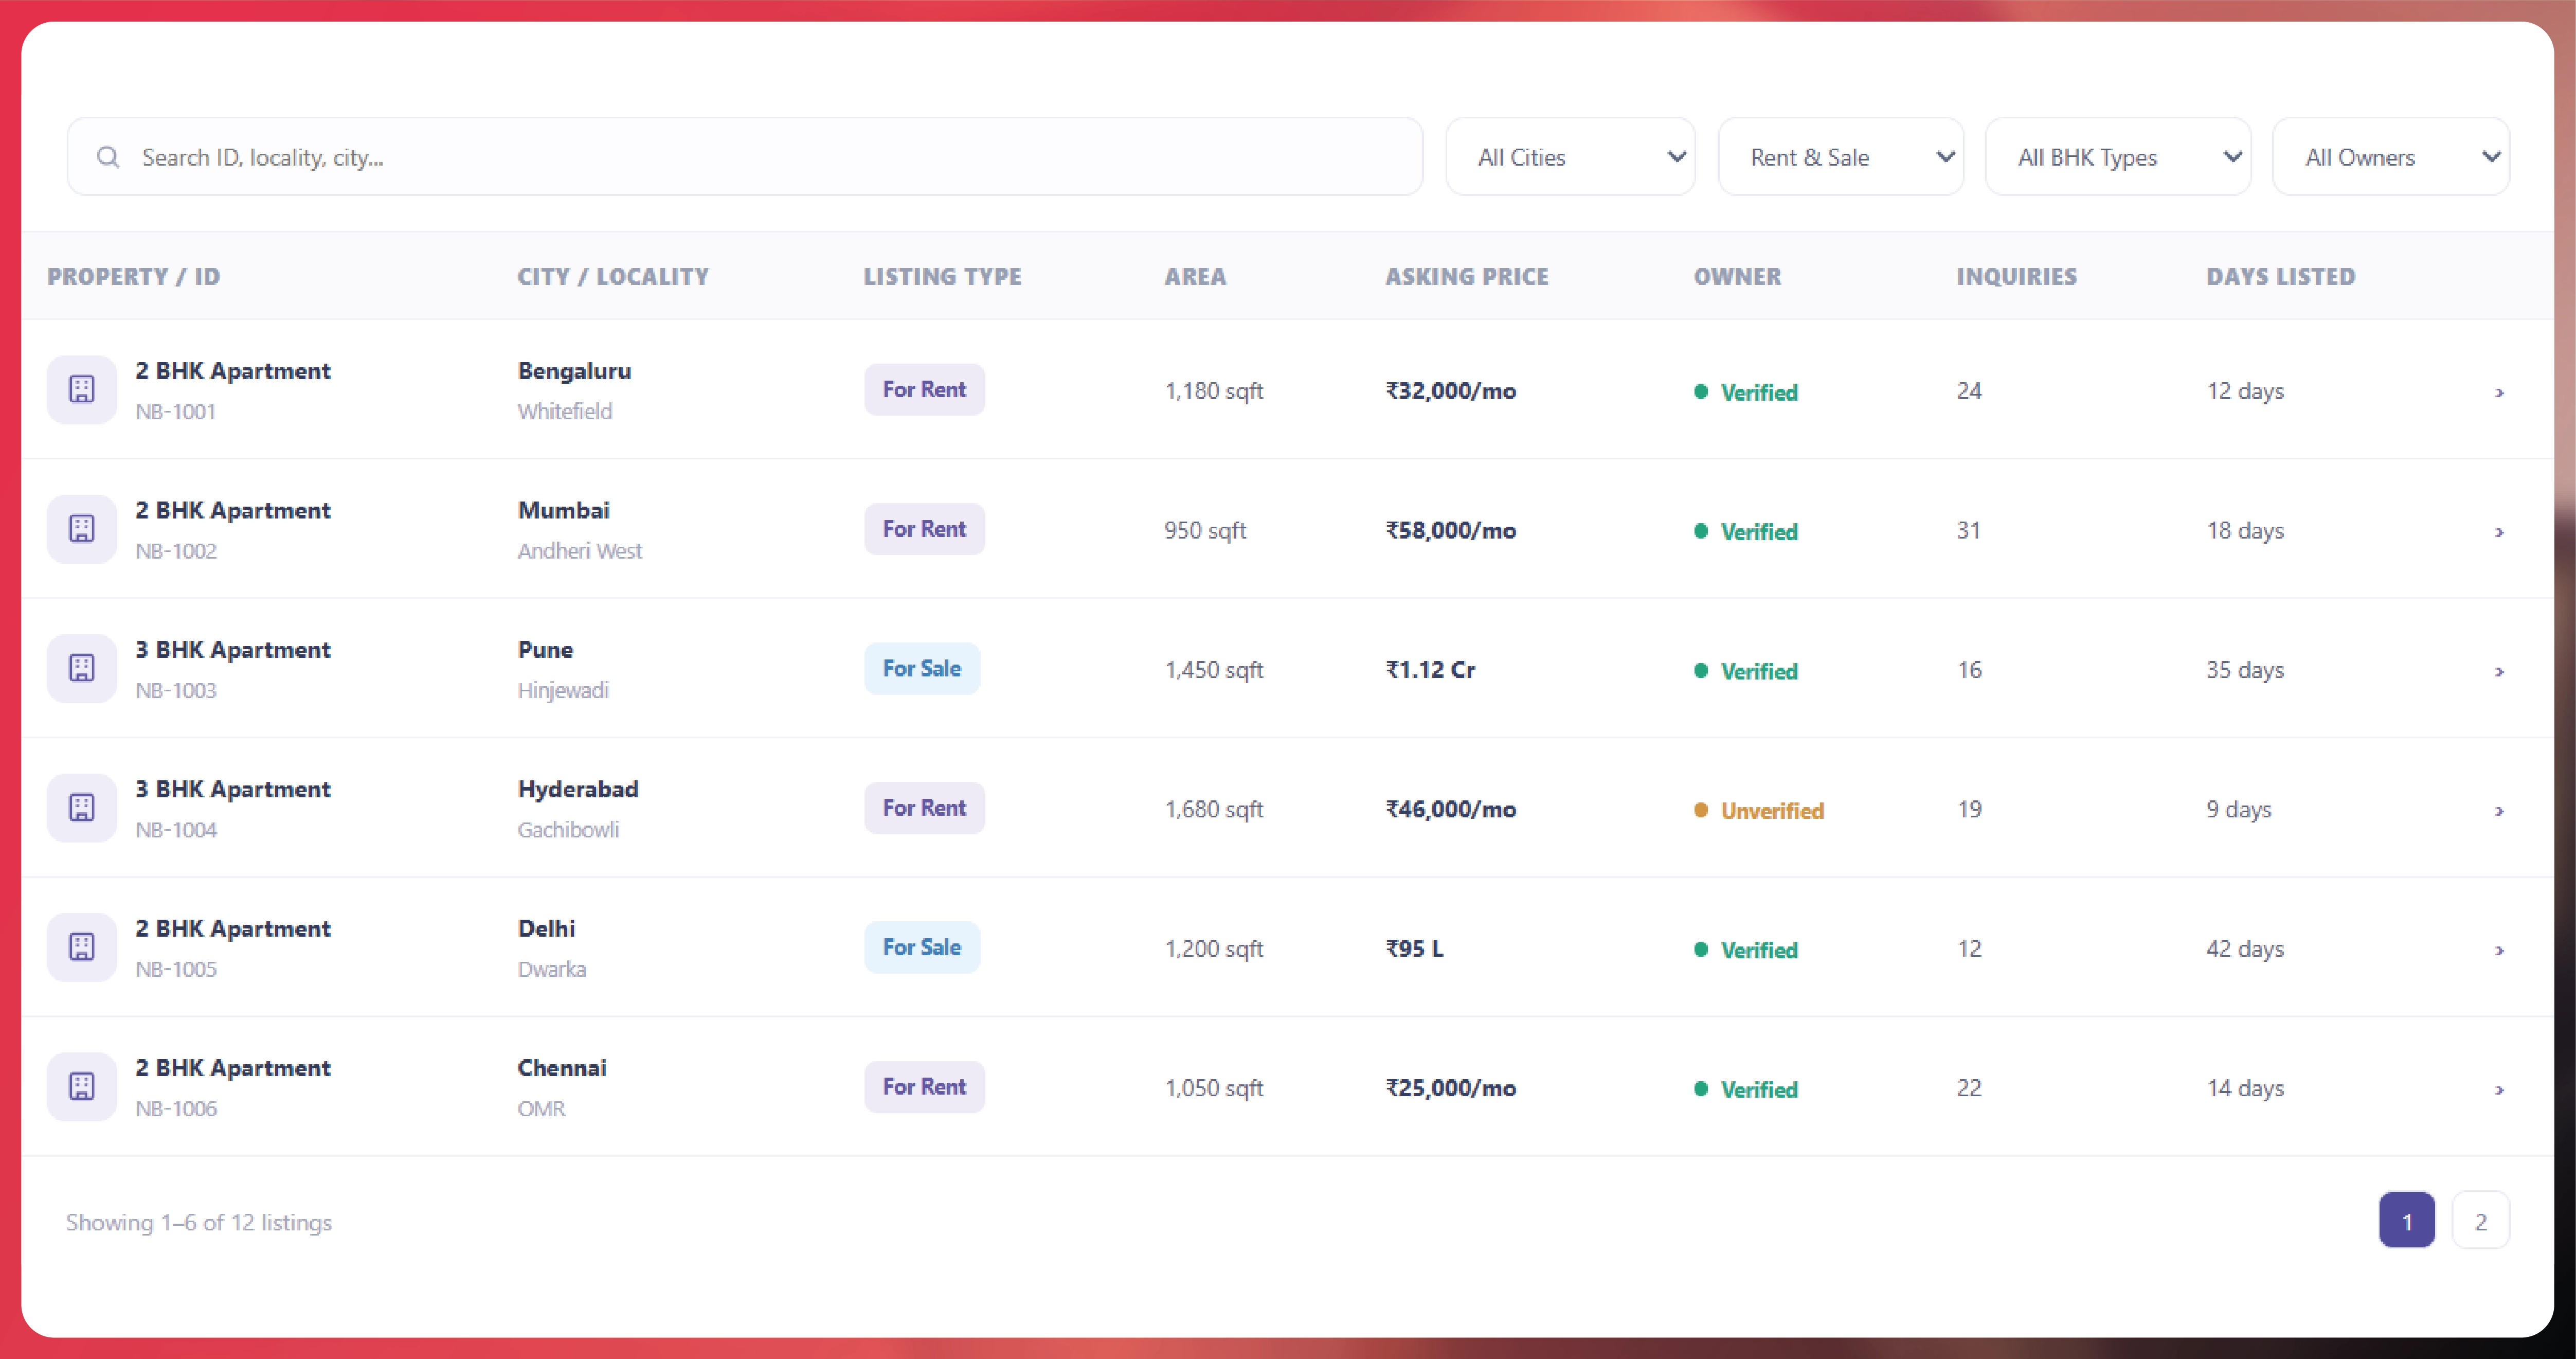
Real Estate Data Scraping Services can support these research objectives when data is collected through authorized, legally compliant methods. A structured dataset may include listing identifiers, property type, location, advertised rent or sale price, furnishing status, configuration, listing date where available, and other relevant attributes.
The value comes from consistency. A single listing provides limited context, but carefully documented observations over time can help researchers understand asking-price patterns, changes in available inventory, and differences between neighborhoods. These insights should be interpreted as indicators of advertised market conditions, not proof of completed transactions or actual property valuations.
For real estate agencies, proptech companies, institutional researchers, and investment teams, the goal is to turn fragmented listing information into reliable evidence for market analysis.
NoBroker owner listing data Scraping can support real estate research by organizing permitted listing information into comparable records. The NoBroker Property Owner Listing Data Intelligence approach focuses on the attributes that help explain market activity: property type, location, configuration, asking price, furnishing, and listing status.
For rental agencies and property research firms, a structured dataset can make it easier to compare advertised rents across neighborhoods and identify shifts in the types of properties being offered. For residential developers and investment analysts, sale listings can provide additional context on asking prices and available inventory.
The key distinction is between listing intelligence and transaction data. An advertised price is what a listing presents, not necessarily the price agreed between a buyer and seller or landlord and tenant. Likewise, a listing disappearing from a website does not automatically mean the property has been sold or rented.
NoBroker describes its platform as a marketplace connecting property owners with people looking to rent or buy homes. Its official overview also discusses listing verification and the provision of property information to help users shortlist homes. (NoBroker, About Us)
| Field | Research value |
|---|---|
| Listing identifier | Helps distinguish records |
| Property category | Separates apartments, houses, and other types |
| Locality or neighborhood | Supports geographic comparisons |
| Advertised rent or sale price | Enables asking-price analysis |
| Bedroom configuration | Supports like-for-like comparisons |
| Furnishing status | Adds context to rental comparisons |
| Listing observation date | Supports historical tracking |
| Availability indicator | Records the observed listing status |
These fields can support practical questions such as whether advertised rents differ between localities, whether particular property configurations dominate available inventory, or whether asking prices have changed between observation periods.
Data quality is essential. Duplicate listings, inconsistent locality names, missing fields, and changed property descriptions can distort results. A reliable workflow should standardize these fields and document uncertainty instead of silently filling gaps.
Businesses that Extract property prices and listing details from NoBroker need a consistent schema that preserves the meaning of each field and the context in which it was observed.
For rental analysis, relevant attributes can include monthly rent, security deposit where listed, bedroom count, furnishing status, property type, and locality. For sale listings, researchers may need the advertised total price, property configuration, area measurement where available, and location. These fields should remain separate because rental and sale listings represent different market decisions.
Price comparisons also require unit consistency. A property's total sale price cannot be compared directly with a price-per-square-foot figure, and monthly rent should not be compared with a yearly amount without normalization. When area is recorded, analysts should preserve the original unit and the source's definition rather than assume that carpet area, built-up area, and super built-up area are interchangeable.
| Comparison | Required controls |
|---|---|
| Rent across localities | Match property type and bedroom configuration |
| Sale prices across neighborhoods | Record the same price definition and currency |
| Furnished versus unfurnished rentals | Keep other property attributes as comparable as possible |
| Price per square foot | Use a consistent area basis |
| Price changes over time | Compare dated observations of the same or comparable properties |
| Deposit comparisons | Store separately from monthly rent |
India's residential market shows why careful segmentation matters. JLL reported 302,867 apartment sales across India's top seven cities in 2024, an 11% increase from 271,818 in 2023. Bengaluru, Mumbai, and Pune accounted for approximately 62% of annual sales across those cities. (JLL, January 2025)
Those figures describe completed residential sales in JLL's coverage, not NoBroker listing volumes. They nevertheless provide useful context for why location, price segment, and property type should be controlled when interpreting online listing information.
A robust analysis should also retain outliers for review. A very high asking price might reflect a premium property, a data-entry error, or a different area measurement. Automatically removing such records can conceal genuine market variation.
A NoBroker rental and sale property dataset India can help researchers compare advertised residential supply across cities and localities, provided that each record is collected lawfully and the dataset's coverage is documented.
The NoBroker Property Owner Listing Data Intelligence framework can combine location, property configuration, advertised price, and listing status to support geographic comparisons. It can also help teams identify areas where the observed mix of properties differs by bedroom count, furnishing, or price segment.
A national dataset must not be treated as a complete census of India's housing market. Listings on one platform represent only the inventory visible through that source and collection method. They may exclude properties advertised elsewhere, off-market transactions, and homes that are not currently listed online.
| Year | Reported residential-market indicator | Source |
|---|---|---|
| 2020 | A directly comparable annual sales figure is not provided in the cited JLL series below | JLL residential research |
| 2021 | A directly comparable annual sales figure is not provided in the cited JLL series below | JLL residential research |
| 2022 | JLL's cited comparison identifies the post-pandemic period as a stronger sales period | JLL, January 2025 |
| 2023 | 271,818 apartment sales across the top seven cities | JLL, January 2025 |
| 2024 | 302,867 apartment sales across the top seven cities, up 11% year over year | JLL, January 2025 |
| 2025 | Knight Frank reported 348,207 residential sales across the top eight markets, down 1% year over year | Knight Frank H2 2025 report |
| 2026 | A full-year result is not available as of October 2026 | See the latest available Knight Frank research |
Methodology note: JLL's 2023–2024 figures cover apartments across seven cities, whereas Knight Frank's 2025 figures cover residential sales across eight markets. The numbers should not be interpreted as a perfectly comparable time series.
These market indicators can guide the questions a research team investigates, but they cannot be used to infer NoBroker's market share or the performance of an individual owner listing.
For actionable regional analysis, researchers should report sample coverage, the date of collection, property categories included, and any gaps in geographic representation. This makes it easier for business users to distinguish a genuine pattern in the observed data from a limitation in the dataset.
Residential property market Data intelligence helps investors, real estate consultants, and housing researchers bring listing information together with broader market indicators to evaluate residential opportunities.
Listing data can reveal advertised prices, available configurations, and the geographic distribution of properties. When researchers combine those observations with credible market reports, infrastructure information, and verified transaction data, they can develop a more complete picture of a neighborhood's housing conditions.
The distinction between asking prices and actual property values is particularly important. A collection of advertised prices does not establish the price at which homes transact. It also does not independently measure rental yields, occupancy, capital appreciation, or investment returns.
JLL's 2025 analysis illustrates the importance of segmentation. The firm reported that homes priced at ₹1 crore and above represented approximately 62% of apartment sales across India's top seven cities in H1 2025, compared with 51% in H1 2024. Over the same period, total apartment sales in those markets declined by approximately 13% year over year to 134,776 units. (JLL, August 2025)
These figures show why national averages can conceal differences between market segments.
| Indicator | How it supports research |
|---|---|
| Median advertised price | Summarizes observed asking prices |
| Advertised rent | Provides a rental-market reference |
| Property configuration | Supports comparison between similar homes |
| Locality-level inventory | Describes observed listing supply |
| Listing duration, where reliably recorded | Helps investigate how long properties remain advertised |
| Verified transaction prices | Provides evidence of completed market activity |
| Rental and ownership costs | Supports more complete financial analysis |
Investment teams should avoid using asking-price movements as a substitute for verified transaction trends. A higher advertised price may reflect a change in the mix of homes listed rather than appreciation in comparable properties.
A sound research process should therefore compare like-for-like properties, record the observation period, identify potential duplicate listings, and separate direct observations from external market statistics.
NoBroker property availability monitoring helps businesses track whether a property listing remains visible and how its recorded attributes change across observation periods. This can support rental-market research, property inventory analysis, and internal reporting.
However, visibility and actual availability are not identical. A listing may disappear because it has been removed, expired, edited, temporarily hidden, or made unavailable for another reason. Unless a reliable status is explicitly provided, researchers should not automatically label a disappeared listing as rented or sold.
A monitoring workflow should record the date and time of each observation, preserve a stable listing identifier where lawfully available, and distinguish between confirmed status changes and uncertain outcomes.
| Metric | Interpretation |
|---|---|
| Active observed listings | Listings visible during a defined observation period |
| New observations | Listings not present in the previous comparable snapshot |
| Removed observations | Previously visible listings that are no longer found |
| Price revisions | Changes in advertised prices for matched records |
| Attribute revisions | Changes to configuration or property descriptions |
| Reappearance rate | Previously missing listings that become visible again |
| Data coverage | Share of the intended scope successfully observed |
These metrics require consistent collection rules. For example, a change in search filters or geographic coverage could make listings appear to have disappeared even when the underlying property remains available.
Privacy and platform permissions must also be considered. NoBroker's Privacy Policy explains that the platform may process personal information, including contact details and property-related information. Property research should therefore prioritize necessary listing attributes, avoid collecting personal information without an appropriate legal basis, and respect applicable privacy obligations and platform restrictions.
For business users, the practical benefit is a more defensible record of observed changes. Reports should explicitly identify uncertain outcomes instead of presenting inferred rental or sale completions as verified facts.
A Property Listing Data API India workflow can provide a standardized way to deliver authorized property records to internal applications, reporting systems, and analytics platforms. The suitability of an API depends on the source's access permissions, available fields, refresh frequency, and technical integration requirements.
An API does not automatically guarantee real-time updates, complete coverage, or permission to collect data from every property portal. Those capabilities must be confirmed for the specific source and agreement.
For property analytics teams, an effective delivery design should include a documented schema, stable record identifiers where permitted, timestamps, pagination or batch-handling rules, error reporting, and a clear approach to historical records.
| Component | Purpose |
|---|---|
| Structured property fields | Standardizes listing attributes |
| Record identifier | Supports matching and deduplication |
| Timestamp | Establishes when the record was observed |
| Location taxonomy | Makes geographic analysis consistent |
| Data-quality indicators | Flags incomplete or uncertain records |
| Update documentation | Explains how changes are represented |
| Access controls | Limits data access to authorized users |
| Delivery documentation | Supports integration and troubleshooting |
Before deployment, businesses should test the dataset against their actual research questions. A rental analytics team may need furnishing and monthly rent, while a residential investment team may prioritize sale price, area, and locality. Collecting unnecessary fields adds complexity without necessarily improving the analysis.
The appropriate refresh schedule also depends on the use case. Weekly or twice-weekly snapshots may be sufficient for some market research, while inventory-sensitive applications may require more frequent updates if the source supports them.
The central requirement is transparent data provenance: every record should have a clear source, collection time, and documented limitations. This allows analysts to distinguish measured information from assumptions and makes downstream reports easier to audit.
Actowiz Solutions can help organizations plan property-data projects around defined research objectives, authorized data access, and clear quality requirements. The focus should be on producing usable, consistent datasets rather than collecting the largest possible volume of unstructured information.
For teams evaluating Real Estate Dashboard development, the right data structure can make it easier to review asking prices, property configurations, geographic patterns, and listing changes from a single reporting environment. The NoBroker Property Owner Listing Data Intelligence workflow can be scoped to the business's required geography, property types, reporting fields, and observation schedule, subject to applicable permissions.
Actowiz Solutions can help with:
These services are relevant to property portals, real estate consultants, residential developers, investment researchers, and proptech businesses that need reliable inputs for market analysis.
Any NoBroker-specific data collection should be assessed against the platform's current terms and applicable privacy requirements before implementation. Personal contact information should not be collected or redistributed merely because it appears on a listing page.
A well-scoped project begins with a simple question: which business decision should the data improve? Defining that question first helps teams choose the appropriate fields, update frequency, validation rules, and delivery format.
Digital property listings provide useful signals about advertised prices, available inventory, property configurations, and neighborhood-level activity. When those observations are organized consistently and compared with verified market research, they can support more informed housing analysis.
The NoBroker Real Estate Dataset approach can help businesses develop structured records for authorized property research, with clear distinctions between asking prices, observed listing availability, and verified transactions.
Actowiz Solutions can help businesses evaluate their requirements for a Web scraping API, Custom Datasets, or an instant data scraper workflow, subject to source permissions and applicable privacy obligations. The objective is to make property information easier to analyze, validate, and incorporate into business decisions.
Contact Actowiz Solutions to discuss your real estate data requirements and explore a compliant, business-focused approach to property listing intelligence.
You can also reach us for all your mobile app scraping, data collection, web scraping, and instant data scraper service requirements!
Our web scraping expertise is relied on by 4,000+ global enterprises including Zomato, Tata Consumer, Subway, and Expedia — helping them turn web data into growth.
Watch how businesses like yours are using Actowiz data to drive growth.
From Zomato to Expedia — see why global leaders trust us with their data.
Backed by automation, data volume, and enterprise-grade scale — we help businesses from startups to Fortune 500s extract competitive insights across the USA, UK, UAE, and beyond.
We partner with agencies, system integrators, and technology platforms to deliver end-to-end solutions across the retail and digital shelf ecosystem.
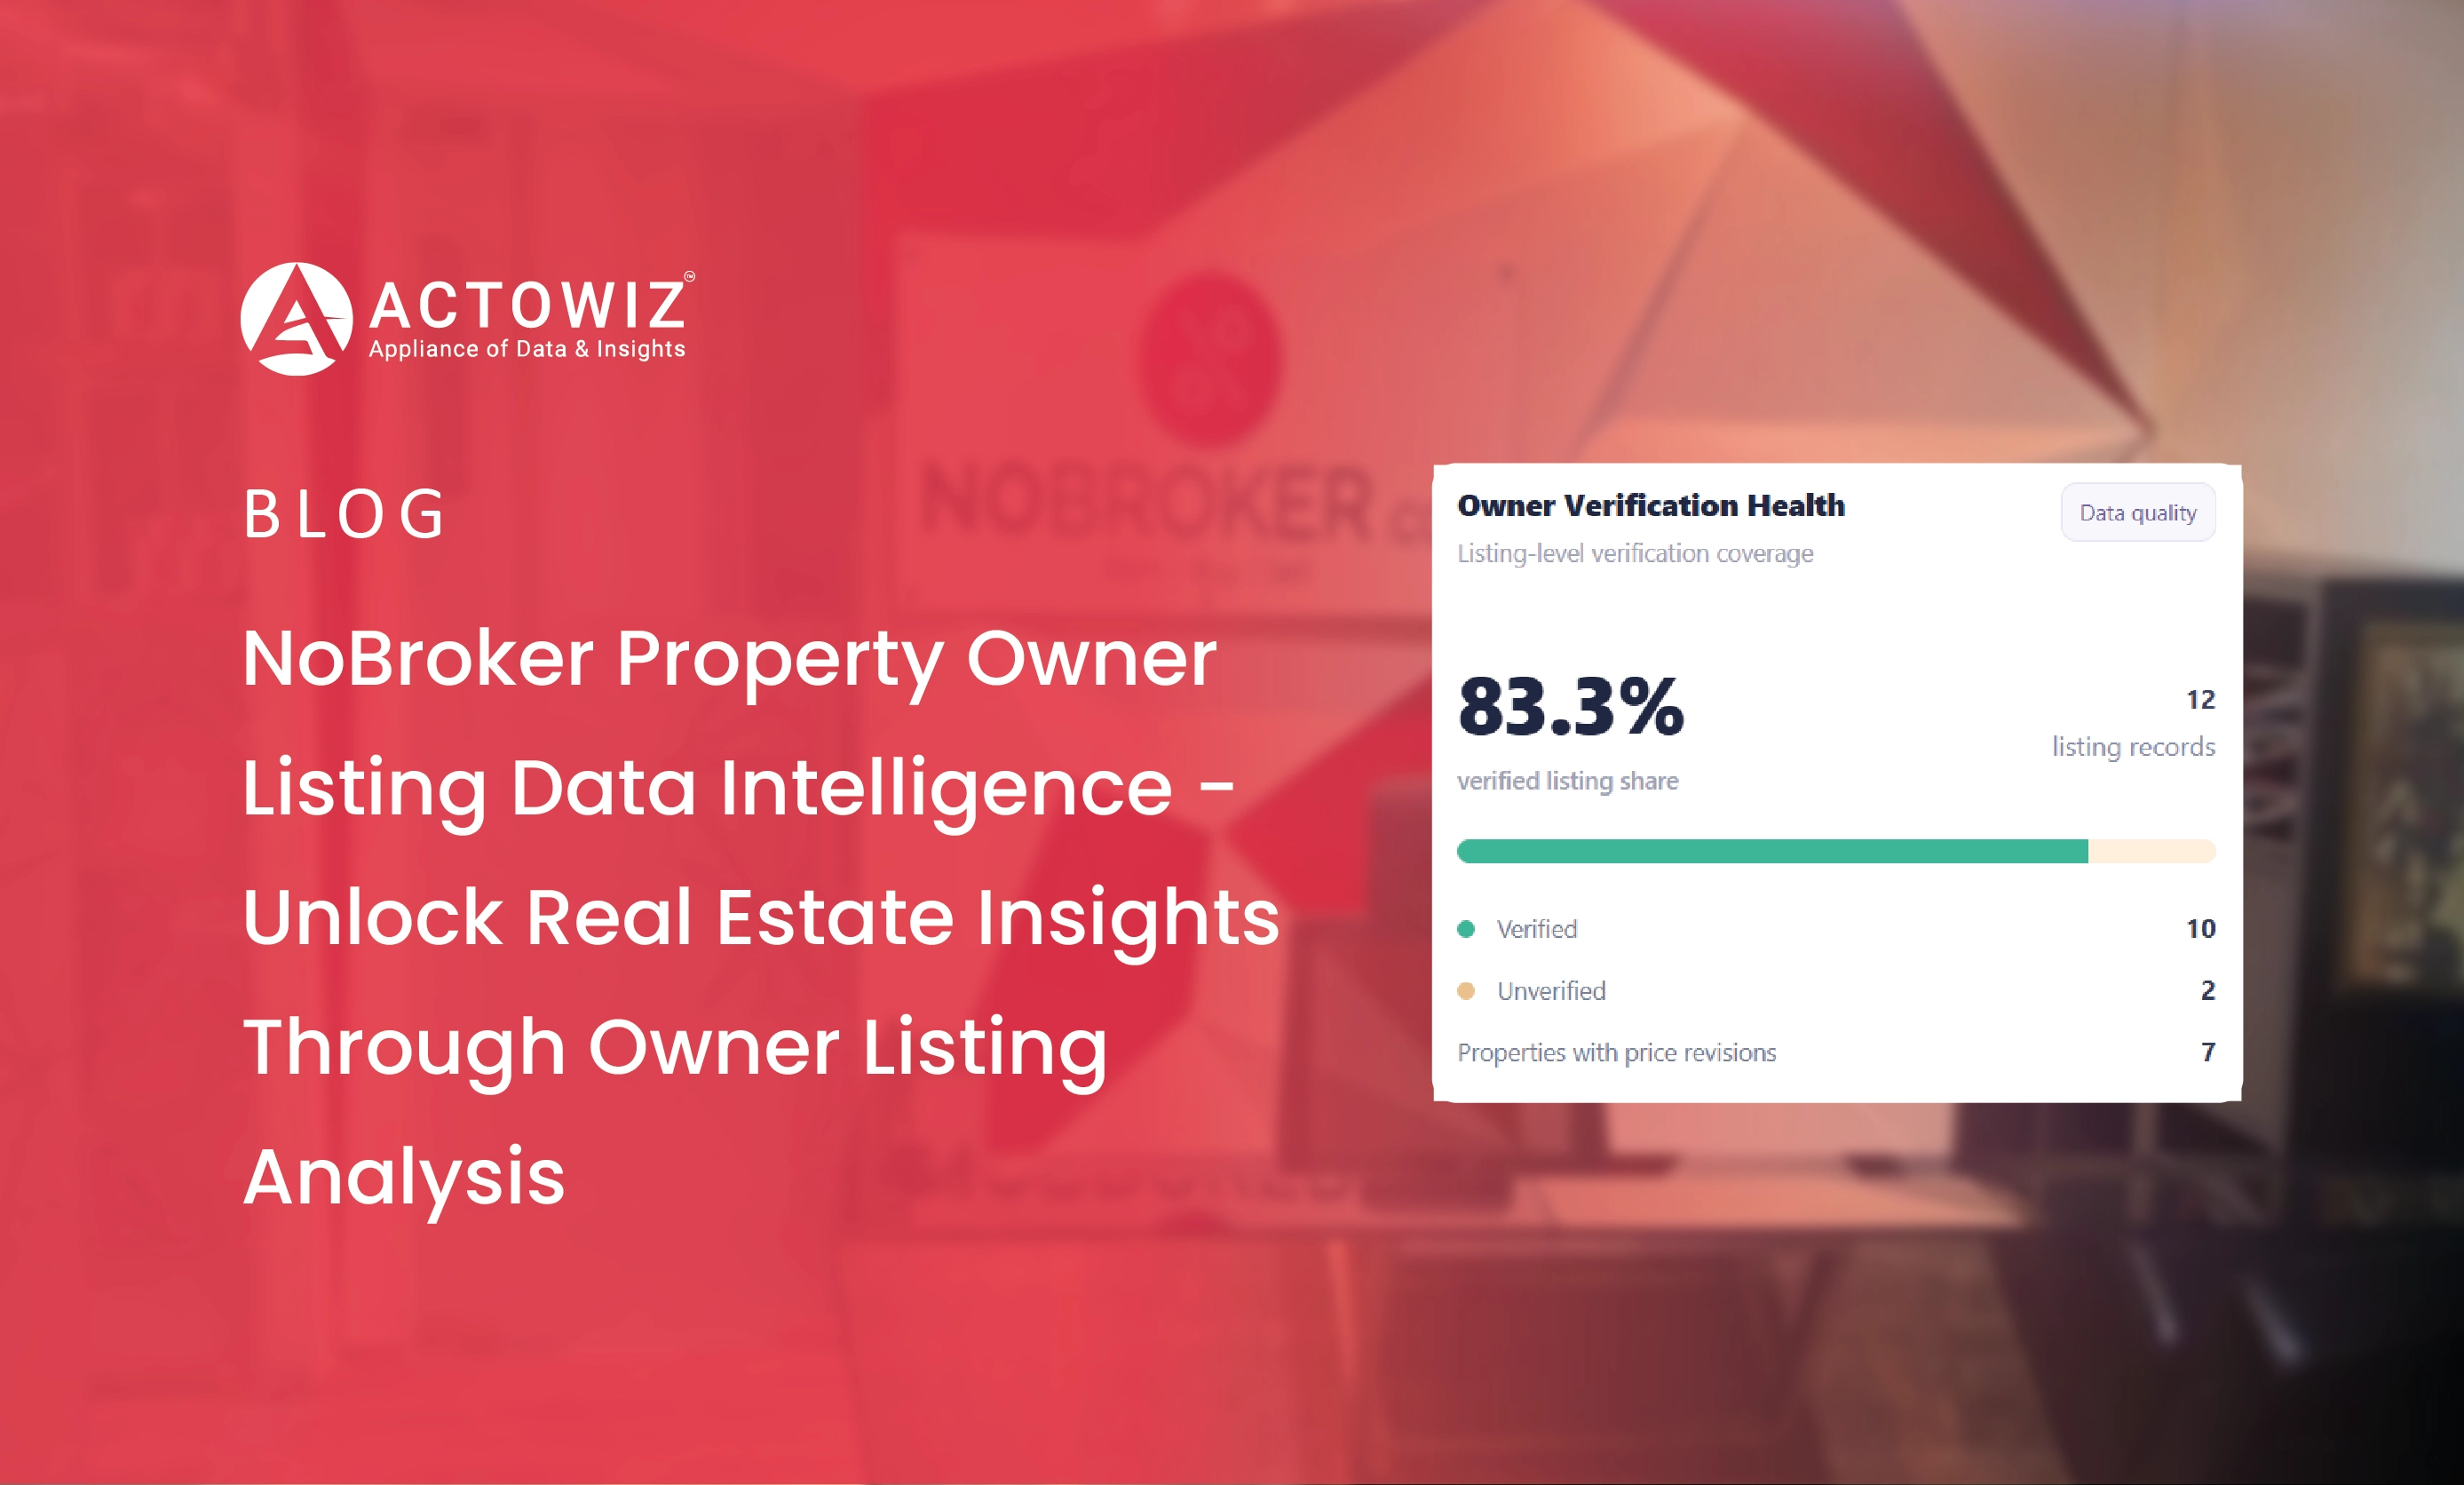
Explore NoBroker Property Owner Listing Data Intelligence to analyze property prices, rental trends, locations, and real estate market insights.
Explore how Travel Price Comparison Data Scraping helps travel brands monitor fares, compare rates, and gain real-time competitive pricing insights.
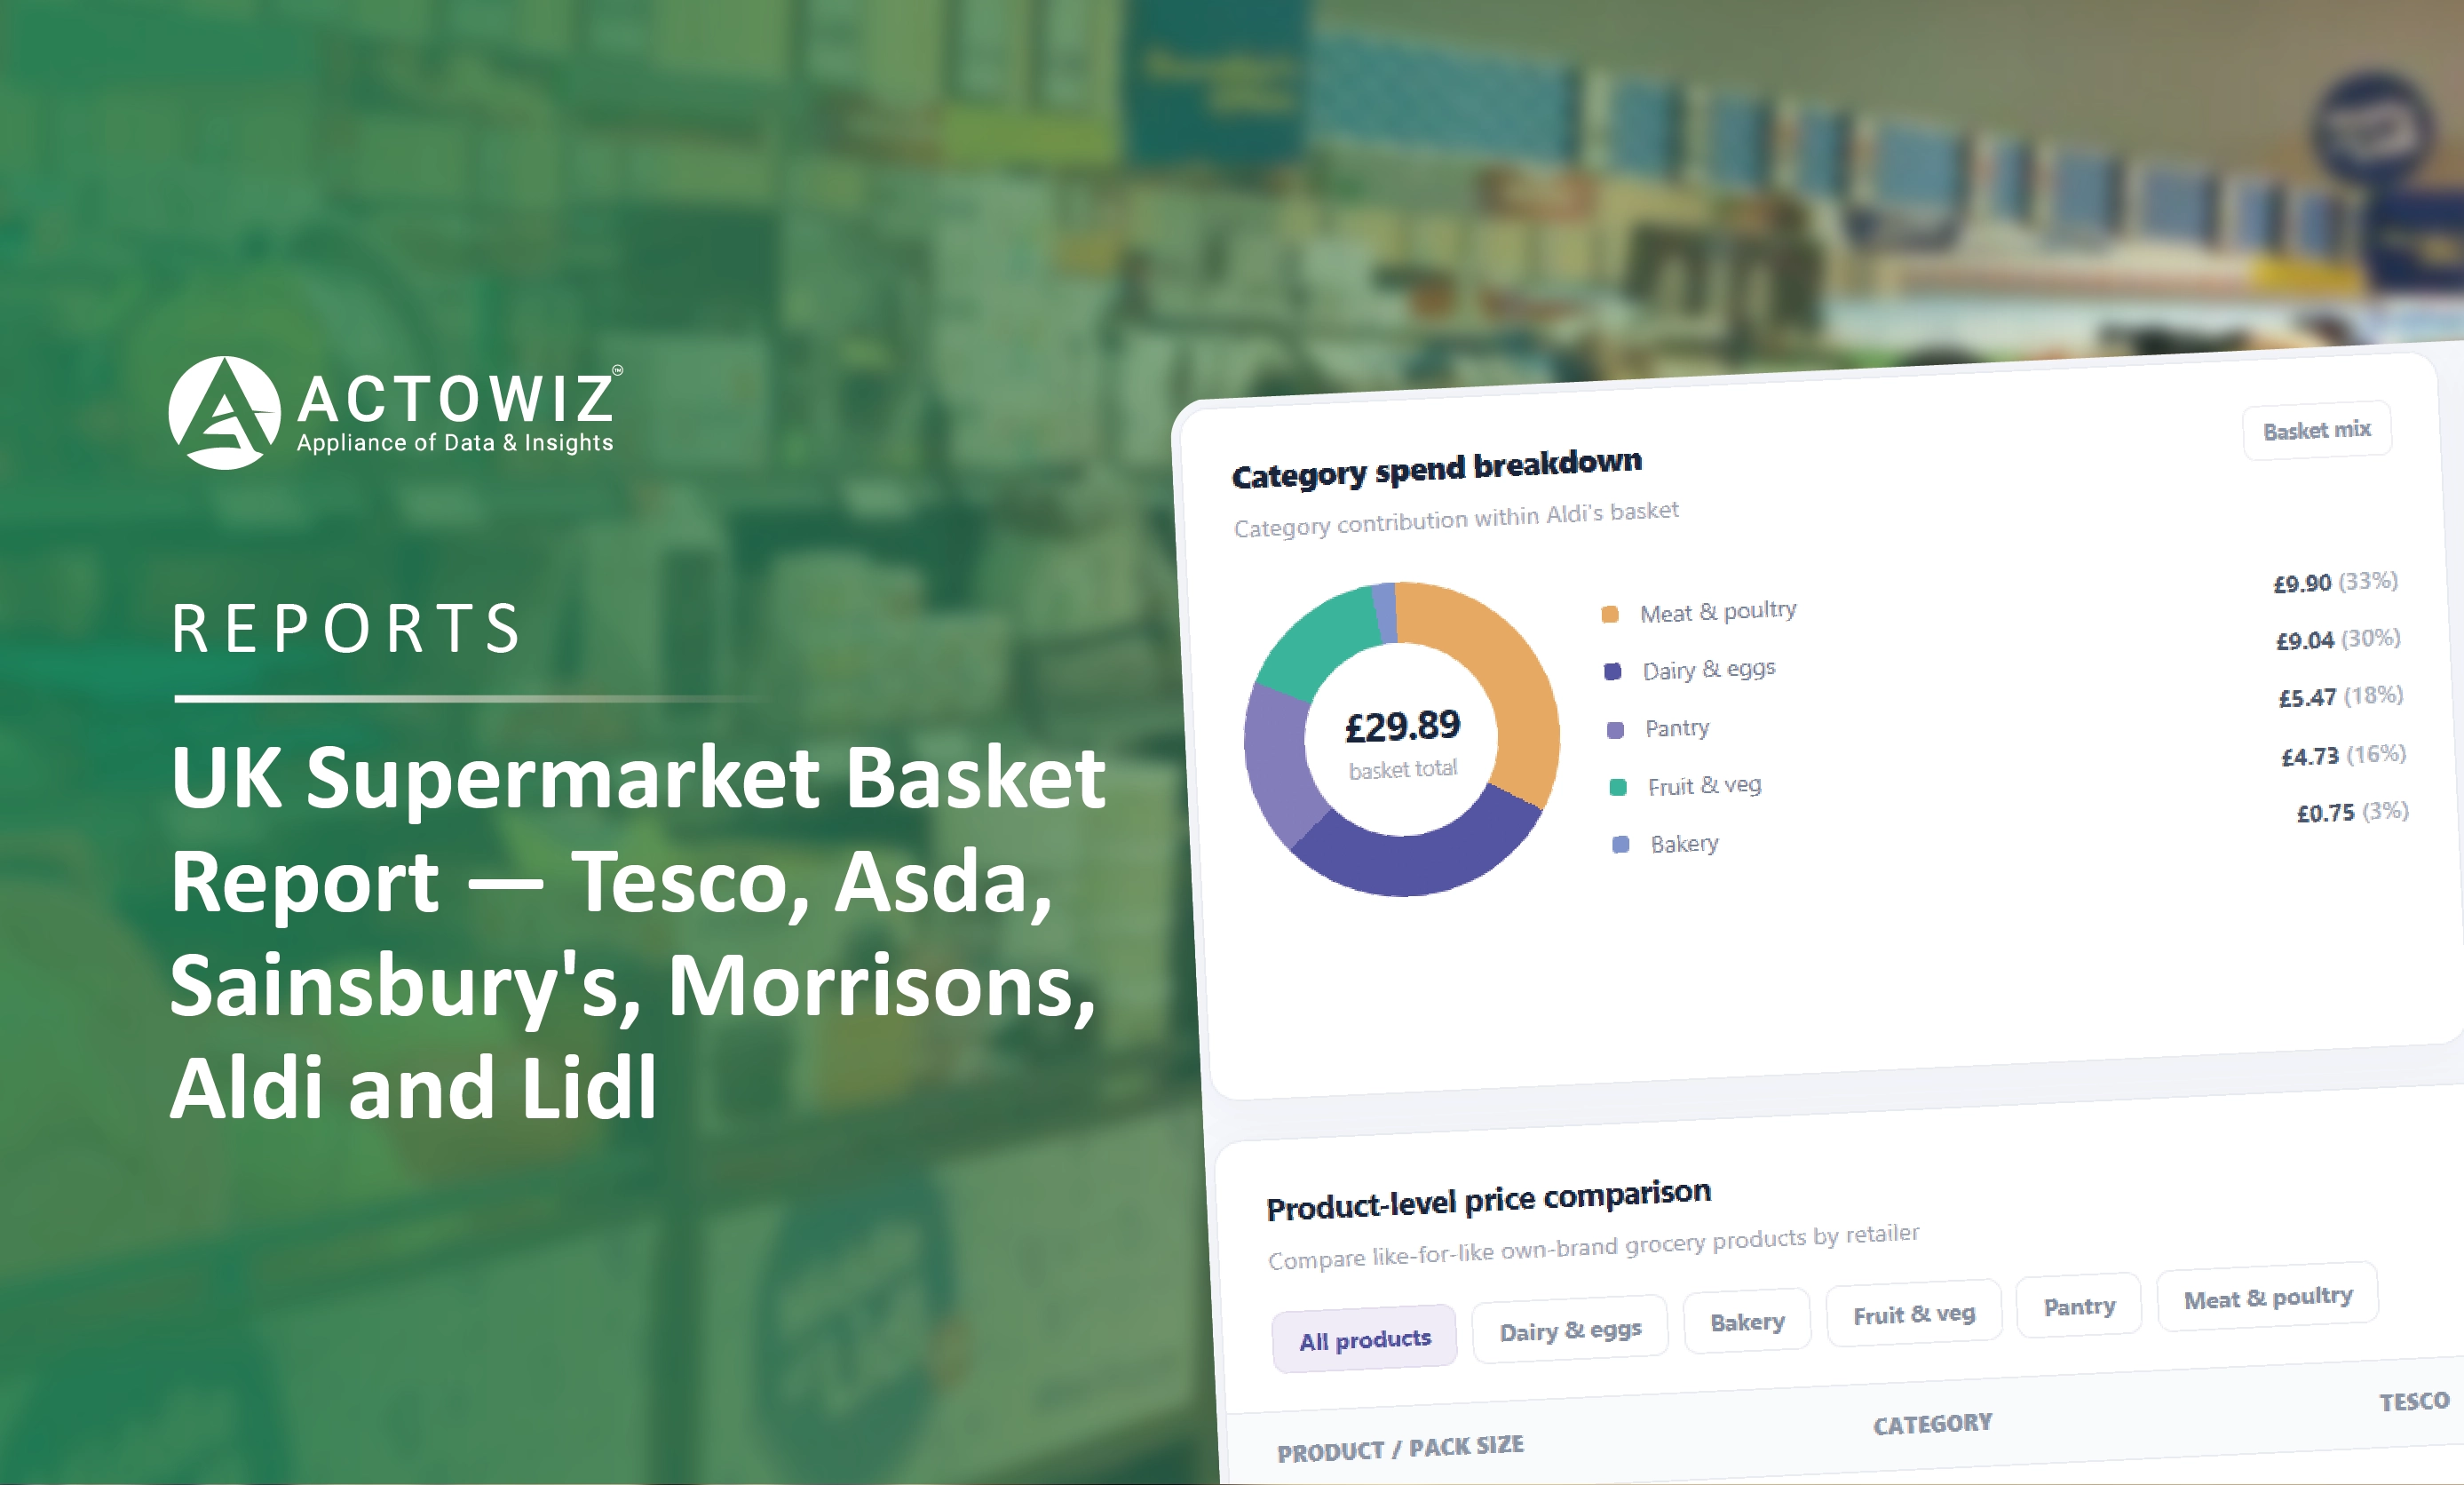
Explore UK supermarket basket prices across Tesco, Asda, Sainsbury's, Morrisons, Aldi, and Lidl. Compare grocery prices, product ranges, promotions, and retailer pricing trends.
Whether you're a startup or a Fortune 500 — we have the right plan for your data needs.