🎃 HALLOWEEN OFF Spooky Savings Event! Get FLAT 20% OFF on all Web Scraping & Data Extraction Plans 20% OFF Web Scraping Plans!
Ends in: 00d : 00h : 00m : 00s
🦇
👻
🎃 Spooktacular Limited Offer

Don’t Let High Data Costs Haunt You! 🎃

Get FLAT 20% OFF

T&C Apply

Scrape competitor prices, monitor MAP, and extract real-time datasets at a spooky discount this Halloween.

Offer Expires In:
00d : 00h : 00m : 00s
⚡ Claim 20% Discount Now
🎃
Promo Code Copied!
SPOOKY30 (20% OFF Applied)
Core services
Enterprise Data Extraction

Scalable web, app and AI-powered collection across 40+ countries.

All 58 services →
New 2026
AI Training Data

Corpus building with provenance and opt-out compliance.

Learn more →
Free pilot
24-hour sample

We run collection on your own sources before you commit.

Get a sample →
58Services
40+Countries
DEVELOPER

Ready-Made Scrapers

Pre-built for top platforms. Self-serve, no setup.

View All →
TRY FREE

API Playground

Test endpoints instantly. No credit card.

Start Free →
28Tools
2SDKs
icons Delivery & SDKs
Streaming Crawl API Scheduler Realtime Alerts Webhook Delivery 🐍 Python SDK 💚 Node.js SDK
Need it managed instead?

Fixed monthly retainer, named engineer, no per-request metering.

Managed Data API →
HOT

Case Studies

How brands use Actowiz, with named outcomes.

Read →
FREE

Sample Datasets

Real output, no signup.

Download →
NEW

ROI Calculator

Model the return on a data engagement.

Calculate →

Introduction

Category and national account managers at UK grocery suppliers who need their own lines and competitors' priced week by week across six retailers. Own-label and sourcing teams benchmarking tier-for-tier against the discounters. Pricing analysts tracking how much of a headline price is loyalty-gated. Researchers who need a basket series with a frozen, published basket definition rather than a shifting one.

This answers the September inquiry pattern: recurring UK grocery price monitoring on a fixed basket, isolating the loyalty-price versus standard-price gap as a distinct captured value, and own-label versus branded benchmarking at unit-price level.

What this report measures

For a fixed basket of everyday items, collected weekly and reported monthly as a continuous series, the report measures what six grocers displayed online: the standard displayed price; the loyalty-gated price where the retailer runs one (Tesco Clubcard Price, Sainsbury's Nectar Price) captured as a separate field that never overwrites the standard price; the retailer's published price-per-unit exactly as printed with its stated basis; pack size and unit; promotional mechanic and wording; availability; and whether the item is listed at all.

It derives basket cost by retailer on both a standard-price and a loyalty-price basis; month-on-month movement of each series; unit-price comparison using the published per-unit fields; the own-label versus branded gap within matched categories and tiers; the loyalty-price gap where both prices show; and promotional mechanics prevalence.

What this report does and does not measure. It measures observed online prices, published unit prices, loyalty-price gaps, promotional mechanic prevalence, availability rate and basket cost. It does not measure market share, grocery sales, volume share, shopper numbers, till-roll inflation or any official price statistic. This is not a consumer price index and must not be read as one: the basket is ours, fixed and published, and is not weighted to national consumption. "Cheapest basket" means the lowest total for our basket, at our collection times, on the stated price basis. It does not mean cheapest shop. Own-label comparisons across retailers are category-and-tier equivalents, not identical products, and are labelled so on every figure. We publish no estimate of any retailer's sales or share.

Collection design — written as a repeatable monthly build

Sample at a glance
Planned scope
Retailers 6
Basket lines 75 (frozen and versioned)
Postcodes (store-varying fields only) 12
National-field observations per weekly pass 450
Store-varying observations per weekly pass ~5,400
Cadence Weekly, four or five passes aggregated per monthly edition
Records per monthly edition ~26,000

These figures are the planned scope derived from the basket, the postcode sample and the weekly cadence described below — not an achieved count. Captured volume runs lower, because a line permanently delisted at a retailer records delisted rather than a price, a line carried only in another pack size drops out of pack-price comparison, and a failed pass is excluded rather than filled. What share of the basket each retailer actually lists and has available is a reported result availability rate by retailer, and by retailer × category, and every edition prints its own pass and observation count as-of date, week count and observation count.

Sources. The online grocery storefronts of Tesco, Asda, Sainsbury's, Morrisons, Aldi and Lidl. Where a retailer's online range differs from its store range, or covers only part of its estate, that is recorded and stated. Store-varying fields — availability, and any store-specific price the site exposes — are collected against 12 postcodes spanning London, a northern metropolitan area, a Midlands city, a Scottish city, a smaller market town and a rural area. National price fields are collected once per retailer per pass.

The frozen basket — the core discipline of this series. 75 items, defined once, versioned, and not changed between editions except by a documented version bump. A monthly series whose basket quietly changes is not a series: month-on-month movement would then be partly an artefact of redefinition, and the report would be worthless. The rules:

  • The definition lives in a single versioned file, basket-uk-v{n}.csv, with a version number, effective-from date and a changelog entry for every change.
  • Each line specifies category, tier (branded, own_label_value, own_label_standard, own_label_premium), brand or own-label line, variant, net quantity and unit, and a per-retailer match key.
  • No line is added, removed or respecified mid-series. Where an item is permanently delisted at a retailer, the line stays and that retailer's cell becomes delisted — never substituted, because substitution silently changes the basket.
  • When a bump is unavoidable — a line discontinued nationally, a pack-size change across all retailers — the report publishes both series in parallel for at least three editions so readers can see the join, with the changelog stating what changed and why.
  • The definition is published in full every edition, with its version number on the cover.

Monthly build sequence — the operational runbook, identical every month. Weeks 1–4, fixed weekday and window: weekly pass across all six retailers and all basket lines for national fields, plus the postcode pass for store-varying fields. After each pass: automated validation of line coverage per retailer, match-type distribution, unit-price field presence, and price-change outlier flags, with any item moving beyond a set week-on-week threshold queued for human review before entering the series. End of month, days 1–2: aggregate the four or five passes into the edition; monthly basket cost is the mean of weekly basket costs, with weekly values also published so within-month movement is visible. Days 2–3: compute month-on-month against the prior edition on the same basket version only — if the version changed, suppress the MoM figure for affected lines and use the parallel-series presentation. Day 3: regenerate figures, fill slots, update changelog, set as-of date. Day 4: review against the pre-publish checklist, refresh the landing page in place, send the edition email.

Matching. Branded lines match on brand, variant and net quantity, human-verified at basket definition and re-audited at each bump. Own-label lines match on category, variant, net quantity and tier, and are explicitly category equivalents. Where a retailer carries only a different pack size of a branded line, the observation records size_variant and is compared only on published unit price, never pack price. Multipacks and promotional bundles are excluded from basket totals and counted separately.

Loyalty price as a distinct captured price. Clubcard and Nectar prices sit in their own fields with their own flag. Basket cost publishes twice — standard basis and loyalty basis — and the two are never blended into one headline. Where a retailer runs no loyalty price, its loyalty basket equals its standard basket and the report says so explicitly rather than letting readers assume. The loyalty gap is a first-class finding, because the share of a basket that is loyalty-gated is among the most commercially significant things this series observes.

Data schema

Field Type Description Example format
observation_id string (UUID) One item-retailer-pass observation 9d4f…
collected_at timestamp (UK local, ISO 8601) Collection time with offset 2026-10-07T09:30:00+01:00
collection_week / edition_month string / string ISO week of pass; edition it belongs to 2026-W41 / 2026-10
basket_version string Frozen basket version in force uk-v4
retailer enum tesco, asda, sainsburys, morrisons, aldi, lidl sainsburys
basket_item_id string Frozen basket line identifier BAKERY-BREAD-WHITE-800G-OLS
category string Basket category Bakery
tier enum branded, own_label_value, own_label_standard, own_label_premium own_label_standard
brand string (nullable) Brand or own-label line as listed Sainsbury's
variant string Variant per basket definition White sliced, medium
net_quantity_value / net_quantity_unit decimal / enum Net quantity and unit (g, kg, ml, l, each, pack) 800 / g
match_type enum exact, size_variant, category_equivalent, excluded_multipack, delisted, not_listed exact
standard_price_gbp decimal Price displayed to any shopper 1.40
loyalty_price_gbp decimal (nullable) Clubcard or Nectar price where displayed 1.10
loyalty_scheme enum (nullable) clubcard, nectar, none nectar
was_price_gbp decimal (nullable) Reference "was" price where displayed 1.75
published_unit_price_gbp decimal (nullable) Price per unit exactly as published 0.175
published_unit_basis string (nullable) Unit basis exactly as published per 100g
promo_mechanic enum (nullable) price_cut, was_now, multibuy, bogof, meal_deal, loyalty_price, clearance, other multibuy
promo_text_raw string (nullable) Promotional wording verbatim Any 2 for one fixed price
availability_status enum available, unavailable, limited, not_listed available
postcode string (nullable) Postcode district for store-varying fields M20
field_scope enum national, postcode_specific national
observation_status enum ok, partial, failed ok

Report sections

This month in one page. Standing opener, same shape every edition: basket cost on both bases, month-on-month movement, and the month's one structural finding.

Figure 1 — Basket cost by retailer, standard and loyalty basis. Grouped bars; x = retailer, y = basket cost, series = standard vs loyalty basis. Items × one measure across two series → bars. Matched-line count on the figure.

Figure 2 — Basket cost series over time. Line; x = edition month, y = basket cost, series = retailer. Level over time → line. The series is the point of this report, so this carries the full history available at the same basket version, with any version join marked on the axis.

Figure 3 — Month-on-month movement. Horizontal bars; x = change in basket cost, y = retailer. One measure across six items → bars. Suppressed for lines affected by a version change, with the suppression stated.

Figure 4 — Within-month weekly movement. Line; x = collection week, y = basket cost, series = retailer.

Figure 5 — Loyalty-price gap. Point plus whisker; x = retailer running a scheme, y = gap between standard and loyalty price, point = median, whisker = interquartile range. A distribution.

Figure 6 — Share of the basket that is loyalty-gated. Stacked bars; x = retailer, y = share of basket lines, segments = loyalty price shown / standard only / other promotion / unavailable. Parts of a whole that sum → stacked.

Figure 7 — Unit-price comparison, selected categories. Horizontal bars; x = published price per unit, y = basket line, series = retailer. Uses retailers' own published fields with the basis printed, stating where a retailer published none.

Figure 8 — Own-label versus branded gap. Grouped bars; x = category, y = own-label price as % of matched branded line, series = retailer. Category-and-tier-equivalent caveat on the figure.

Figure 9 — Own-label tier ladder. Grouped bars; x = retailer, y = price per unit, series = tier including branded. Shows each retailer's internal price architecture.

Figure 10 — Promotional mechanics prevalence. Stacked bars; x = retailer, y = share of basket lines on promotion, segments = mechanic. Parts of a whole → stacked.

Figure 11 — Availability rate. Grouped bars; x = category, y = availability rate, series = retailer.

The discounter comparison. Aldi and Lidl against the big four on a stated matched-line subset, with the coverage constraint given explicitly rather than buried.

Basket integrity note. Standing section: version in force, changes since last edition, delisted lines by retailer, excluded lines, and the matched-line count behind every basket figure.

How to use this. The loyalty gap as a commercial signal; using published unit price rather than pack price for cross-retailer benchmarks; why month-on-month is only valid within one basket version.

Methodology and limitations.

Appendices. A: full basket definition, version basket version in force. B: postcode sample. C: match-type counts, delisted lines, collection success rates. D: basket changelog, all versions.

Data slots

Slot marker What produces it
basket cost by retailer, standard basis Sum of standard prices over matched lines
basket cost by retailer, loyalty basis Loyalty price where present, else standard
matched line count by retailer match_type counts
monthly basket cost series by retailer, current version Historical edition table
month-on-month change by retailer, £ and % Current vs prior edition, same version
weekly basket cost by retailer, current month Weekly aggregation
loyalty gap distribution by retailer — median and IQR Standard vs loyalty price per line
share of basket lines with a loyalty price, by retailer Non-null loyalty share
basket cost difference between bases, by retailer Standard minus loyalty basket
published unit price by retailer, selected lines Published unit-price field
share of lines with no published unit price, by retailer Null rate
own-label price as % of branded, by retailer × category Paired tier lines
price per unit by retailer × tier Tier ladder aggregation
promotional mechanic mix by retailer promo_mechanic distribution
share of basket lines on promotion by retailer Promo incidence
availability rate by retailer, and by retailer × category availability_status
delisted and not-listed line counts by retailer match_type
discounter matched-line subset size Common lines across all six
basket version in force and effective-from date Basket registry
basket changes since last edition, if any Changelog
as-of date, week count and observation count Run metadata

Methodology and limitations

Sampling limits. Six retailers, one 75-item basket, online storefronts, four or five weekly passes a month, and 12 postcodes for store-varying fields. A defined sample, not a census: retailers list tens of thousands of lines and our basket is a fixed window onto a small part of that. Figures read as "for our basket" throughout.

Not an inflation measure. Our basket is unweighted by consumption and self-selected. Movement in our basket cost is movement in our basket cost. It is not CPI and not a national grocery inflation rate, and the report states this on the page where the month-on-month figure appears, not only here.

Online versus in-store. We observe online prices, which are not guaranteed identical to shelf prices at any retailer, and the discounters' online ranges are narrower than their store ranges. Where that constrains a comparison, the constraint prints beside the figure with the matched-line count.

Loyalty prices. Captured as displayed on the site. We do not verify redemption, do not assume enrolment, and never blend loyalty and standard prices into one basket. A loyalty-basis basket is the cost to a shopper who is enrolled and for whom every displayed loyalty price applies — an upper bound on the benefit, not a typical outcome.

Own-label comparison. Own-label lines across retailers are different products with different formulations and often different pack sizes. Tier assignment uses the retailer's own range naming where it supports one and is marked unknown where it does not. These are category-and-tier equivalents, labelled on every figure, and must not be quoted as like-for-like.

Published unit price. We use the retailer's own published per-unit field rather than recomputing, because recomputation would hide inconsistencies in how retailers define the unit and would stop our figure matching what the shopper sees. The cost is that bases differ between retailers and some lines publish nothing; we normalise the basis for charting, print the original, and publish the null rate.

Basket integrity. The largest risk to a monthly series is silent basket drift. Controls: a versioned definition file, a changelog, no mid-series substitution, delisted rather than replacement, suppression of month-on-month across a version boundary, and parallel publication of both baskets for at least three editions at any bump. Every basket figure prints its matched-line count so no reader compares baskets of different sizes.

Outlier control. Any week-on-week item move beyond a set threshold is flagged and human-reviewed before entering the series, catching page-structure changes and mis-parses. Reviewed-and-rejected observations are excluded and counted, not silently dropped.

Observed versus inferred. Standard price, loyalty price, was-price, published unit price and basis, promotional wording, availability and pack size are observed. Basket costs, month-on-month movement, loyalty gaps, tier gaps, mechanic prevalence and availability rates are derived by stated arithmetic. Tier assignment is a judgement, flagged as such. Nothing is modelled or estimated, and no share, sales or inflation figure appears.

Missing data. Failed passes are reported, never interpolated. A month with fewer than four usable passes for a retailer publishes its pass count and flags its month-on-month figure as low-confidence.

Social Proof That Converts

Trusted by Global Leaders Across Q-Commerce, Travel, Retail, and FoodTech

Our web scraping expertise is relied on by 4,000+ global enterprises including Zomato, Tata Consumer, Subway, and Expedia — helping them turn web data into growth.

4,000+ Enterprises Worldwide
50+ Countries Served
20+ Industries
Join 4,000+ companies growing with Actowiz →
Real Results from Real Clients

Hear It Directly from Our Clients

Watch how businesses like yours are using Actowiz data to drive growth.

▶
1 min
★★★★★
"Actowiz Solutions offered exceptional support with transparency and guidance throughout. Anna and Saga made the process easy for a non-technical user like me. Great service, fair pricing!"
TG
Thomas Galido
Co-Founder / Head of Product at Upright Data Inc.
▶
2 min
★★★★★
"Actowiz delivered impeccable results for our company. Their team ensured data accuracy and on-time delivery. The competitive intelligence completely transformed our pricing strategy."
II
Iulen Ibanez
CEO / Datacy.es
▶
1:30
★★★★★
"What impressed me most was the speed — we went from requirement to production data in under 48 hours. The API integration was seamless and the support team is always responsive."
FC
Febbin Chacko
-Fin, Small Business Owner
icons 4.8/5 Average Rating
icons 50+ Video Testimonials
icons 92% Client Retention
icons 50+ Countries Served

Join 4,000+ Companies Growing with Actowiz

From Zomato to Expedia — see why global leaders trust us with their data.

Why Global Leaders Trust Actowiz

Backed by automation, data volume, and enterprise-grade scale — we help businesses from startups to Fortune 500s extract competitive insights across the USA, UK, UAE, and beyond.

icons
7+
Years of Experience
Proven track record delivering enterprise-grade web scraping and data intelligence solutions.
icons
4,000+
Projects Delivered
Serving startups to Fortune 500 companies across 50+ countries worldwide.
icons
200+
In-House Experts
Dedicated engineers across scrapers, AI/ML models, APIs, and data quality assurance.
icons
9.2M
Automated Workflows
Running weekly across eCommerce, Quick Commerce, Travel, Real Estate, and Food industries.
icons
270+ TB
Data Transferred
Real-time and batch data scraping at massive scale, across industries globally.
icons
380M+
Pages Crawled Weekly
Scaled infrastructure for comprehensive global data coverage with 99% accuracy.

AI Solutions Engineered
for Your Needs

→
LLM-Powered Attribute Extraction: High-precision product matching using large language models for accurate data classification.
→
Advanced Computer Vision: Fine-grained object detection for precise product classification using text and image embeddings.
→
GPT-Based Analytics Layer: Natural language query-based reporting and visualization for business intelligence.
→
Human-in-the-Loop AI: Continuous feedback loop to improve AI model accuracy over time.
icons Product Matching icons Attribute Tagging icons Content Optimization icons Sentiment Analysis icons Prompt-Based Reporting

Connect the Dots Across
Your Retail Ecosystem

We partner with agencies, system integrators, and technology platforms to deliver end-to-end solutions across the retail and digital shelf ecosystem.

icons
Analytics Services
icons
Ad Tech
icons
Price Optimization
icons
Business Consulting
icons
System Integration
icons
Market Research
Become a Partner →

Popular Datasets — Ready to Download

Browse All Datasets →
icons
Amazon
eCommerce
Free 100 rows
icons
Zillow
Real Estate
Free 100 rows
icons
DoorDash
Food Delivery
Free 100 rows
icons
Walmart
Retail
Free 100 rows
icons
Booking.com
Travel
Free 100 rows
icons
Indeed
Jobs
Free 100 rows

Latest Insights & Resources

View All Resources →
thumb
Blog

Promo & Coupon Data API 2026 - How Consumer Brands Improve Discount Strategies and Compliance Tracking

Promo & Coupon Data API 2026: Help Consumer Brands Track Discounts, Analyze Promotions, Optimize Pricing, and Strengthen Compliance Tracking

thumb
Case Study

How a Leading Brand Built a Smarter Car Marketplace with Japan Used-Car Pricing API for an East African Market

Japan Used-Car Pricing API for an East African market helps car marketplaces access accurate pricing data, compare vehicles, and make smarter decisions.

thumb
Report

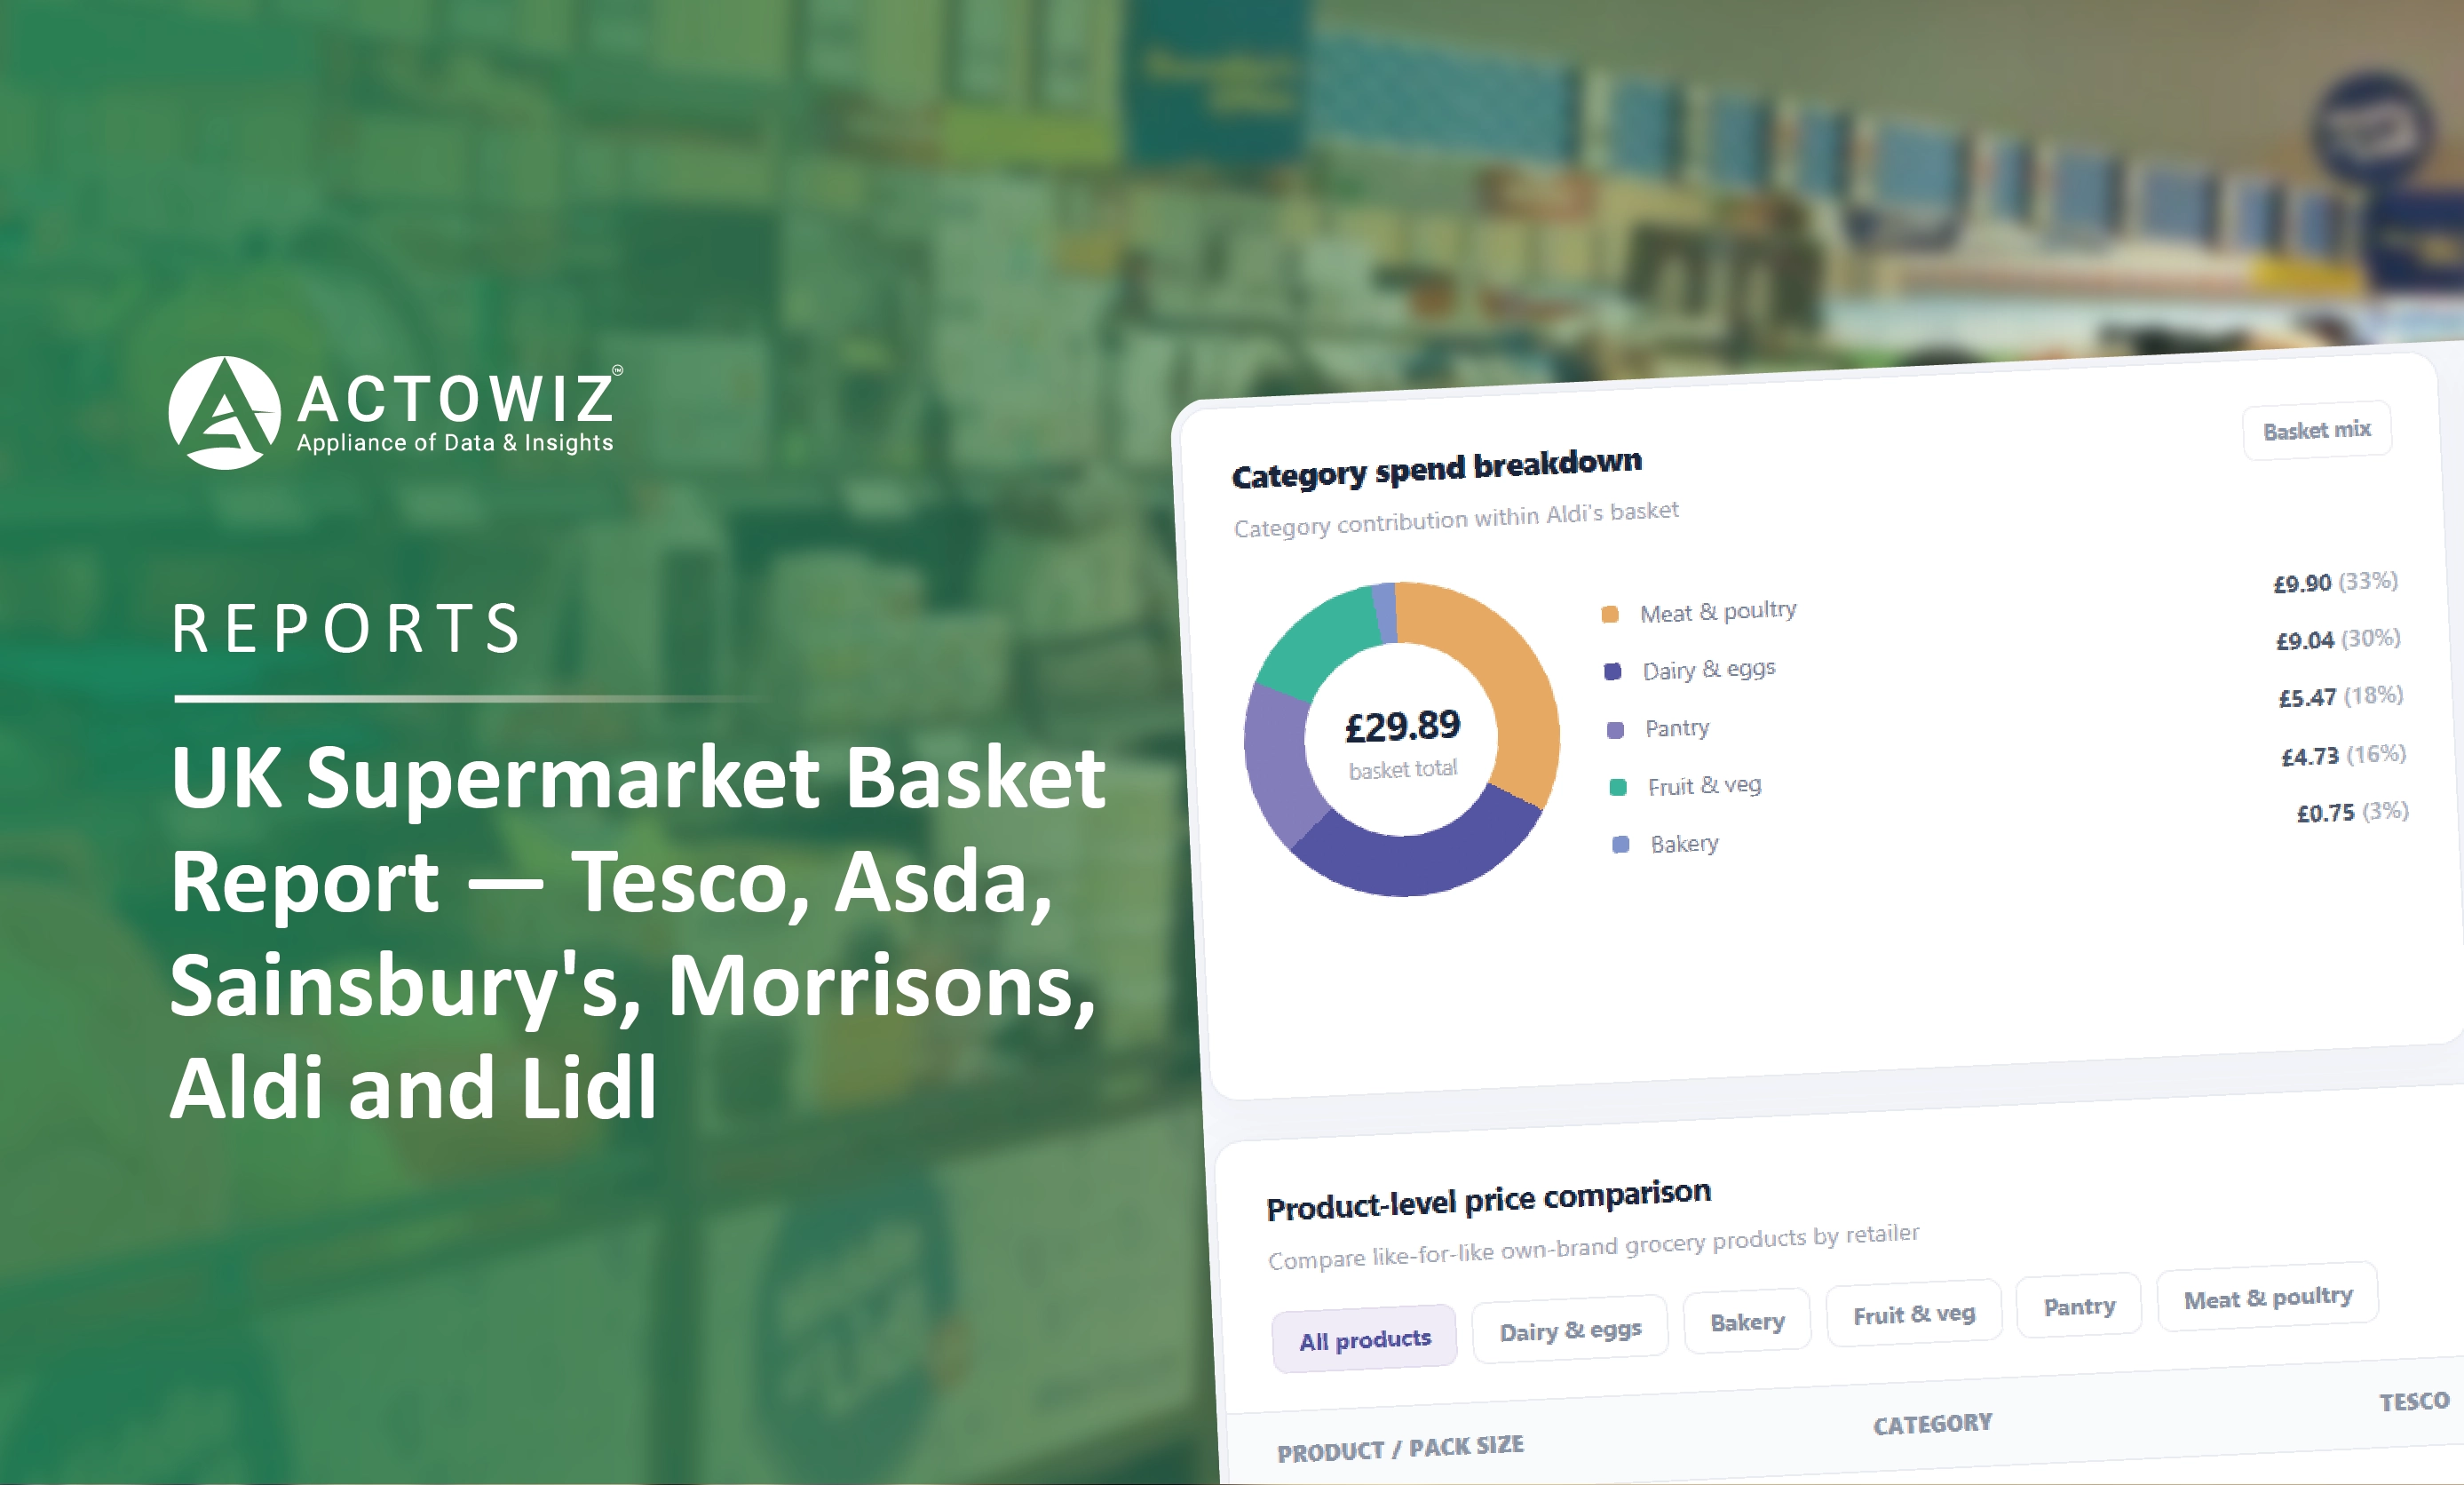
UK Supermarket Basket Report — Tesco, Asda, Sainsbury's, Morrisons, Aldi and Lidl

Explore UK supermarket basket prices across Tesco, Asda, Sainsbury's, Morrisons, Aldi, and Lidl. Compare grocery prices, product ranges, promotions, and retailer pricing trends.

Start Where It Makes Sense for You

Whether you're a startup or a Fortune 500 — we have the right plan for your data needs.

icons
Enterprise
Book a Strategy Call
Custom solutions, dedicated support, volume pricing for large-scale needs.
icons
Growing Brand
Get Free Sample Data
Try before you buy — 500 rows of real data, delivered in 2 hours. No strings.
icons
Just Exploring
View Plans & Pricing
Transparent plans from $500/mo. Find the right fit for your budget and scale.

Request Free Sample Data

Our team will reach out within 2 hours with 500 rows of real data — no credit card required.

+1 ▼
✓ Free 500-row sample · No credit card · Response within 2 hours