🎃 HALLOWEEN OFF Spooky Savings Event! Get FLAT 20% OFF on all Web Scraping & Data Extraction Plans 20% OFF Web Scraping Plans!
Ends in: 00d : 00h : 00m : 00s
🦇
👻
🎃 Spooktacular Limited Offer

Don’t Let High Data Costs Haunt You! 🎃

Get FLAT 20% OFF

T&C Apply

Scrape competitor prices, monitor MAP, and extract real-time datasets at a spooky discount this Halloween.

Offer Expires In:
00d : 00h : 00m : 00s
⚡ Claim 20% Discount Now
🎃
Promo Code Copied!
SPOOKY30 (20% OFF Applied)
Core services
Enterprise Data Extraction

Scalable web, app and AI-powered collection across 40+ countries.

All 58 services →
New 2026
AI Training Data

Corpus building with provenance and opt-out compliance.

Learn more →
Free pilot
24-hour sample

We run collection on your own sources before you commit.

Get a sample →
58Services
40+Countries
DEVELOPER

Ready-Made Scrapers

Pre-built for top platforms. Self-serve, no setup.

View All →
TRY FREE

API Playground

Test endpoints instantly. No credit card.

Start Free →
28Tools
2SDKs
icons Delivery & SDKs
Streaming Crawl API Scheduler Realtime Alerts Webhook Delivery 🐍 Python SDK 💚 Node.js SDK
Need it managed instead?

Fixed monthly retainer, named engineer, no per-request metering.

Managed Data API →
HOT

Case Studies

How brands use Actowiz, with named outcomes.

Read →
FREE

Sample Datasets

Real output, no signup.

Download →
NEW

ROI Calculator

Model the return on a data engagement.

Calculate →
Crex Data Scraping - Solving Accuracy and Data Consistency Issues in Cricket Analytics

Introduction

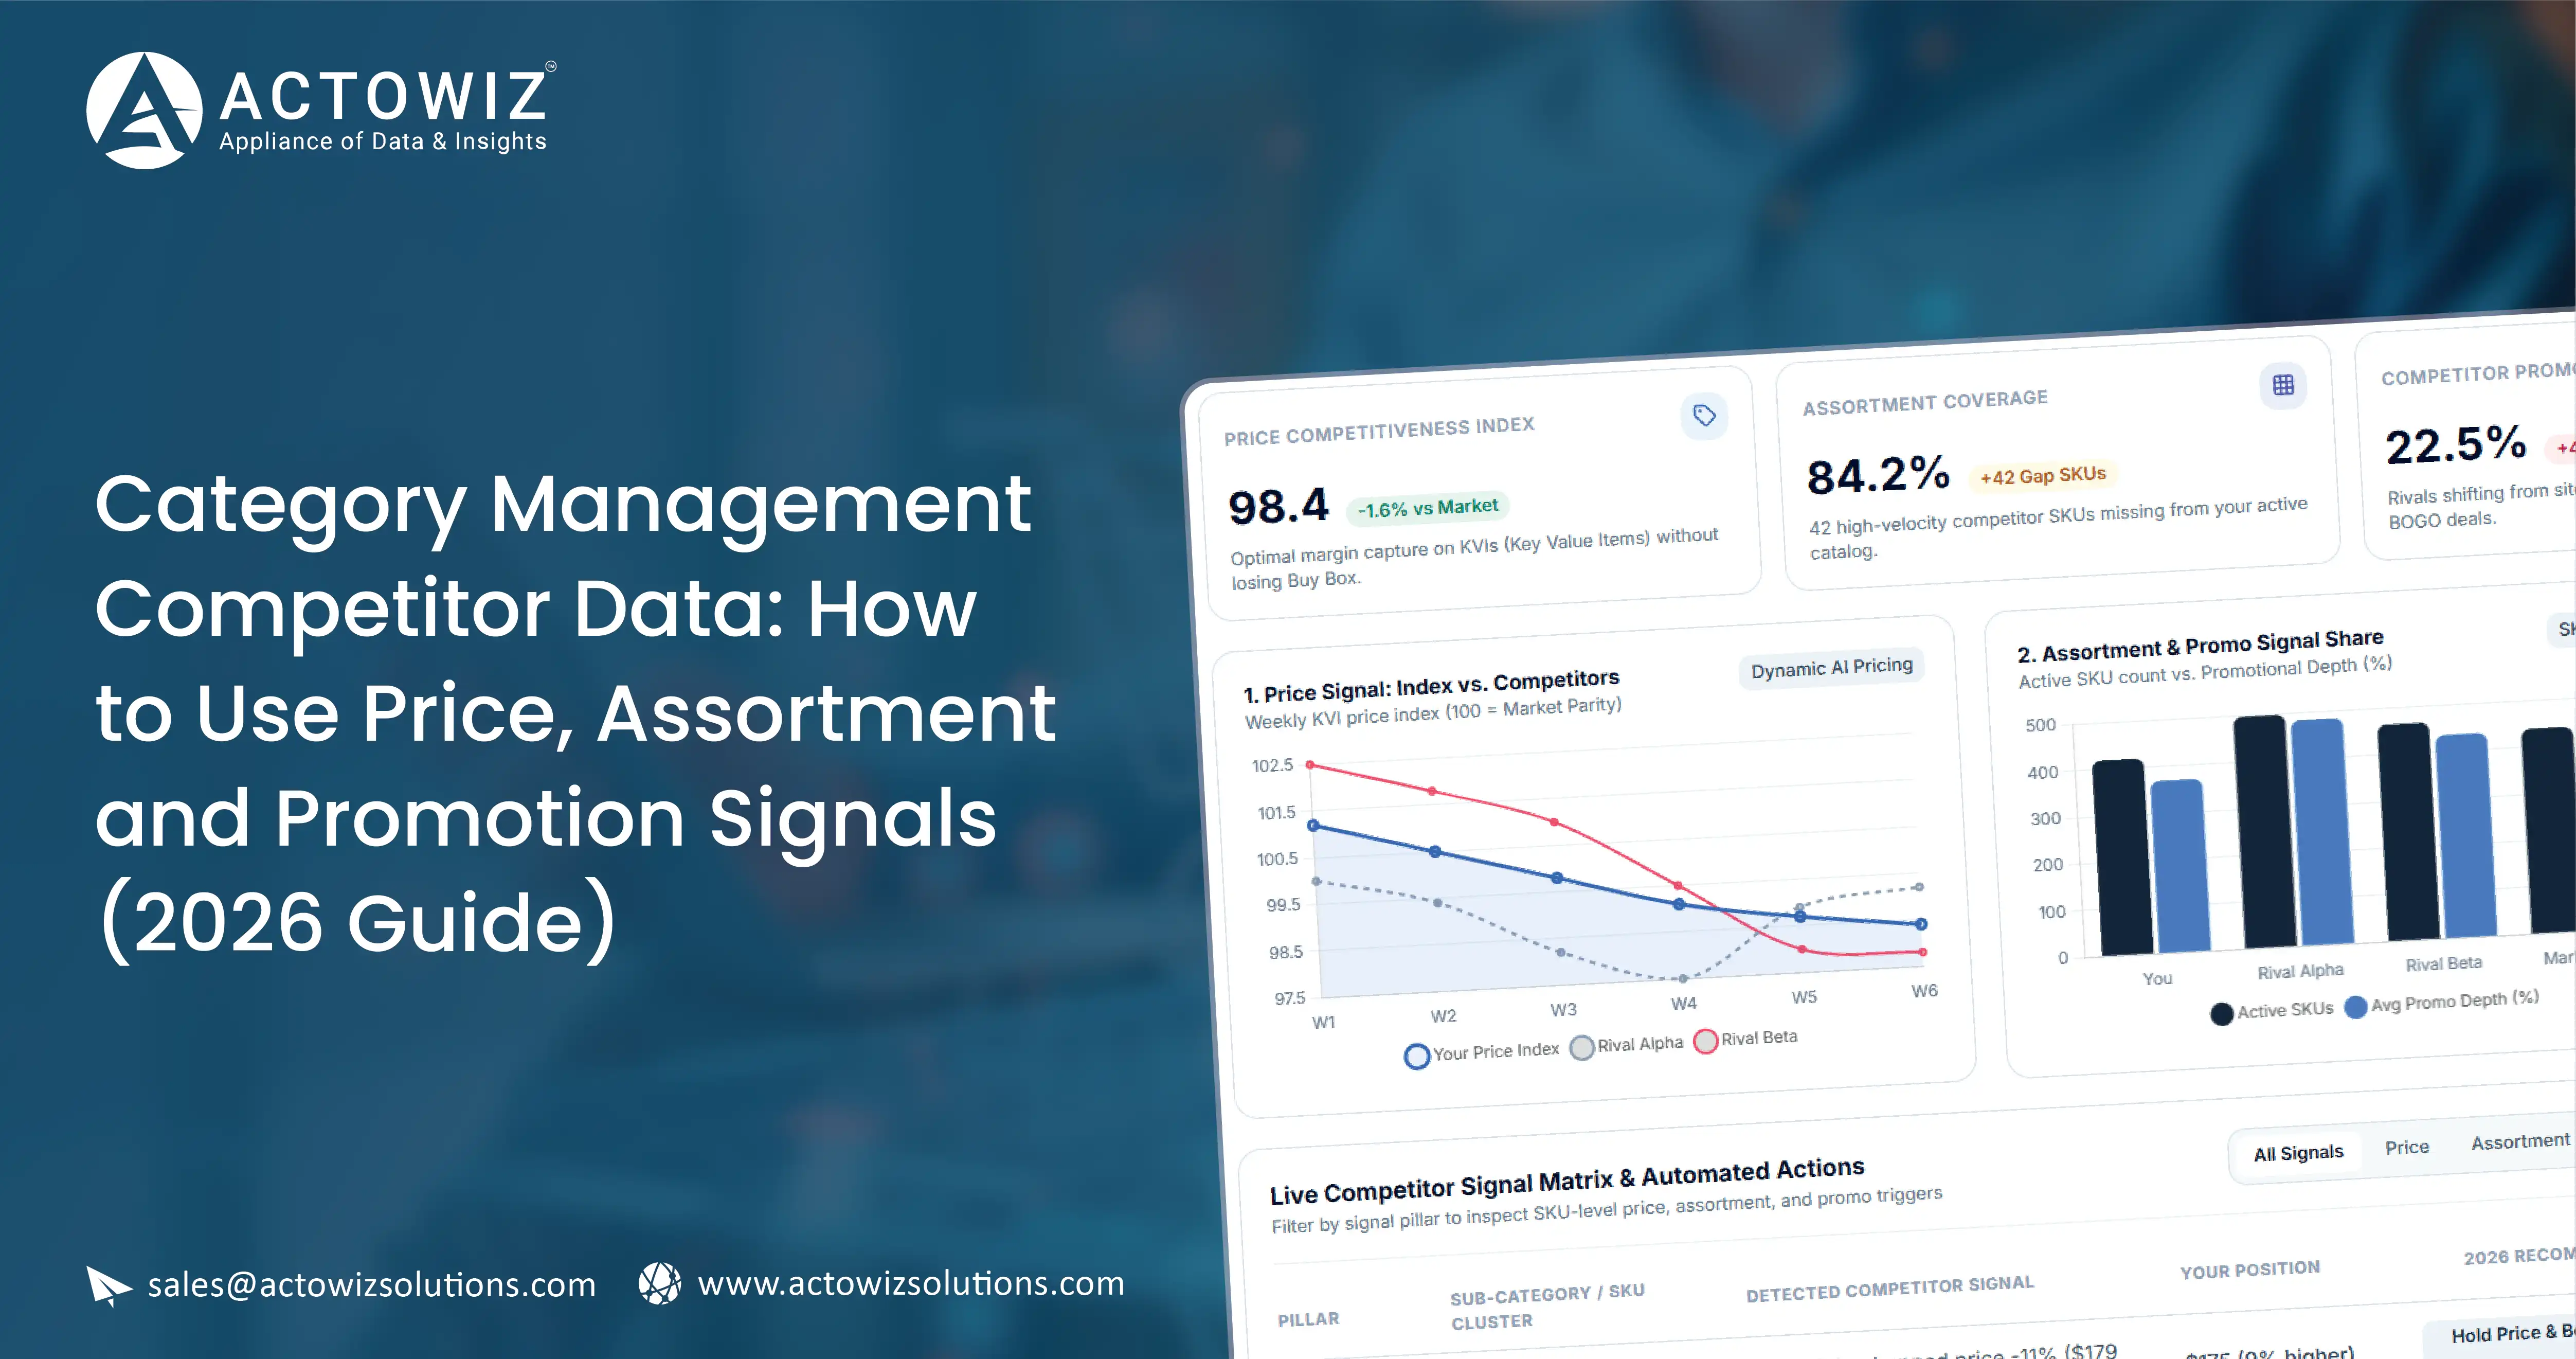
Category management competitor data is the structured, repeatable record of what rival retailers and brands list, charge and promote in your category. It sits next to your own sales and shopper data. Together they explain why a category is winning or losing.

In short: category management competitor data covers four signals – assortment, price, promotion and share of shelf. Category managers use it to find range gaps, set price ladders, plan promo calendars and defend visibility. The value comes from matching products across retailers, refreshing at the right cadence and tying each signal to a named category decision. Our complete e-commerce competitor intelligence guide covers the wider programme this data feeds.

This guide is written for category managers, key account managers (KAMs) and revenue-growth teams at brands and retailers. It explains which competitor signals matter, how to turn them into range, price and promo decisions, and how often to refresh data in each category.

Why does competitor data matter in category management?

NielsenIQ describes category management as a shared process between retailers and manufacturers to manage categories as strategic business units, built around value for the shopper (Source: https://nielseniq.com/global/en/insights/analysis/2024/exploring-category-management-processes-steps-and-business-benefits-for-a-win-win-win-approach/). Its eight-step model includes assessing the category with data and applying tactics across product, placement, price and promotion.

Internal data shows what happened in your own stores or on your own listings. It cannot show what shoppers saw elsewhere on the same day. Competitor data fills that gap. It tells you whether a sales dip came from a rival's new pack, a deeper discount or a stock-out you did not cause.

Who uses it day to day:

  • Retail category managers. Range reviews, opening price points, own-label gaps and promo slot planning.
  • Brand KAMs. Building a fact base for joint business plans and showing a retailer where the category leaks to rivals.
  • Revenue-growth management (RGM) teams. Price-pack architecture, promo depth and frequency, and mix decisions.
  • E-commerce and digital shelf teams. Search visibility, content quality and availability on marketplaces and retailer sites.

What competitor signals should category managers track?

Most teams start with price alone. Price is a lagging signal, so it rarely explains a share shift on its own. The four signals below give a fuller view of the category.

Signal What it tells you Core fields to collect
Assortment Which products, brands, pack sizes and variants rivals list – and what is new or delisted product_id, gtin, brand, sub_category, pack_size, variant, first_seen, last_seen
Price Where each item sits in the market and how fast prices move list_price, selling_price, unit_price, currency, price_type, captured_at
Promotion Who discounts, how deep, how often and with what mechanic promo_flag, promo_mechanic, discount_pct, promo_start, promo_end, badge_text
Share of shelf How visible each brand is on category pages and in search keyword, position, is_sponsored, page_rank, brand, listing_count
Availability (support signal) Whether a rival could actually sell during your promo or price change stock_status, delivery_promise, seller, location

How do you run an assortment gap analysis with competitor data?

An assortment gap analysis compares your range with rival ranges at the level shoppers choose – need state, pack size and price tier. Counting SKUs is not enough. You need matched products and a shared category tree. Our assortment gap and new launch radar dashboard is built for this analysis.

  • Define the comparison set. Pick 3–6 rivals per channel: the retailers or brands your shoppers actually switch to.
  • Map every listing to your category tree. Use your own sub-categories and attributes (format, size, flavour, claim) so the comparison is like-for-like.
  • Match identical and equivalent products. Use GTIN/EAN where shown; fall back to brand + name + size matching, then human review for edge cases.
  • Build the gap matrix. Rows are attribute combinations (for example, 'plant-based, 500 g, premium'); columns are retailers. Mark covered, missing or over-represented cells.
  • Add depth and freshness. Count options per cell and flag items first seen in the last 30–90 days. New-launch clusters often point to the next growth segment.
  • Score the gaps. Weight each gap by search demand, rival ratings and price tier, then shortlist the few worth testing.

Two common mistakes: treating a missing page as a delisting (it may be a temporary stock-out), and comparing URL counts instead of unique products.

How do you build a price ladder from competitor prices?

A price ladder shows how products step up from entry to premium within a category. Competitor data lets you see the full market ladder, not just your own shelf.

  • Normalise to a unit price. Compare per 100 g, per litre, per wash or per serving. Pack size changes hide real price moves.
  • Set the tiers from the market. Group matched items into entry, mainstream, premium and super-premium bands using unit-price ranges seen across rivals.
  • Check the gaps between steps. Large jumps between tiers leave room for a new pack or a private-label item. Crowded tiers signal price pressure.
  • Separate regular and promo prices. Build the ladder on regular (non-promo) prices, then overlay promo prices to see how often tiers collapse.
  • Track index, not just price. A price index (your price ÷ matched rival price × 100) is easier to brief to retail buyers than a list of numbers. Our competitor price monitoring services provide this feed.
Ladder tier (illustrative) Unit-price band Typical role in the category What to watch in competitor data
Entry No Data Traffic and trial; often private label New entry SKUs, opening-price promos
Mainstream No Data Volume core Pack-size changes, multi-buy offers
Premium No Data Margin and trade-up New claims (organic, high-protein), launch pricing
Super-premium No Data Image and niche demand Listing breadth, rating trends

How do you read competitor promotions and build a promo calendar?

Promotions are expensive. A Nielsen analysis of US retail, reported in 2014, found that almost three-quarters of CPG promotions did not break even (Source: https://www.foodnavigator.com/Article/2014/10/09/Three-quarters-of-CPG-promotions-don-t-break-even-Nielsen/). In a 2023 review, Circana noted that consumer promotional lifts in non-edible CPG remained 25% below historical levels (Source: https://www.circana.com/post/the-shrinking-impact-of-promotions). Both points suggest promos need tighter planning, and competitor timing is a big part of that.

A competitor promo calendar records every observed promotion by week, retailer, brand and mechanic. After 6–12 months it shows patterns you can plan around:

  • Depth. Typical discount bands by brand and tier, and how often a rival goes deeper than usual.
  • Frequency. How many weeks a year each rival is on promotion and whether it rotates retailers.
  • Mechanic. Price cut, multi-buy, bundle, coupon, loyalty-only price or bank offer – each competes differently.
  • Timing. Seasonal peaks, payday cycles and marketplace sale events that cluster discounts.
  • Clashes. Weeks where your planned promo overlaps a rival's deep cut in the same tier.

Always store the promo mechanic and the badge text exactly as shown. A single 'on promo' flag loses most of the value. Our promotion and coupon scraping tools capture these fields.

How do you measure share of shelf on the digital shelf?

Online, share of shelf means how often and how high a brand appears on category pages and in search results for the terms shoppers use. It is the digital version of facings.

  • Pick the keyword set. Mix generic category terms, need-state terms and rival brand terms – usually 20–200 per category.
  • Capture positions, not just presence. Record rank, page and whether each result is sponsored or organic.
  • Weight by position. Page-one, top-ten results count far more than page three.
  • Split by retailer and location. Results differ by marketplace, store and sometimes postcode.
  • Compare with sales. A brand losing organic share of shelf often loses sales a few weeks later.

From data signal to category decision

Competitor data is only useful when each signal has an owner and a planned response. The table maps common signals to category decisions.

Data signal observed What it may mean Category decision to review Typical owner
Rival lists 5+ new SKUs in one sub-segment within 60 days A segment is being built out Range review: test a matching or differentiated item Category manager
Your unit price sits well above matched rivals in the mainstream tier Price-ladder drift Re-tier price, change pack size or add a value pack RGM / pricing
Rival discounts the same tier in the weeks before your planned promo Promo clash risk Move the slot, change mechanic or deepen only on hero SKUs KAM / trade marketing
Your organic search rank falls on core category terms Visibility loss Fix content, review sponsored spend, check availability E-commerce
Rival goes out of stock across several retailers Short-term demand shift Protect availability; avoid unnecessary discounting Supply chain / KAM
Rival ratings drop on a key SKU Quality or value issue Use in buyer meetings; check own reviews for the same theme Brand / insights

Treat each signal as a hypothesis to test with your own sales data, not as proof of a rival's strategy.

How often should you refresh competitor data by category?

Refresh cadence for category management competitor data should follow how fast a category moves. Collecting hourly data for slow categories wastes budget; weekly data for fast categories misses most events. For a marketplace-specific view, see our guide on tracking prices and assortment on Flipkart, Amazon and Meesho.

Category type Price & promo Assortment Share of shelf / search Reviews & ratings
Fresh, dairy, quick-commerce staples Daily (key SKUs several times a day) Weekly Daily Weekly
Packaged food & beverages Daily to 3× weekly Weekly 2–3× weekly Weekly
Health, beauty & personal care Daily Weekly Daily on core terms Weekly
Consumer electronics & appliances Several times a day in sale periods; daily otherwise Weekly Daily Weekly
Home, furniture & DIY 2–3× weekly Fortnightly Weekly Fortnightly
Apparel & footwear Daily in season and sale weeks Weekly (new drops) 2–3× weekly Weekly

Increase cadence for 2–4 weeks around major sale events, launches and range reviews, then step back down.

How do you collect, match and clean competitor data?

  • Collect from public pages only. Category pages, product pages and search results that any shopper can see, without logins.
  • Capture context with every price. Location or store, seller, stock state, timestamp and the promo text shown.
  • Match products. GTIN/EAN first; then brand, name, size and variant rules; then manual review for low-confidence pairs.
  • Normalise. Convert units, currencies and pack sizes; split multipacks; standardise brand names.
  • Quality-check. Flag price outliers, sudden listing drops and missing fields before data reaches dashboards.
  • Deliver where teams work. CSV/Excel for range reviews, APIs or warehouse loads (for example, BigQuery or Snowflake) for BI dashboards.

Is collecting competitor data legal?

Collecting publicly visible product, price and promotion information is common practice, but rules vary by country and by site. Good practice is to collect only public business data, avoid personal data, avoid login-protected areas, respect site terms and rate limits, and take legal advice for your markets. Use the data for internal analysis and avoid sharing pricing intent with competitors.

Should you build or buy competitor data for category management?

Factor Build in-house Use a managed data provider
Time to first data Weeks to months Usually days to a few weeks for a sample
Maintenance Your team fixes scrapers when sites change Provider maintains collection and QA
Product matching Needs custom rules and review effort Often included as a service
Scale across retailers & countries Hard to grow quickly Easier to add sources
Control Full control of logic Defined by the agreed field list and SLAs

Many teams start with a managed category management competitor data feed for 3–5 retailers and one category, prove the decisions it supports, then expand.

Related Actowiz resources: complete e-commerce competitor intelligence guide, assortment gap and new launch radar dashboard, competitor price monitoring services, promotion and coupon scraping tools and tracking prices and assortment on Flipkart, Amazon and Meesho.

Ready to turn competitor assortment, price, promotion and share of shelf into category decisions? Request a sample feed for your retailers and category.
Contact Us Today!

Frequently Asked Questions

What is category management competitor data?

It is structured data on rival assortment, prices, promotions, share of shelf and availability in a category, collected regularly from public retailer and marketplace pages. Category teams combine it with internal sales data to explain performance and plan range, price and promo decisions.

How is assortment gap analysis different from price monitoring?

Price monitoring tracks what matched products cost. Assortment gap analysis looks at which products, pack sizes and attribute combinations exist at each retailer, and which are missing from your range. Both need product matching, but they answer different questions.

What is a price ladder in category management?

A price ladder is the step-by-step structure of unit prices from entry to premium products in a category. Competitor data shows the full market ladder so you can spot crowded tiers, missing steps and price drift.

How many competitors should a category manager track?

Most teams start with 3–6 rivals per channel – the retailers or brands shoppers actually switch to – and 100–500 matched products per category. Expand once the core decisions are working.

How often should competitor promotions be tracked?

For fast-moving categories, daily tracking during normal weeks and more frequent checks during sale events is common. Slower categories can work with two or three checks a week.

Can competitor data prove why a rival changed price or range?

No. It shows what changed and when. Treat it as evidence for a hypothesis, then test that hypothesis against your own sales, shopper and supply data.

Conclusion

You can also reach us for all your mobile app scraping, data collection, web scraping , and instant data scraper service requirements!

Social Proof That Converts

Trusted by Global Leaders Across Q-Commerce, Travel, Retail, and FoodTech

Our web scraping expertise is relied on by 4,000+ global enterprises including Zomato, Tata Consumer, Subway, and Expedia — helping them turn web data into growth.

4,000+ Enterprises Worldwide
50+ Countries Served
20+ Industries
Join 4,000+ companies growing with Actowiz →
Real Results from Real Clients

Hear It Directly from Our Clients

Watch how businesses like yours are using Actowiz data to drive growth.

▶
1 min
★★★★★
"Actowiz Solutions offered exceptional support with transparency and guidance throughout. Anna and Saga made the process easy for a non-technical user like me. Great service, fair pricing!"
TG
Thomas Galido
Co-Founder / Head of Product at Upright Data Inc.
▶
2 min
★★★★★
"Actowiz delivered impeccable results for our company. Their team ensured data accuracy and on-time delivery. The competitive intelligence completely transformed our pricing strategy."
II
Iulen Ibanez
CEO / Datacy.es
▶
1:30
★★★★★
"What impressed me most was the speed — we went from requirement to production data in under 48 hours. The API integration was seamless and the support team is always responsive."
FC
Febbin Chacko
-Fin, Small Business Owner
icons 4.8/5 Average Rating
icons 50+ Video Testimonials
icons 92% Client Retention
icons 50+ Countries Served

Join 4,000+ Companies Growing with Actowiz

From Zomato to Expedia — see why global leaders trust us with their data.

Why Global Leaders Trust Actowiz

Backed by automation, data volume, and enterprise-grade scale — we help businesses from startups to Fortune 500s extract competitive insights across the USA, UK, UAE, and beyond.

icons
7+
Years of Experience
Proven track record delivering enterprise-grade web scraping and data intelligence solutions.
icons
4,000+
Projects Delivered
Serving startups to Fortune 500 companies across 50+ countries worldwide.
icons
200+
In-House Experts
Dedicated engineers across scrapers, AI/ML models, APIs, and data quality assurance.
icons
9.2M
Automated Workflows
Running weekly across eCommerce, Quick Commerce, Travel, Real Estate, and Food industries.
icons
270+ TB
Data Transferred
Real-time and batch data scraping at massive scale, across industries globally.
icons
380M+
Pages Crawled Weekly
Scaled infrastructure for comprehensive global data coverage with 99% accuracy.

AI Solutions Engineered
for Your Needs

→
LLM-Powered Attribute Extraction: High-precision product matching using large language models for accurate data classification.
→
Advanced Computer Vision: Fine-grained object detection for precise product classification using text and image embeddings.
→
GPT-Based Analytics Layer: Natural language query-based reporting and visualization for business intelligence.
→
Human-in-the-Loop AI: Continuous feedback loop to improve AI model accuracy over time.
icons Product Matching icons Attribute Tagging icons Content Optimization icons Sentiment Analysis icons Prompt-Based Reporting

Connect the Dots Across
Your Retail Ecosystem

We partner with agencies, system integrators, and technology platforms to deliver end-to-end solutions across the retail and digital shelf ecosystem.

icons
Analytics Services
icons
Ad Tech
icons
Price Optimization
icons
Business Consulting
icons
System Integration
icons
Market Research
Become a Partner →

Popular Datasets — Ready to Download

Browse All Datasets →
icons
Amazon
eCommerce
Free 100 rows
icons
Zillow
Real Estate
Free 100 rows
icons
DoorDash
Food Delivery
Free 100 rows
icons
Walmart
Retail
Free 100 rows
icons
Booking.com
Travel
Free 100 rows
icons
Indeed
Jobs
Free 100 rows

Latest Insights & Resources

View All Resources →
thumb
Blog

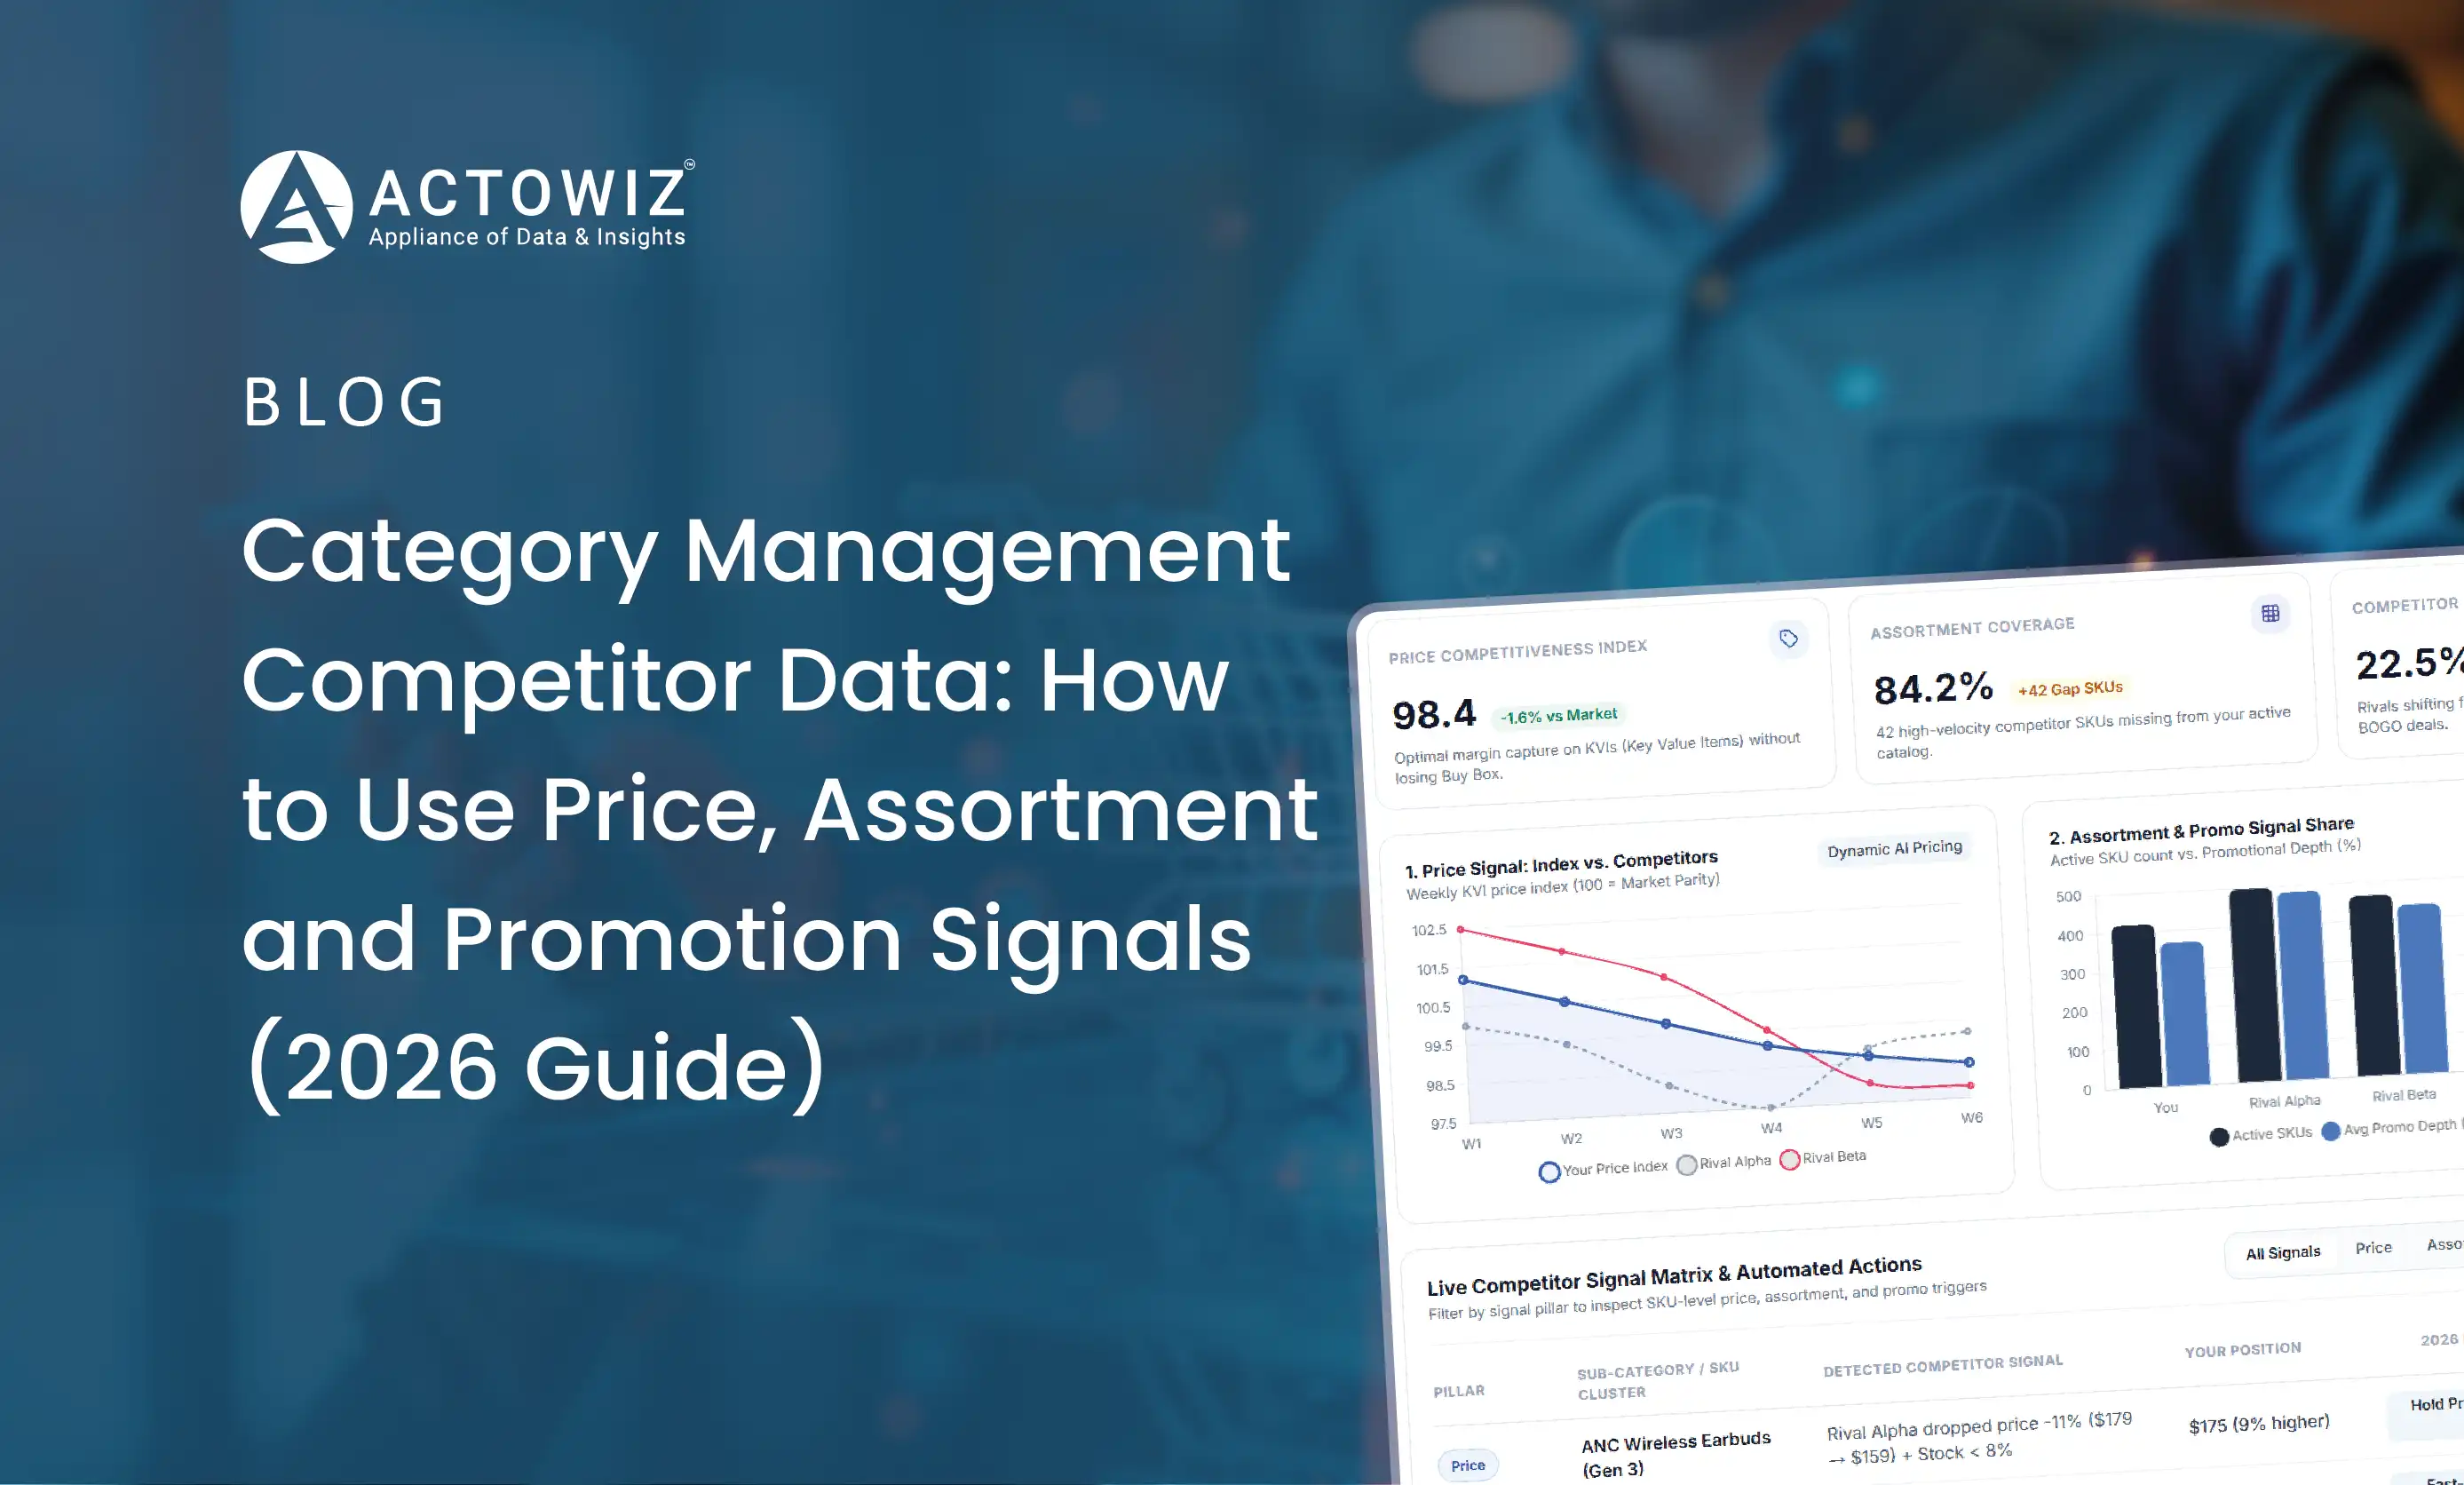
Category Management Competitor Data: How to Use Price, Assortment and Promotion Signals (2026 Guide)

Use category management competitor data to find assortment gaps, set price ladders, plan promo calendars and track share of shelf.

thumb
Case Study

How We Helped a Leading Food-Tech Brand Leverage Restaurant & Menu Data from RestaurantGuru UK for Smarter Market Analysis

Explore Restaurant & Menu Data from RestaurantGuru UK to analyze restaurant listings, menus, pricing, ratings, and dining trends.

thumb
Report

US Beverage Brands on Amazon & Walmart Market Data Report 2026 for Price Erosion and Pack-Price Intelligence

US beverage price data for 2026: energy drinks, sparkling water, sports drinks, RTD coffee/tea and functional sodas on Amazon and Walmart.

Start Where It Makes Sense for You

Whether you're a startup or a Fortune 500 — we have the right plan for your data needs.

icons
Enterprise
Book a Strategy Call
Custom solutions, dedicated support, volume pricing for large-scale needs.
icons
Growing Brand
Get Free Sample Data
Try before you buy — 500 rows of real data, delivered in 2 hours. No strings.
icons
Just Exploring
View Plans & Pricing
Transparent plans from $500/mo. Find the right fit for your budget and scale.
Get in Touch
Let's Talk About
Your Data Needs
Tell us what data you need — we'll scope it for free and share a sample within hours.
  • icons
    Free Sample in 2 HoursShare your requirement, get 500 rows of real data — no commitment.
  • icons
    Plans from $500/monthFlexible pricing for startups, growing brands, and enterprises.
  • icons
    US-Based SupportOffices in New York & California. Aligned with your timezone.
  • icons
    ISO 9001 & 27001 CertifiedEnterprise-grade security and quality standards.
Request Free Sample Data
Fill the form below — our team will reach out within 2 hours.
+1 ▼
✓ Free 500-row sample · No credit card · Response within 2 hours

Request Free Sample Data

Our team will reach out within 2 hours with 500 rows of real data — no credit card required.

+1 ▼
✓ Free 500-row sample · No credit card · Response within 2 hours