Introduction
The client was a patient-access platform. Their product did one thing: help a patient with a prescription in hand find the cheapest place to fill it, nearby, today. Simple promise. Brutal execution problem.
Because the retail pharmacy market in the United States has a property that almost no other consumer market has — the price of the identical product, at two pharmacies four miles apart, can differ by 400%. Not 4%. Four hundred. The same 30-day supply of the same generic, same strength, same manufacturer, can be $12 at one counter and $58 at another in the next ZIP code. And neither pharmacy is doing anything wrong. That is simply how cash pricing works when it sits downstream of PBM contracts, wholesaler agreements, discount-card programs and store-level discretion.
Add a second variable — availability — and it gets worse. A cheap price at a pharmacy that is out of stock is not a price. It is a wasted trip for a patient who may already be unwell, uninsured, or without a car.
The client's engineering team could build the app. What they could not build, and could not buy off the shelf, was the underlying truth: what does this drug actually cost, and is it actually in stock, at every pharmacy in this ZIP code, right now?
That is the problem Actowiz Solutions was brought in to solve. This is how it was built — the data model, the ZIP-level collection design, the matching layer, the sample data, the compliance boundaries that mattered more here than in any commercial project, and what the numbers looked like ninety days in.
Why Drug Pricing Is Uniquely Hard to Track
Anyone who has built retail price intelligence assumes the pharmacy version is the same job with different SKUs. It is not. Five things break the standard playbook.
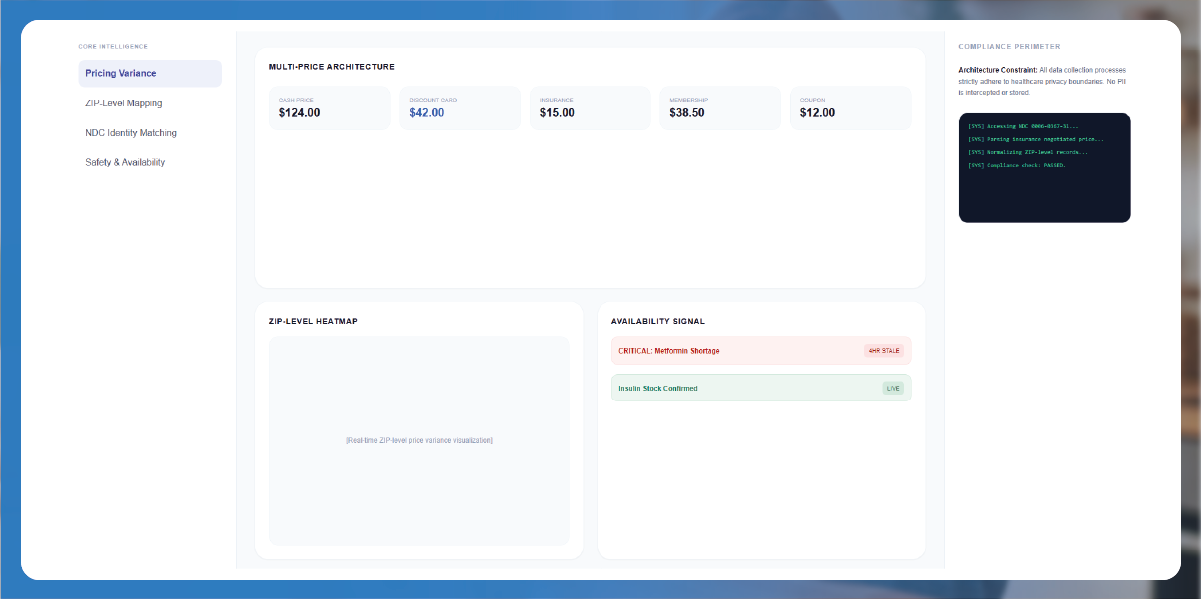
- There is no single "price." For any given drug at any given pharmacy, several prices coexist simultaneously: the cash/usual-and-customary price, the price with a discount card, the price under a membership program, the negotiated price under each insurance plan, and the price under a manufacturer coupon. They can differ by multiples. A dataset that captures one of these and calls it "the price" is misleading by construction.
- Price varies by ZIP, not by chain. The intuition that "Chain A is always cheaper than Chain B" is wrong. Store-level and regional variation within the same chain is often larger than the variation between chains. Any analysis at the chain level averages away the exact signal a patient needs. ZIP-level drug pricing and availability data is not a refinement of national data — it is a different dataset that happens to share a name.
- The product identity is complicated. A drug is not a SKU. It is a molecule, at a strength, in a form, from a manufacturer, in a package size, dispensed in a quantity. "Metformin" is not a product. "Metformin HCl 500mg tablet, 60 count" is closer. And the same NDC can appear under different display names across different pharmacy sites.
- Availability is unreliable and consequential. Pharmacy stock signals are inconsistently exposed, frequently stale, and — during a shortage — change hour to hour. Yet a wrong availability signal has a much higher cost here than in retail. Sending someone to a pharmacy that cannot fill their prescription is not an inconvenience; for someone rationing insulin, it is a safety issue.
- The compliance perimeter is real. This is healthcare. The rules about what you may and may not collect, store and infer are not marketing guidelines. They are the boundary of the project. More on this below, because it shaped the architecture more than any technical constraint did.
The Data Model
The program was designed around six entities.
| Entity |
Key Fields |
Why It Exists |
| Drug |
NDC, generic name, brand name, strength, dosage form, route, manufacturer, therapeutic class, generic/brand flag |
The canonical product identity |
| Package |
Package size, unit count, days-supply basis, quantity dispensed |
Price is meaningless without quantity |
| Pharmacy location |
Location ID, chain/independent flag, banner, street address, ZIP, county, lat/long, hours, 24-hour flag |
The unit of geography that matters |
| Price observation |
Price type (cash / discount-card / membership), price, price per unit, price per day-supply, capture timestamp |
The measurement |
| Availability observation |
In stock / limited / out of stock / special order, last-updated signal, backorder flag, substitute offered |
The other half of the answer |
| Access context |
Distance from ZIP centroid, drive time, delivery available, pharmacy desert flag |
Whether the patient can actually get there |
Two fields in that model carried disproportionate weight.
Price per day-supply. Not price. A $28 bottle of 90 tablets and a $14 bottle of 30 tablets are not a $14 difference — they are the same price per day. Every price observation was normalized to price per unit and price per 30-day supply before it was allowed anywhere near a comparison. Skipping this normalization is the single most common way pharmacy price comparisons produce confidently wrong answers.
Price type. Every price carried an explicit type label. A cash price and a discount-card price were never allowed to appear in the same column without that label attached. Blending them silently would have produced a dataset that looked cheaper than reality for some pharmacies and more expensive for others — exactly the kind of error that erodes patient trust the first time someone shows up at the counter and the number doesn't match.
The ZIP-Level Collection Design
The core design decision was that ZIP code is the unit of collection, not the unit of aggregation.
Most price programs collect nationally and then slice by geography. That produces geographic averages with large gaps — fine for a market report, useless for a patient standing in a specific ZIP with a specific prescription.
The client's grid was built the other way round:
- Geography: the target ZIP codes, plus every pharmacy location within a defined radius of each ZIP centroid — because the cheapest option is frequently just across a ZIP boundary
- Drug set: the top ~800 dispensed generics and high-volume brands, covering the overwhelming majority of prescription volume, tiered by fill frequency
- Price types: cash and discount-card, captured separately, never merged
- Cadence: tiered — daily for high-volatility and shortage-affected drugs, weekly for the stable long tail
- Availability: collected on every price capture, never as a separate lower-frequency job
That last point matters. Price and availability captured at different times produce a record that is internally inconsistent — a Tuesday price paired with a Thursday stock status. Every observation in this system carried both, from the same capture, with the same timestamp.
Collection was rendering-aware, rate-limited, and restricted strictly to publicly displayed pricing and availability information — the same information any member of the public can see when they look up a drug price on a pharmacy's public site or a public price-transparency tool. No authenticated sessions. No patient data. No insurance-specific pricing that would require impersonating a member. That boundary was not negotiable, and it is discussed in full below.
Sample Data: What a Clean Record Looks Like
A single normalized ZIP-level observation:
{
  "capture_ts": "2026-07-13T07:12:03-05:00",
  "query_zip": "60614",
  "drug": {
    "ndc": "00093-1049-01",
    "generic_name": "Atorvastatin Calcium",
    "brand_reference": "Lipitor",
    "strength": "20 mg",
    "dosage_form": "tablet",
    "route": "oral",
    "manufacturer": "Teva",
    "therapeutic_class": "HMG-CoA Reductase Inhibitor",
    "is_generic": true
  },
  "package": {
    "quantity_dispensed": 30,
    "days_supply": 30
  },
  "pharmacy": {
    "location_id": "PH-IL-004417",
    "banner": "Regional Chain B",
    "type": "chain",
    "address_zip": "60618",
    "county": "Cook",
    "lat": 41.9463,
    "lng": -87.7031,
    "distance_from_query_zip_mi": 2.4,
    "drive_time_min": 9,
    "open_24h": false,
    "delivery_available": true
  },
  "prices": [
    {
      "price_type": "cash",
      "price_usd": 41.99,
      "price_per_unit_usd": 1.40,
      "price_per_30d_usd": 41.99
    },
    {
      "price_type": "discount_card",
      "price_usd": 9.60,
      "price_per_unit_usd": 0.32,
      "price_per_30d_usd": 9.60,
      "program": "public discount program"
    }
  ],
  "availability": {
    "status": "in_stock",
    "signal_freshness_hours": 3,
    "backorder_flag": false,
    "substitute_offered": null
  },
  "derived": {
    "cheapest_in_zip_radius_30d_usd": 8.20,
    "gap_to_cheapest_pct": 17.1,
    "zip_median_30d_usd": 24.50,
    "zip_price_spread_pct": 412.0,
    "verdict": "NOT_CHEAPEST_BUT_AVAILABLE"
  }
}
Look at zip_price_spread_pct: 412%. That is the ratio between the cheapest and most expensive available option for the same drug, same strength, same quantity, within a few miles of one ZIP code. It is not an outlier record. It is the ordinary state of the market, and it is the entire reason the client's product exists.
Note also the two price rows. The cash price is $41.99. The public discount-card price at the same counter is $9.60. Same pharmacy, same drug, same day. A dataset that captured only the first number would have been technically accurate and practically useless.
The ZIP-Level Comparison View
Aggregate those records and you get the cut the client's app actually renders — every pharmacy within reach of one ZIP, for one prescription:
| Pharmacy |
Type |
ZIP |
Distance |
Cash (30d) |
Discount (30d) |
Availability |
Best Price |
| National Chain A |
Chain |
60614 |
0.8 mi |
$52.40 |
$14.20 |
In stock |
$14.20 |
| Regional Chain B |
Chain |
60618 |
2.4 mi |
$41.99 |
$9.60 |
In stock |
$9.60 |
| Independent Pharmacy C |
Independent |
60614 |
1.1 mi |
$38.00 |
$12.00 |
In stock |
$12.00 |
| Grocery Pharmacy D |
Chain |
60647 |
3.2 mi |
$33.50 |
$8.20 |
Out of stock |
— |
| Big-Box Pharmacy E |
Chain |
60622 |
4.1 mi |
$29.99 |
$8.40 |
In stock |
$8.40 |
| Independent Pharmacy F |
Independent |
60618 |
2.9 mi |
$61.00 |
$61.00 |
Limited |
$61.00 |
Three findings a patient could act on immediately, and none of them are visible without the joined price-plus-availability view:
The cheapest listed price is unbuyable. Grocery Pharmacy D at $8.20 is out of stock. A price comparison tool without availability data sends the patient there, and the patient — possibly without a car, possibly missing work — arrives to nothing. The real floor is $8.40 at Big-Box Pharmacy E, 4.1 miles away.
The spread is 7x. $8.40 to $61.00 for the identical prescription within a 4-mile radius. Independent Pharmacy F offers no discount-card price at all, so its cash price is its price.
Distance versus savings is a real trade-off. The closest pharmacy costs $14.20. Driving 3.3 miles further saves $5.80 — a decision only the patient can make, but one they can only make if someone shows them the table.
Availability: The Half Everyone Skips
Pharmacy stock-out monitoring was, on the client's own analysis, the single highest-value component of the program — and the one they had originally scoped as "phase two."
Price data is table stakes. A dozen tools show prices. What almost nobody shows is whether the price is fillable, and that is the thing that determines whether the patient's day ends with medicine in hand.
The availability layer captured:
- Status — in stock, limited, out of stock, special order
- Signal freshness — how old the stock indication was, exposed explicitly rather than hidden
- Backorder and shortage flags — where a drug was flagged as constrained rather than merely absent
- Substitute offered — where an alternative manufacturer's equivalent was proposed
- ZIP-level stock-out rate — the aggregate signal, and the sleeper insight of the entire project
That last metric turned out to be the finding that changed the client's roadmap. Aggregated across a ZIP and tracked daily, the stock-out rate produced a pharmacy access map — an evidence-based picture of which ZIPs could reliably fill common prescriptions and which could not.
The pattern that emerged was uncomfortable and entirely unsurprising: stock-out rates were consistently higher in lower-income ZIPs, and the ZIPs with the fewest pharmacies within reach were also the ZIPs where the remaining pharmacies were most likely to be out of stock. The places with the least access had the least reliable access.
That is not a pricing insight. It is a health-equity insight, produced as a by-product of a pricing system, and it became the basis of the client's outreach and partnership strategy.
The Matching Layer
Everything above depends on knowing that the drug listed on Pharmacy A's site and the drug listed on Pharmacy B's site are the same drug. The cascade used:
Tier 1 — NDC match. Where the National Drug Code is exposed, the match is exact. This is the gold standard and it is used wherever available.
Tier 2 — Composition match. Generic name + strength + dosage form + route + quantity. This resolves the very common case where two pharmacies stock the same generic from different manufacturers — clinically equivalent, different NDC, and correctly treated as the same option for comparison purposes, with the manufacturer difference disclosed rather than hidden.
Tier 3 — Brand-to-generic mapping. Linking a brand-name listing to its generic equivalents, so a patient searching a brand name sees the generic options that a pharmacist would offer them anyway.
Tier 4 — Human review queue. Anything below the confidence threshold. In a healthcare context this queue is not optional, and the threshold is set deliberately high. A bad match in retail costs a customer a small annoyance. A bad match here could put a patient in front of the wrong medication.
Every match carried a confidence score, every score travelled with the record, and anything below threshold was never surfaced as a comparison — it was withheld. In this domain, showing nothing is an acceptable outcome. Showing something wrong is not.
Compliance: The Part That Shaped Everything
This section is not boilerplate. In healthcare it is the architecture.
- No patient data. None. No PHI, no prescription records, no identifiers, no insurance member data, nothing that could identify a person. The system observed products and prices, never people. There was no path by which a patient's identity could enter the dataset, and that was enforced at the schema level, not by policy alone.
- Publicly displayed information only. Prices and availability that any member of the public can look up. No authenticated sessions, no member-only insurance pricing, no impersonation of a plan member to extract negotiated rates.
- Respectful, rate-limited collection. Pharmacy sites include independent operators running on modest infrastructure. Collection was paced so as never to degrade service. Slowing down a pharmacy's website to get a price is an unacceptable trade.
- Not medical advice. The output is price and availability information. It never recommended a drug, a substitution, or a course of treatment. Substitution is a clinical decision belonging to a prescriber and a pharmacist, and the product's copy was written to make that boundary unmistakable.
- Freshness disclosed, always. Every price and every stock status carried a visible timestamp. A patient making a decision that affects their health deserves to know how old the number is. Invisible staleness is unacceptable when the cost of being wrong is a wasted trip by someone who is unwell.
- Accuracy over coverage. Where confidence was low, the system showed nothing rather than something uncertain. That is the correct trade in this domain, and it was made explicitly and repeatedly.
Results at 90 Days
| Metric |
Before |
After |
| ZIP codes with pharmacy-level price coverage |
40 (manual) |
3,100+ |
| Drugs tracked |
~60 |
~800 (majority of dispensed volume) |
| Price types captured |
Cash only |
Cash + discount programs, labelled separately |
| Availability data |
None |
Every observation, same timestamp as price |
| Median savings surfaced per prescription |
Not measured |
$31 per fill on tracked generics |
| Wasted-trip rate (user-reported, price found but drug unavailable) |
22% |
Under 4% |
| Match precision (audited) |
n/a |
98.1% |
| Time to detect a ZIP-level stock-out cascade |
Never detected |
Under 24 hours |
The wasted-trip number is the one the client's product team cared about most, and it is the one that would never have moved without the availability layer. A price comparison tool that gets someone to a closed door has not helped them. It has cost them a morning.
The $31 median saving per fill is what the program was ostensibly built for. The 22% → 4% wasted-trip reduction is what made patients keep using it.
Who Else Needs This
- Patient-access and price-transparency platforms — the use case above.
- Payers and employers benchmark what their populations are actually paying at the counter versus what the plan assumes, ZIP by ZIP.
- Pharmacy chains benchmark their own price and stock position against every competitor in each ZIP they serve, rather than against a national average that describes no store they operate.
- Public health researchers and policymakers measure pharmacy deserts and access inequity with observational evidence rather than facility counts — because a pharmacy that is chronically out of stock is, functionally, not a pharmacy.
- Manufacturers and distributors detect regional availability gaps and shortage propagation in near-real time, at a geographic resolution their own distribution data does not provide.
FAQs
Why track by ZIP instead of by chain or state?
Because ZIP is the geography the patient actually lives in. Within-chain variation between stores is frequently larger than between-chain variation, and state-level averages smooth away exactly the differences that determine what a person pays. A national average price for a generic is a statistic. A ZIP-level price table is a decision.
Why are cash and discount-card prices kept separate?
Because they can differ by 4x at the same counter on the same day, and a patient needs to know which number applies to them. Blending them produces a figure that is wrong for everyone. Every price in the dataset carries an explicit type label.
Is availability data reliable enough to act on?
It is reliable enough to be far better than nothing — which is what the alternative is — but only if freshness is exposed rather than hidden. Every stock signal carries its age. A three-hour-old "in stock" is treated very differently from a three-day-old one, and the patient sees which they are getting.
Does this involve any patient data?
No. Not at any point, in any form. The system observes publicly displayed prices and availability for products. It never touches PHI, prescription records, insurance member data or personal identifiers, and there is no architectural path by which it could.
Is collecting public pharmacy price data permissible?
Collecting publicly displayed prices and availability for comparison and research is well-established practice, and price transparency in healthcare is actively encouraged by policy. The requirements are strict and were followed throughout: public data only, no patient data, no authenticated or member-specific pricing, non-disruptive rate-limited collection, and clear communication that the output is price information rather than medical advice.
How long before the data is useful?
Cross-sectional value — what a drug costs across the pharmacies near one ZIP today — is available from the first collection cycle. The time-series value, including stock-out patterns, shortage propagation and access mapping, needs 60 to 90 days of consistent collection.
Conclusion
The client set out to answer a narrow question: where is this prescription cheapest near me? The data answered it — and then answered several questions nobody had thought to ask.
That the spread for an identical generic within a few miles is routinely several hundred percent. That the cheapest listed price is frequently unbuyable, which makes any price-only tool actively harmful to the people relying on it. And that stock-out rates cluster in exactly the ZIP codes least able to absorb them, turning a pricing dataset into an access map that no facility count would ever have produced.
Actowiz Solutions built and now operates the data layer behind that product — ZIP-level collection, NDC-grade matching, price-type separation, availability captured on every observation, and a compliance perimeter designed for healthcare rather than retrofitted onto it.
If you are building anything that asks a patient to act on a price, the price alone is not enough. It never was.
You can also reach us for all your mobile app scraping, data collection, web scraping , and instant data scraper service requirements!

 By industry🏷 By platform🌐 By market
 Pricing & Promotions
MAP Violations Brand Protection Counterfeit Detection Price Intelligence AI HOT Data Intelligence
Pricing & Promotions
MAP Violations Brand Protection Counterfeit Detection Price Intelligence AI HOT Data Intelligence Brand & Intelligence
Share of Search Content Audit & PDP Reviews & Ratings Retail Media Buy Box Monitoring Social Commerce HOT Live Commerce NEW Agentic Commerce NEW
Brand & Intelligence
Share of Search Content Audit & PDP Reviews & Ratings Retail Media Buy Box Monitoring Social Commerce HOT Live Commerce NEW Agentic Commerce NEW Digital Shelf & Search
Assortment Planning Competitive Benchmarking Product Availability Q-Commerce NEW
Digital Shelf & Search
Assortment Planning Competitive Benchmarking Product Availability Q-Commerce NEW AssortmentE-commerce Intelligence Hyperlocal Insights POI & Store Locator DTC Brand Analytics NEW
 For Retailers
 E-Commerce Dashboard
 Flipkart Insights (Live) #1
 Grocery Intelligence
.svg) Grocery Price (U.S.)
Grocery Price (U.S.)
.svg) Quick Commerce (India) HOT
Quick Commerce (India) HOT
 Food & Restaurant
 Fashion Intelligence
 Automotive
 Travel & Hospitality
 Real Estate
 Food Delivery Intelligence NEW
 OTT & Streaming NEW
 Fuel & EV Charging Price Tracker NEW
 By Use Case
 Pricing Intelligence
 Digital Shelf Analytics
 MAP Monitoring HOT
 Cross-Border Price Parity NEW
 Share of Search
 Review Sentiment
 Kitchen Market Gaps NEW
 Dynamic Pricing / AI Repricing NEW
 Promotions & Deals Alerts NEW
 B2B / POI & Lead Data NEW
 AI Search Visibility Dashboard NEW
 Baby Products on Quick Commerce NEW
 Hotel & Flight Rate Parity NEW
 By Region🇮🇳 India 🇺🇸 USA 🇦🇪 Middle East 🇬🇧 UK 🇦🇺 Australia 🌏 SE Asia 🇪🇺 Europe 🌎 LATAMIndia
 Flipkart Real-Time Insights
 Quick Commerce — Zepto · Blinkit
 Pincode Price Tracker
Middle East
Pincode Price Tracker
Middle East GCC Q-Commerce — Talabat · Noon NEW
UK & Australia
GCC Q-Commerce — Talabat · Noon NEW
UK & Australia UK Grocery — Tesco, Sainsbury's, Asda
 AU Grocery — Coles & Woolworths NEW
 Marketplace Scrapers
Amazon API TikTok Shop API HOT Uber Eats API Airbnb API Zepto / Blinkit API Instacart API NEW Talabat API NEW
Marketplace Scrapers
Amazon API TikTok Shop API HOT Uber Eats API Airbnb API Zepto / Blinkit API Instacart API NEW Talabat API NEW Developer APIsWeb Extract API Reviews API SERP API Pricing Webhook NEW
 Universal APIsStreaming Crawl API Scheduler Realtime Alerts Webhook Delivery 🐍 Python SDK 💚 Node.js SDK
 Delivery & SDKs
 Knowledge Center
Digital Shelf Playbook MAP Compliance Guide Pricing Intel Guide Scraping Compliance TikTok Shop Guide NEW Cross-Border Guide NEW
Knowledge Center
Digital Shelf Playbook MAP Compliance Guide Pricing Intel Guide Scraping Compliance TikTok Shop Guide NEW Cross-Border Guide NEW Guides & Playbooks
🎉 Seasonal & event tracking NEWBlack Friday pricing report Festive season, India Ramadan, GCC grocery All seasonal reportsSample Datasets HOT ROI Calculator NEW API Postman Collection Demo Dashboards Free API Playground NEW Press Kit
Guides & Playbooks
🎉 Seasonal & event tracking NEWBlack Friday pricing report Festive season, India Ramadan, GCC grocery All seasonal reportsSample Datasets HOT ROI Calculator NEW API Postman Collection Demo Dashboards Free API Playground NEW Press Kit Downloads & Tools
Trust Center About Us FAQs Careers
Downloads & Tools
Trust Center About Us FAQs Careers Trust & CompanyRetail shelf research NEWRetail shelf research






































 4.8/5 Average Rating
 50+ Video Testimonials
 92% Client Retention
 50+ Countries Served


.webp)