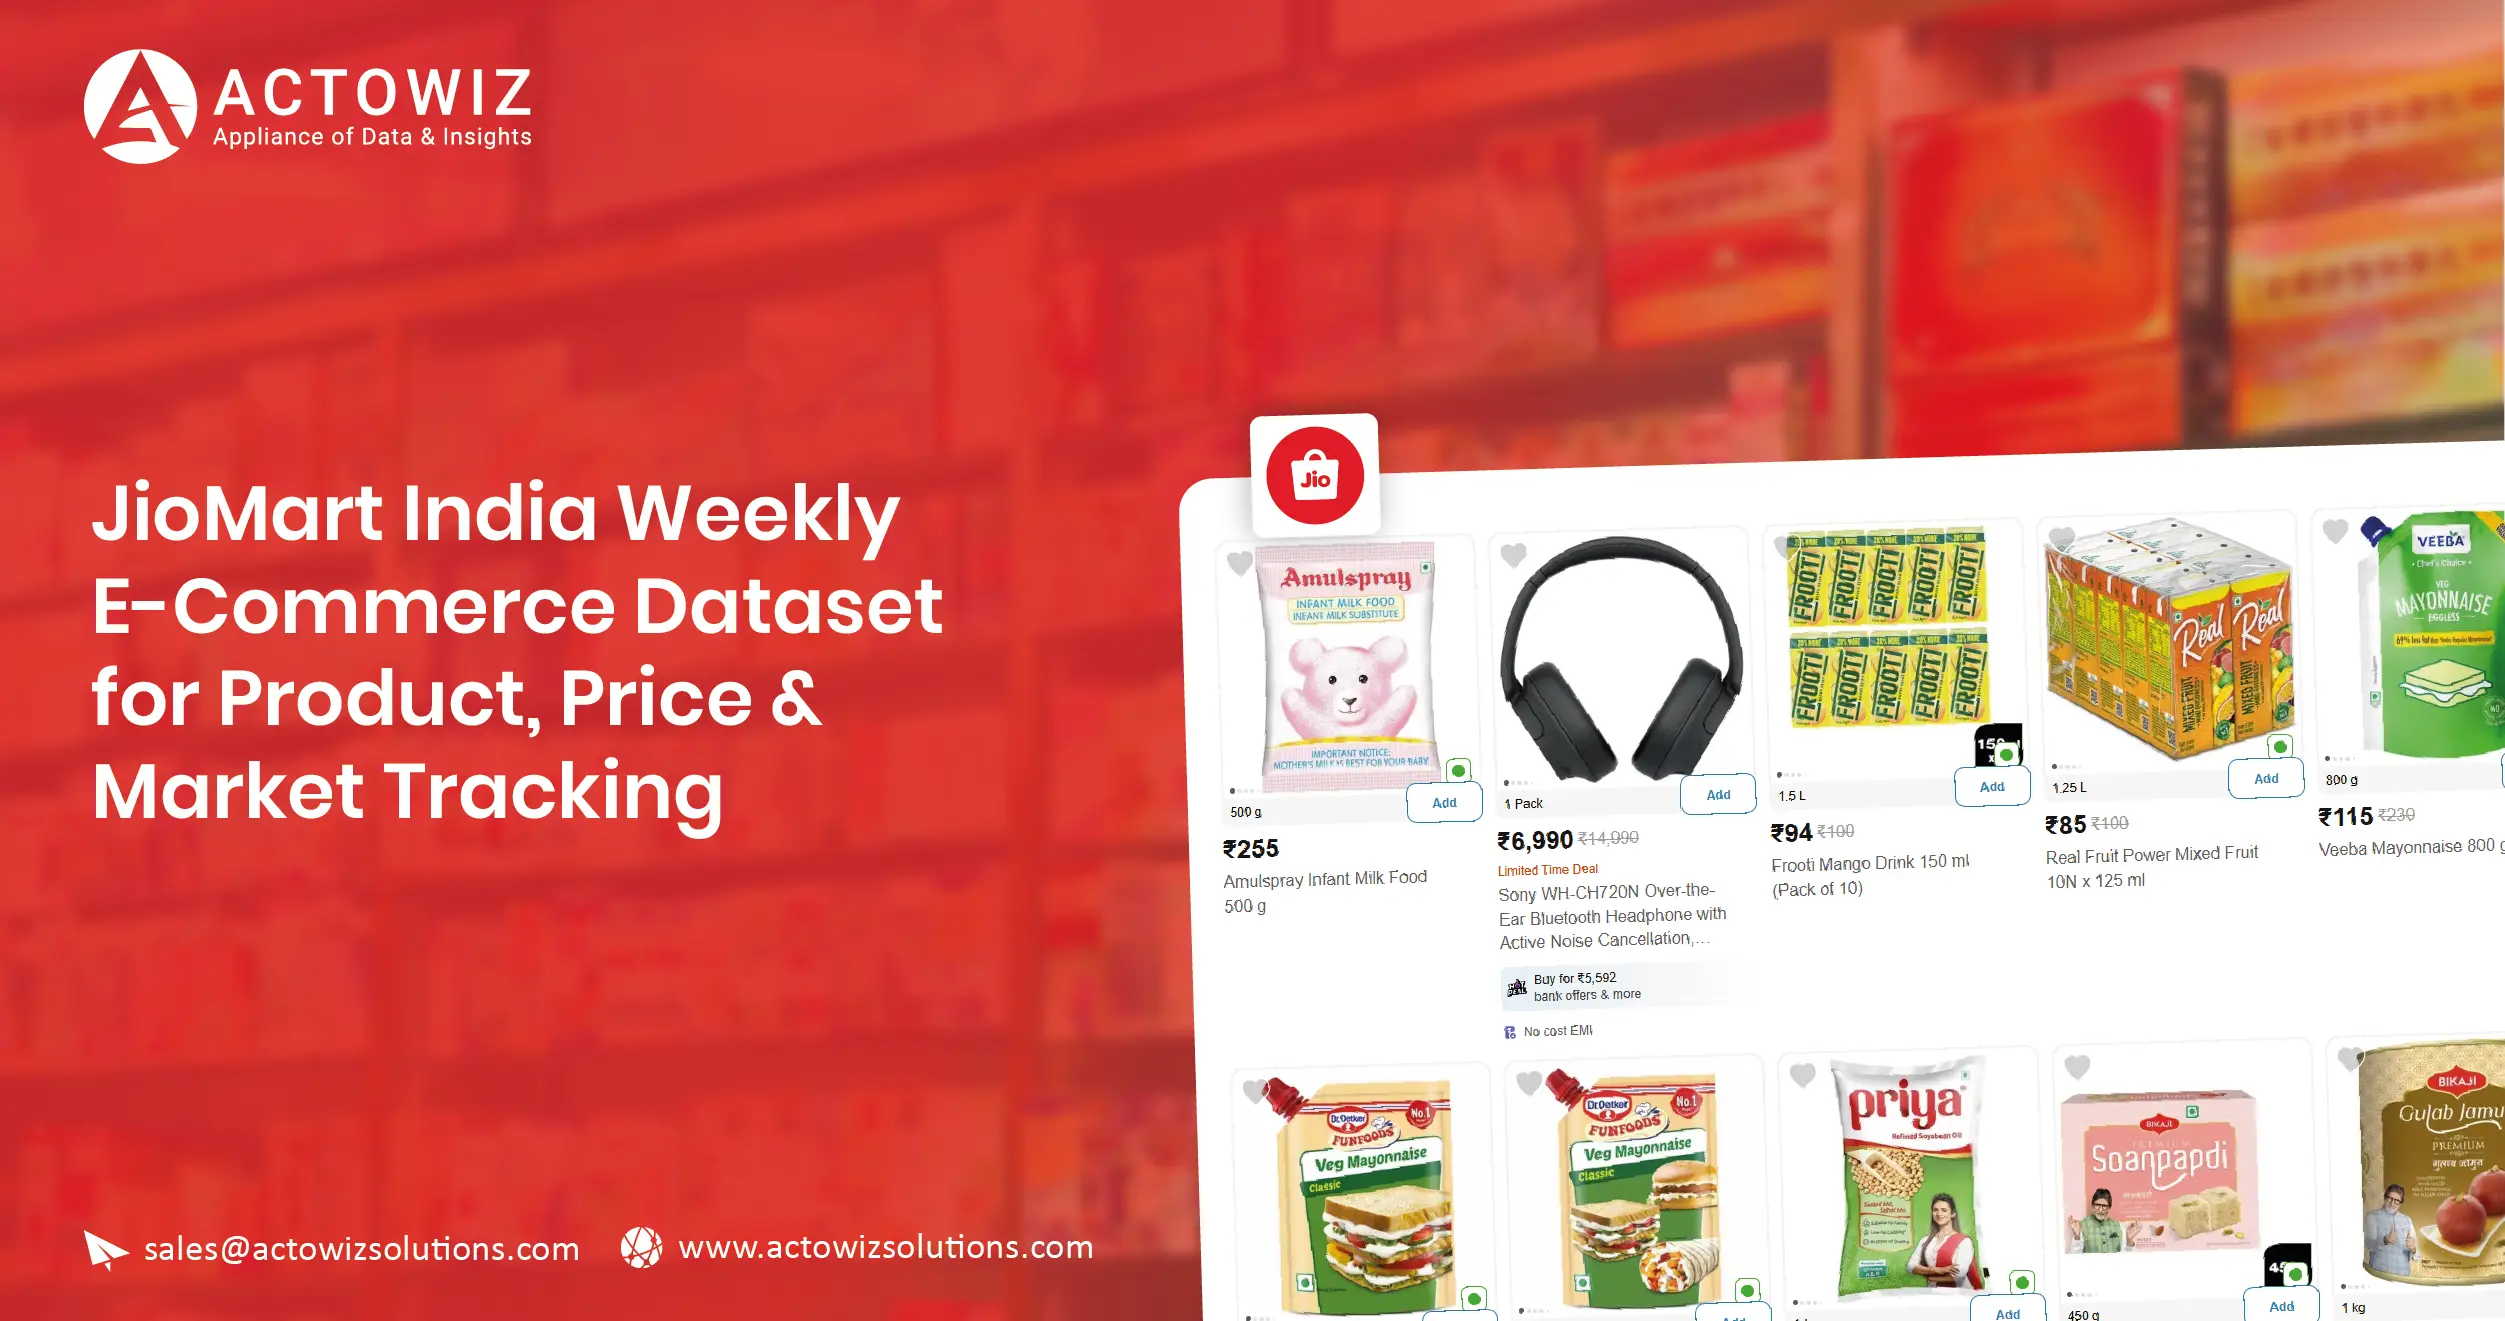
Businesses can make faster pricing, inventory, assortment, and competitive decisions when they have consistent marketplace data. The JioMart India Weekly E-Commerce Dataset provides a structured way to analyze product listings, prices, discounts, availability, ratings, and category-level changes over recurring weekly snapshots. For brands and retailers, JioMart Data Scraping can turn changing marketplace information into an organized source for business intelligence, competitive analysis, and market monitoring.
For e-commerce teams, the challenge is not simply collecting information. It is identifying what changed, when it changed, and whether the change requires action. A product may become unavailable, a competitor may reduce its price, a promotional offer may disappear, or a product assortment may expand within a category.
Weekly data makes these movements easier to compare. Instead of examining marketplace pages manually, businesses can maintain historical records and evaluate trends across products, sellers, categories, prices, discounts, and availability.
This approach is particularly useful for:
The practical value comes from converting recurring marketplace observations into measurable signals that support better decisions.
A recurring collection process can create a historical view of marketplace activity rather than a single point-in-time snapshot. This helps businesses distinguish temporary changes from persistent trends.
The following figures are illustrative analytical benchmarks, not claims about actual JioMart marketplace volumes. They demonstrate how a business could organize and evaluate a seven-year historical framework.
| Year | Weekly Tracking Focus | Example Metrics |
|---|---|---|
| 2020 | Baseline catalog development | Products, categories, listed prices |
| 2021 | Assortment expansion | New listings, price ranges, availability |
| 2022 | Promotional comparison | Discounts, offers, price changes |
| 2023 | Competitive monitoring | Brand positions, seller activity |
| 2024 | Category intelligence | Assortment depth, pricing distribution |
| 2025 | Dynamic market analysis | Weekly price and stock movements |
| 2026 | Automated decision support | Alerts, dashboards, historical comparisons |
A buyer can use these year-wise points to build a consistent analytical model. For example, a pricing team can compare the median listed price of selected SKUs across weekly observations. A category manager can calculate how many products entered or disappeared from a category during a period.
| Business Metric | Example Calculation | Possible Use |
|---|---|---|
| Price Change % | (New Price - Old Price) / Old Price × 100 | Pricing alerts |
| Discount % | (MRP - Selling Price) / MRP × 100 | Promotion analysis |
| Availability Rate | Available SKUs / Tracked SKUs × 100 | Inventory visibility |
| New Product Rate | New SKUs / Total SKUs × 100 | Assortment expansion |
| Weekly Volatility | Average absolute weekly price movement | Market stability |
The advantage of such measurements is that raw marketplace records become decision-ready indicators.
Businesses operating across consumer categories often need to understand how product prices move from week to week. A structured JioMart India weekly Products price Dataset can help analysts compare SKU-level pricing, MRP, selling prices, discounts, brands, categories, and product availability.
Ecommerce Data Scraping can support recurring collection across a defined product universe. Instead of collecting isolated prices, businesses can maintain historical observations for each SKU and identify meaningful movements.
For example, consider an illustrative product priced at ₹1,000 in January and ₹920 several weeks later. The absolute difference is ₹80, representing an 8% reduction. When similar products from competing brands show a 2%–3% movement during the same period, the larger change becomes a potential competitive signal.
This type of comparison can answer practical questions:
| Period | Example Business Question | Recommended Analysis |
|---|---|---|
| 2020–2021 | What was the original price baseline? | Historical SKU comparison |
| 2022 | Which products became more promotional? | Discount frequency |
| 2023 | Which competitors moved prices? | Brand-level benchmarking |
| 2024 | Which categories became more volatile? | Category price variance |
| 2025 | Which SKUs changed most often? | Weekly change frequency |
| 2026 | Which changes require immediate attention? | Automated alerts |
The key is consistency. If the same SKUs are tracked using the same fields and collection logic, analysts can create reliable comparisons instead of manually stitching together inconsistent observations.
Inventory availability can influence both customer experience and competitive positioning. The Real-Time JioMart India inventory monitoring approach focuses on identifying whether products are available, unavailable, or showing a changing availability status at the time of collection.
A JioMart India Weekly E-Commerce Dataset can complement this by preserving recurring availability observations. Together, these approaches allow businesses to distinguish between an isolated stockout and a repeated availability problem.
Suppose an illustrative dataset tracks 500 SKUs every week. If 40 products are unavailable in Week 1, 55 in Week 2, and 75 in Week 3, the business can investigate whether the increase is concentrated in one category, brand, seller, or product type.
| Week | SKUs Tracked | Unavailable SKUs | Availability Rate |
|---|---|---|---|
| Week 1 | 500 | 40 | 92.0% |
| Week 2 | 500 | 55 | 89.0% |
| Week 3 | 500 | 75 | 85.0% |
| Week 4 | 500 | 60 | 88.0% |
Useful inventory indicators include:
For procurement and category teams, this can reveal products that require replenishment attention. For competitors, recurring availability changes may also provide context when interpreting price movements.
A JioMart product catalog pricing and discount dataset can connect product-level information with pricing and promotional analysis. Instead of looking only at current selling prices, analysts can examine MRP, selling price, discount percentage, category, brand, product name, and historical changes.
An E-commerce Dashboard can then convert these records into visual business indicators.
A useful dashboard could include:
| Dashboard View | Key KPI | Business Question |
|---|---|---|
| Price Monitor | Average selling price | Are prices moving? |
| Discount Tracker | Average discount % | Which categories are promotional? |
| Brand Comparison | Price index | How do brands compare? |
| Category View | Median price | Which categories are expensive? |
| Availability | In-stock % | Where are stockouts increasing? |
| Change Monitor | Weekly price changes | Which SKUs need review? |
From 2020 to 2026, an analytical framework can evolve from simple catalog reporting into automated monitoring. Early historical records can establish baselines, while later weekly observations can identify deviations from those baselines.
For example, if a category historically shows an average discount of 10%–15% but a weekly observation records substantially higher promotional activity, analysts can flag the category for review. Similarly, if a product's price moves outside its historical range, a dashboard can identify it for pricing analysis.
The objective is not simply to create attractive charts. A useful dashboard should connect data changes to specific business decisions.
The JioMart Historical Products Pricing Dataset gives analysts a foundation for comparing product prices across different periods. Historical pricing is especially valuable because current marketplace prices rarely explain why a change occurred.
A historical record can preserve:
For example, an illustrative seven-year analysis could divide observations into three periods:
| Period | Primary Analytical Purpose | Example Output |
|---|---|---|
| 2020–2022 | Establish historical baseline | Price ranges |
| 2023–2024 | Identify market shifts | Category comparisons |
| 2025–2026 | Monitor recent behavior | Weekly alerts |
Historical data can help answer whether a current discount is unusually high, whether a price movement is temporary, and whether a product repeatedly follows a promotional cycle.
Businesses can also calculate minimum, maximum, average, and median prices over selected periods. These statistics provide more context than a single current price.
For pricing teams, the most valuable insight may be the relationship between price and availability. If a SKU repeatedly becomes unavailable following a particular pricing pattern, that observation can support further commercial investigation.
JioMart Product Price Change Data Scraping can help businesses identify differences between consecutive observations instead of manually reviewing complete product lists.
A basic weekly comparison can categorize products into:
Consider an illustrative dataset containing 1,000 tracked products. If 120 prices changed during one weekly cycle, analysts could prioritize those 120 records rather than manually reviewing all 1,000 products.
| Weekly Event | Products | Share of Tracked Products |
|---|---|---|
| Price increased | 45 | 4.5% |
| Price decreased | 75 | 7.5% |
| Price unchanged | 820 | 82.0% |
| New or newly observed | 35 | 3.5% |
| Availability changed | 25 | 2.5% |
Change detection becomes more valuable when paired with thresholds. A business might create internal rules such as:
This converts a large dataset into a manageable stream of business alerts.
The JioMart Combo Offers Dataset can help businesses analyze bundled products, multi-product promotions, and offer structures. For retailers and brands, bundle tracking can reveal how products are positioned beyond their individual selling prices.
A JioMart India Weekly E-Commerce Dataset can preserve recurring observations of these promotional structures, allowing analysts to compare offer visibility over time.
Consider an illustrative example where a single product sells for ₹600, while a two-product combination is promoted at ₹999. The effective bundle price per item becomes ₹499.50, creating a measurable comparison against the individual selling price.
| Offer Type | Individual Value | Bundle/Offer Value | Analytical Question |
|---|---|---|---|
| Single product | ₹600 | ₹600 | Baseline |
| 2-item bundle | ₹1,200 | ₹999 | Effective saving |
| Multi-buy | ₹1,800 | ₹1,399 | Promotion depth |
| Coupon-linked offer | ₹600 | ₹550* | Net price |
*Illustrative values only; actual coupon conditions may vary.
Tracking these structures over weekly snapshots can help identify recurring promotional patterns. Analysts can examine which categories use bundles most frequently, which brands introduce offers, and whether promotions persist or disappear.
For brands, this information can support promotional benchmarking. For retailers, it can provide another layer for category and pricing analysis.
Actowiz Solutions can help businesses build structured Jiomart India Weekly E-Commerce Dataset solutions around their specific monitoring requirements. Instead of relying on one generic extraction format, data collection can be designed around the fields, categories, products, frequency, and analytical objectives that matter to the buyer.
The process can include:
Actowiz Solutions can also provide JioMart India Weekly E-Commerce Dataset workflows designed for recurring analysis. Depending on the project requirement, businesses can use structured datasets for pricing intelligence, inventory analysis, assortment monitoring, competitor research, promotional tracking, and market intelligence.
A practical data pipeline can follow this structure:
Marketplace → Data Collection → Validation → Cleaning → Historical Database → Analytics → Dashboard → Business Action
Data quality is particularly important for longitudinal analysis. Product names can change, listings can disappear, prices can fluctuate, and categories can evolve. A robust workflow should therefore preserve collection dates and stable identifiers wherever possible.
Businesses can improve project outcomes by defining these requirements upfront:
| Requirement | Example |
|---|---|
| Product scope | Selected SKUs or full categories |
| Geography | India-wide or defined coverage |
| Frequency | Weekly, daily, or custom |
| Fields | Price, MRP, discount, rating, availability |
| History | New collection or historical requirement |
| Delivery | CSV, JSON, Excel, database, API |
| Analytics | Pricing, assortment, inventory, promotions |
This ensures that the resulting data is aligned with the intended business use rather than simply producing a large volume of raw records.
A recurring marketplace dataset can support several practical use cases simultaneously.
Competitive pricing: Businesses can compare their prices with marketplace listings and monitor meaningful changes.
Assortment intelligence: Category teams can identify new products, disappearing listings, and changes in assortment depth.
Promotion analysis: Marketing teams can compare discounts, bundles, and promotional frequency.
Inventory intelligence: Operations teams can monitor availability patterns and recurring stockouts.
Historical benchmarking: Analysts can compare current observations with previous weeks, months, or years.
Market research: Research teams can use structured product information to understand category-level movements.
The strongest results come when these use cases are connected. For instance, a price decrease combined with a stockout may tell a different story from a price decrease while availability remains stable.
That is why businesses should avoid analyzing price, inventory, promotion, and assortment as completely separate datasets. A common product-level structure makes cross-analysis possible.
A modern marketplace monitoring strategy should focus on three principles: consistency, context, and actionability.
Consistency means collecting comparable fields at regular intervals.
Context means retaining historical observations so current values can be interpreted against previous conditions.
Actionability means structuring outputs so business teams can quickly identify changes that require attention.
For 2026 and beyond, the value of e-commerce data is increasingly tied to how quickly organizations can move from observation to decision. A weekly dataset can provide a repeatable foundation for this process without requiring teams to manually inspect marketplace pages every time they need an update.
The JioMart India Weekly E-Commerce Dataset can provide a practical foundation for tracking products, pricing, discounts, availability, assortment, and promotional movements over time. When recurring observations are cleaned, standardized, and connected to historical records, businesses can move beyond basic product monitoring toward structured competitive and market intelligence.
The right data strategy should answer clear business questions: Which prices changed? Which products became unavailable? Which categories are becoming more promotional? Which competitors changed their positioning? Which products deserve immediate attention?
Businesses can use a Web scraping API to integrate recurring data collection into internal workflows, while Custom Datasets can be structured around specific categories, SKUs, fields, and monitoring frequencies. An instant data scraper approach can further support teams that need faster access to marketplace information for research and analysis.
The goal is simple: collect the right marketplace data consistently, organize it historically, and turn changes into actionable insights.
Ready to build a structured marketplace intelligence solution? Contact Actowiz Solutions to discuss your e-commerce data collection requirements and create a dataset tailored to your business goals!
You can also reach us for all your mobile app scraping, data collection, web scraping, and instant data scraper service requirements!
Our web scraping expertise is relied on by 4,000+ global enterprises including Zomato, Tata Consumer, Subway, and Expedia — helping them turn web data into growth.
Watch how businesses like yours are using Actowiz data to drive growth.
From Zomato to Expedia — see why global leaders trust us with their data.
Backed by automation, data volume, and enterprise-grade scale — we help businesses from startups to Fortune 500s extract competitive insights across the USA, UK, UAE, and beyond.
We partner with agencies, system integrators, and technology platforms to deliver end-to-end solutions across the retail and digital shelf ecosystem.
Track JioMart products, prices, discounts, ratings, and availability with the JioMart India Weekly E-Commerce Dataset for smarter market insights.
Walmart Mexico Item Availability Monitoring tracks specific item IDs to detect pickup and in-store availability across Walmart Mexico locations.
Attendee & Event Data Intelligence Report 2026 explores attendee, event, engagement, and market data to improve audience and competitive insights.
Whether you're a startup or a Fortune 500 — we have the right plan for your data needs.