🎃 HALLOWEEN OFF Spooky Savings Event! Get FLAT 20% OFF on all Web Scraping & Data Extraction Plans 20% OFF Web Scraping Plans!
Ends in: 00d : 00h : 00m : 00s
🦇
👻
🎃 Spooktacular Limited Offer

Don’t Let High Data Costs Haunt You! 🎃

Get FLAT 20% OFF

T&C Apply

Scrape competitor prices, monitor MAP, and extract real-time datasets at a spooky discount this Halloween.

Offer Expires In:
00d : 00h : 00m : 00s
⚡ Claim 20% Discount Now
🎃
Promo Code Copied!
SPOOKY30 (20% OFF Applied)
Core services
Enterprise Data Extraction

Scalable web, app and AI-powered collection across 40+ countries.

All 58 services →
New 2026
AI Training Data

Corpus building with provenance and opt-out compliance.

Learn more →
Free pilot
24-hour sample

We run collection on your own sources before you commit.

Get a sample →
58Services
40+Countries
DEVELOPER

Ready-Made Scrapers

Pre-built for top platforms. Self-serve, no setup.

View All →
TRY FREE

API Playground

Test endpoints instantly. No credit card.

Start Free →
28Tools
2SDKs
icons Delivery & SDKs
Streaming Crawl API Scheduler Realtime Alerts Webhook Delivery 🐍 Python SDK 💚 Node.js SDK
Need it managed instead?

Fixed monthly retainer, named engineer, no per-request metering.

Managed Data API →
HOT

Case Studies

How brands use Actowiz, with named outcomes.

Read →
FREE

Sample Datasets

Real output, no signup.

Download →
NEW

ROI Calculator

Model the return on a data engagement.

Calculate →

Introduction

The Attendee & Event Data Intelligence Report 2026 examines how event, attendee, speaker, sponsor, and engagement data can help businesses understand professional audiences and market opportunities across India and the USA. With Data Intelligence Services, organizations can transform fragmented event information into structured datasets for audience profiling, competitive research, lead discovery, event benchmarking, and market analysis. The report focuses on the event ecosystems surrounding DataBricks and GAMESCO while comparing how event intelligence can support data-driven decisions across technology, gaming, business, and professional communities.

The scale of modern events makes structured data increasingly valuable. Databricks' 2026 Data + AI World Tour is scheduled across 20 cities with 40,000+ attendees and 800 sponsors, including Mumbai in India and multiple U.S. cities such as Dallas, Chicago, New York, Washington, and Anaheim. (Databricks) Databricks also reported that its 2026 Data + AI Summit in San Francisco brought together more than 32,000 in-person attendees, representing 150+ countries. (Databricks)

For event organizers, sponsors, technology providers, gaming businesses, and market researchers, attendee intelligence is no longer limited to registration counts. Useful datasets can include company, job title, industry, location, event participation, session interests, speaker engagement, sponsor relationships, networking activity, and publicly available professional information.

How Is Technology Event Data Becoming a Strategic Intelligence Asset?

Technology conferences produce valuable information about companies, professionals, speakers, sponsors, products, sessions, and emerging themes. Databricks conference & event data Scraping can help structure publicly available event information into datasets that support market research, competitive intelligence, lead discovery, and event benchmarking. The goal is to convert scattered conference information into a consistent analytical framework.

The scale of Databricks' event ecosystem demonstrates the opportunity. Its 2026 Data + AI World Tour lists 20 cities, 40,000+ attendees, and 800 sponsors. The tour includes Mumbai as well as U.S. locations including Dallas, Chicago, New York, Washington, and Anaheim. (Databricks) Its 2026 Data + AI Summit in San Francisco was expected to attract more than 30,000 professionals from 150+ countries, while Databricks later reported more than 32,000 in-person attendees. (Databricks)

Event intelligence metric 2026 reported signal Business relevance
Data + AI World Tour cities 20 Geographic market coverage
World Tour attendees 40,000+ Potential audience scale
World Tour sponsors 800 Partner ecosystem intelligence
Data + AI Summit attendees 32,000+ Global technology audience
Summit countries represented 150+ International market reach
Summit industry tracks 10+ Sector-level segmentation
2020–2026 evolution

From 2020 to 2026, event intelligence moved from static attendee lists and post-event reports toward structured, continuously updated datasets. Pandemic-era virtual events expanded the volume of digital participation signals, while the return of in-person events created opportunities to combine registration, session, networking, geographic, and engagement information.

In 2026, Databricks' World Tour illustrates the scale of multi-city event intelligence. The program spans Asia Pacific, North America, Europe, the Middle East, and Latin America, creating opportunities to compare audience composition by geography and event type. (Databricks)

For businesses, the key shift is from asking "How many people attended?" to asking "Who attended, what did they engage with, which companies were represented, and how does this audience compare with other events?"

What Can Audience Intelligence Reveal About Gaming and Industry Events?

Gaming and entertainment events create a different form of attendee intelligence. GAMESCO event attendee data intelligence can help businesses examine audience profiles, exhibitor participation, sponsors, gaming interests, session themes, geographic distribution, and engagement patterns. Because gaming audiences can include consumers, developers, publishers, esports organizations, creators, brands, and investors, segmentation is essential.

For this report, GAMESCO is treated as the specified event ecosystem rather than assigning unsupported attendee totals to it. This distinction matters because public event data is not always reported with the same methodology. A reliable intelligence dataset should separate confirmed attendance figures from estimated audience size and distinguish registered attendees from visitors, exhibitors, speakers, and online participants.

India's broader live-event ecosystem provides useful context. An EY/FICCI analysis reported that more than 30,000 live events were conducted in India in 2024 across more than 300 cities, while the organized live-events segment grew 15% in 2024. (Ministry of Information and Broadcasting)

Gaming/event intelligence dimension Example dataset Potential use
Attendee profile Role, company, geography Audience segmentation
Exhibitors Brand, category, booth Competitive mapping
Sponsors Sponsor and tier Partnership research
Sessions Topic, speaker, track Interest analysis
Engagement Interactions, registrations Campaign measurement
Geography City/country Expansion planning
2020–2026 evolution

The 2020–2022 period dramatically changed how gaming and entertainment audiences participated in events. Virtual sessions, online communities, livestreams, and digital networking created additional behavioral signals. As physical events returned, organizers increasingly combined digital and physical touchpoints.

India's organized events segment is a strong example. According to an EY/FICCI analysis, ticketed events increased fourfold over five years through 2024, while specialist events such as concerts, sporting events, activations, and government events reached 22% of events conducted by surveyed event-management companies. (Ministry of Information and Broadcasting)

By 2026, the opportunity lies in connecting attendee information with event context. A gaming company could identify which cities produce the strongest audience response, which sponsors repeatedly appear across relevant events, and which topics attract professional versus consumer audiences.

How Do India and U.S. Audiences Differ Across Major Events?

Cross-border event research requires consistent data fields. India USA conference attendee data Collection can help organizations compare event participation, company representation, job roles, industries, locations, speakers, sponsors, and engagement signals across the two markets. Attendee & Event Data Intelligence Report 2026 analysis becomes more useful when datasets from India and the USA use the same schema.

Databricks provides a practical example. Its 2026 World Tour combines Mumbai with several U.S. cities, allowing researchers to examine the same event brand across geographically different technology markets. (Databricks) The Bengaluru Databricks User Group also listed 458 members, demonstrating how local technology communities can supplement large conference datasets. (Databricks User Groups)

Market indicator India USA
Databricks World Tour presence Mumbai Dallas, Chicago, New York, Washington, Anaheim
Example local community Bengaluru User Group Multiple U.S. event cities
Major 2026 summit — San Francisco
Summit in-person attendance — 32,000+
World Tour overall attendance Part of 40,000+ global Part of 40,000+ global

The World Tour attendee figure is global rather than country-specific, so it should not be interpreted as India or U.S. attendance individually. (Databricks)

2020–2026 evolution

Between 2020 and 2026, international conference intelligence became more complex because event participation increasingly crossed physical and digital boundaries. The same conference could have in-person attendees, virtual viewers, speakers, sponsors, partners, and online communities.

India's event economy has also expanded beyond traditional metropolitan centers. EY/FICCI data highlighted more than 30,000 live events across over 300 Indian cities in 2024. (Ministry of Information and Broadcasting) A 2026 KPMG analysis estimated India's organized MICE activity at approximately ₹46,739 crore based on 2025 estimates, highlighting the economic significance of business events. (KPMG)

For cross-market analysis, businesses should normalize geography, company size, industry, attendee role, event type, and participation status. This makes India-versus-USA comparisons more meaningful and reduces misleading conclusions caused by different event formats.

How Can Event Data Support Market and Competitive Research?

Event data extraction for market analysis allows businesses to examine an event as a concentrated representation of a market. Attendee organizations, exhibitors, sponsors, speakers, session themes, and product categories can reveal where companies are investing and which topics are receiving attention.

A technology event can be analyzed to identify organizations entering AI, data engineering, cybersecurity, cloud infrastructure, or analytics. A gaming event can reveal publisher participation, developer ecosystems, hardware brands, esports organizations, and consumer engagement. The same methodology can be applied across different sectors.

Dataset Market-analysis question
Attendee companies Which organizations are participating?
Job roles Which decision-makers are present?
Sponsors Which brands are investing in the market?
Speakers Which experts influence the conversation?
Sessions Which subjects are gaining attention?
Exhibitors Which products and categories are represented?
Locations Where is market activity concentrated?

Databricks' 2026 Data + AI Summit included more than 240 sponsors and partners and more than 80 special-interest and networking events, showing how much market information can exist beyond the attendee count itself. (Databricks)

2020–2026 evolution

In 2020, market research around events often relied heavily on event brochures, exhibitor directories, press releases, and post-event surveys. By 2026, event intelligence can combine multiple public sources into a structured historical dataset.

India's organized events sector grew 15% in 2024, while the organized events industry was projected to reach ₹202 billion by 2027 in the cited EY/FICCI analysis. (Ministry of Information and Broadcasting) This growth increases the value of systematic event research.

A market analyst can compare year-over-year sponsor additions, exhibitor churn, company participation, speaker diversity, session topics, and geographic expansion. These signals can indicate market momentum even when conventional market-size statistics are unavailable.

How Can Combined Attendee and Event Data Generate Better Insights?

Attendee & Event Intelligence Data insights emerge when individual records are connected rather than analyzed independently. A company name becomes more valuable when linked to attendee roles, event participation, sponsors, sessions, speakers, locations, and historical appearances.

For example, a researcher could identify companies appearing at multiple technology events, classify them by industry, track their sponsorship levels, and measure whether their event participation is expanding. Similar analysis can be applied to gaming events by connecting developers, publishers, esports organizations, brands, and sponsors.

Intelligence layer Example insight
Attendee → Company Identify target accounts

Company → Events Track market participation

Company → Sponsors Identify strategic investment
Speaker → Topic Track thought leadership
Session → Engagement Identify high-interest subjects
Event → Geography Identify expansion markets
Year → Participation Measure market momentum

Databricks' 2026 event footprint illustrates the value of this approach: its World Tour spans 20 cities and 40,000+ attendees, while its Data + AI Summit brought together more than 32,000 in-person participants. (Databricks)

2020–2026 evolution

From 2020 through 2026, event analytics increasingly moved toward relationship-based intelligence. Rather than storing a simple attendee list, organizations can build connections between people, companies, events, sponsors, sessions, and industries.

This approach is particularly important as events become multi-format. An attendee may register for a conference, attend a session, interact with a sponsor, participate in a networking event, and later appear at another event. Connecting these signals can reveal audience journeys and account-level engagement.

By 2026, event intelligence can therefore function as a market graph rather than a static spreadsheet. The more consistently records are normalized over time, the easier it becomes to identify recurring companies, emerging sectors, influential speakers, and changing audience interests.

Can AI Improve Large-Scale Event Data Processing?

AI-Powered Scraping Services can improve the processing of large event datasets by helping classify companies, identify entities, categorize sessions, normalize job titles, detect duplicates, and organize unstructured event information. AI should complement—not replace—data validation and source controls.

The need for automation becomes apparent when event ecosystems contain thousands of records. Databricks' 2026 World Tour alone is planned across 20 cities with 800 sponsors and 40,000+ attendees. (Databricks) Its Data + AI Summit included more than 800 sessions and more than 240 sponsors and partners. (Databricks)

AI/data-processing function Example application
Entity recognition Identify companies and brands
Classification Categorize industries and job roles
Deduplication Remove repeated attendee/company records

Topic modeling Group sessions by subject
Sentiment analysis Evaluate public event discussions
Trend detection Identify rapidly growing topics
Matching Connect companies across events
Summarization Create executive event briefs
2020–2026 evolution

Between 2020 and 2026, automation progressed from basic extraction and spreadsheet processing toward intelligent classification and entity resolution. The increasing scale of event ecosystems makes manual processing inefficient, particularly when companies want historical datasets spanning multiple years and geographies.

Databricks itself demonstrates the increasing integration of AI into enterprise technology events. Its 2026 World Tour focuses on trusted enterprise AI, data, AI agents, governance, workshops, and practical deployment. (Databricks)

For event intelligence, AI can be applied after collection to classify attendees and organizations, standardize job titles, identify event themes, and connect related entities. The most effective workflow combines automated processing with validation rules and human review for ambiguous records.

Actowiz Solutions can help organizations turn fragmented event information into structured, analytics-ready datasets. The focus is not simply on collecting names or event pages but on building a repeatable data workflow aligned with a specific business objective.

The Attendee & Event Data Intelligence Report 2026 approach can support multiple use cases, including attendee profiling, event benchmarking, sponsor research, competitive intelligence, lead generation, market mapping, geographic analysis, and historical event tracking.

A structured workflow can include source discovery, permitted data collection, schema design, normalization, deduplication, validation, enrichment, storage, and recurring delivery. Data can then be prepared for dashboards, CRM systems, business intelligence platforms, or research databases.

For India and the USA, this approach is particularly valuable because event ecosystems differ in scale, format, geography, and reporting practices. Standardized fields make it easier to compare markets without confusing registration totals with actual attendance or mixing sponsors, exhibitors, speakers, and attendees.

The company can also design recurring monitoring programs so that new events, sponsors, speakers, exhibitors, and publicly available attendee information are captured over time. This creates a historical intelligence layer rather than a one-time event snapshot.

Conclusion

The Attendee & Event Data Intelligence Report 2026 demonstrates how event information can become a strategic source of market intelligence when attendee, company, sponsor, speaker, session, and engagement data are collected and analyzed systematically.

Databricks provides a strong example of the scale available in technology events. Its 2026 Data + AI World Tour spans 20 cities and 40,000+ attendees, while the 2026 Data + AI Summit brought together more than 32,000 in-person attendees from a global audience. (Databricks) India also presents a substantial opportunity: more than 30,000 live events were conducted across over 300 cities in 2024, while KPMG estimated organized MICE activity at approximately ₹46,739 crore based on 2025 estimates. (Ministry of Information and Broadcasting)

A reliable Web Crawling service can help organizations continuously discover relevant event pages, exhibitor directories, sponsor information, speaker profiles, session details, and other publicly available sources. Combined with Web Data Mining, these datasets can be transformed into market maps, audience profiles, competitive benchmarks, and recurring event intelligence.

The opportunity extends beyond Databricks and GAMESCO. The same framework can be applied to technology conferences, gaming conventions, trade shows, exhibitions, business forums, MICE events, and industry-specific gatherings across India, the USA, and other markets.

Partner with Actowiz Solutions to build scalable attendee and event data pipelines that transform fragmented event information into actionable audience, market, and competitive intelligence!

Social Proof That Converts

Trusted by Global Leaders Across Q-Commerce, Travel, Retail, and FoodTech

Our web scraping expertise is relied on by 4,000+ global enterprises including Zomato, Tata Consumer, Subway, and Expedia — helping them turn web data into growth.

4,000+ Enterprises Worldwide
50+ Countries Served
20+ Industries
Join 4,000+ companies growing with Actowiz →
Real Results from Real Clients

Hear It Directly from Our Clients

Watch how businesses like yours are using Actowiz data to drive growth.

▶
1 min
★★★★★
"Actowiz Solutions offered exceptional support with transparency and guidance throughout. Anna and Saga made the process easy for a non-technical user like me. Great service, fair pricing!"
TG
Thomas Galido
Co-Founder / Head of Product at Upright Data Inc.
▶
2 min
★★★★★
"Actowiz delivered impeccable results for our company. Their team ensured data accuracy and on-time delivery. The competitive intelligence completely transformed our pricing strategy."
II
Iulen Ibanez
CEO / Datacy.es
▶
1:30
★★★★★
"What impressed me most was the speed — we went from requirement to production data in under 48 hours. The API integration was seamless and the support team is always responsive."
FC
Febbin Chacko
-Fin, Small Business Owner
icons 4.8/5 Average Rating
icons 50+ Video Testimonials
icons 92% Client Retention
icons 50+ Countries Served

Join 4,000+ Companies Growing with Actowiz

From Zomato to Expedia — see why global leaders trust us with their data.

Why Global Leaders Trust Actowiz

Backed by automation, data volume, and enterprise-grade scale — we help businesses from startups to Fortune 500s extract competitive insights across the USA, UK, UAE, and beyond.

icons
7+
Years of Experience
Proven track record delivering enterprise-grade web scraping and data intelligence solutions.
icons
4,000+
Projects Delivered
Serving startups to Fortune 500 companies across 50+ countries worldwide.
icons
200+
In-House Experts
Dedicated engineers across scrapers, AI/ML models, APIs, and data quality assurance.
icons
9.2M
Automated Workflows
Running weekly across eCommerce, Quick Commerce, Travel, Real Estate, and Food industries.
icons
270+ TB
Data Transferred
Real-time and batch data scraping at massive scale, across industries globally.
icons
380M+
Pages Crawled Weekly
Scaled infrastructure for comprehensive global data coverage with 99% accuracy.

AI Solutions Engineered
for Your Needs

→
LLM-Powered Attribute Extraction: High-precision product matching using large language models for accurate data classification.
→
Advanced Computer Vision: Fine-grained object detection for precise product classification using text and image embeddings.
→
GPT-Based Analytics Layer: Natural language query-based reporting and visualization for business intelligence.
→
Human-in-the-Loop AI: Continuous feedback loop to improve AI model accuracy over time.
icons Product Matching icons Attribute Tagging icons Content Optimization icons Sentiment Analysis icons Prompt-Based Reporting

Connect the Dots Across
Your Retail Ecosystem

We partner with agencies, system integrators, and technology platforms to deliver end-to-end solutions across the retail and digital shelf ecosystem.

icons
Analytics Services
icons
Ad Tech
icons
Price Optimization
icons
Business Consulting
icons
System Integration
icons
Market Research
Become a Partner →

Popular Datasets — Ready to Download

Browse All Datasets →
icons
Amazon
eCommerce
Free 100 rows
icons
Zillow
Real Estate
Free 100 rows
icons
DoorDash
Food Delivery
Free 100 rows
icons
Walmart
Retail
Free 100 rows
icons
Booking.com
Travel
Free 100 rows
icons
Indeed
Jobs
Free 100 rows

Latest Insights & Resources

View All Resources →
thumb
Blog

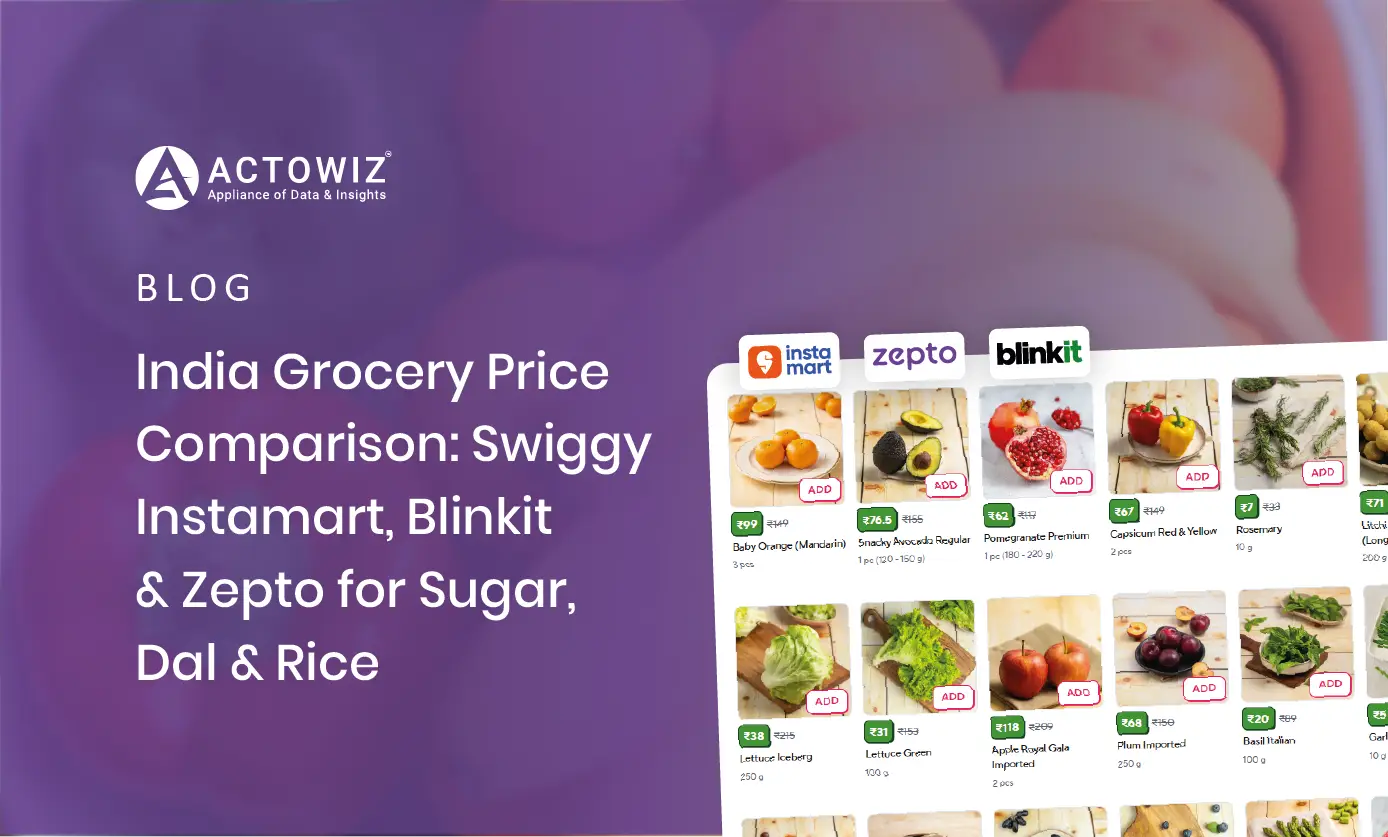
How India Grocery Price Comparison for Sugar, Dal & Rice Across Platforms Tracks Prices on Swiggy Instamart, Blinkit & Zepto

India Grocery Price Comparison for Sugar, Dal & Rice helps brands compare prices across BigBasket, Blinkit, Zepto, and JioMart for smarter pricing.

thumb
Case Study

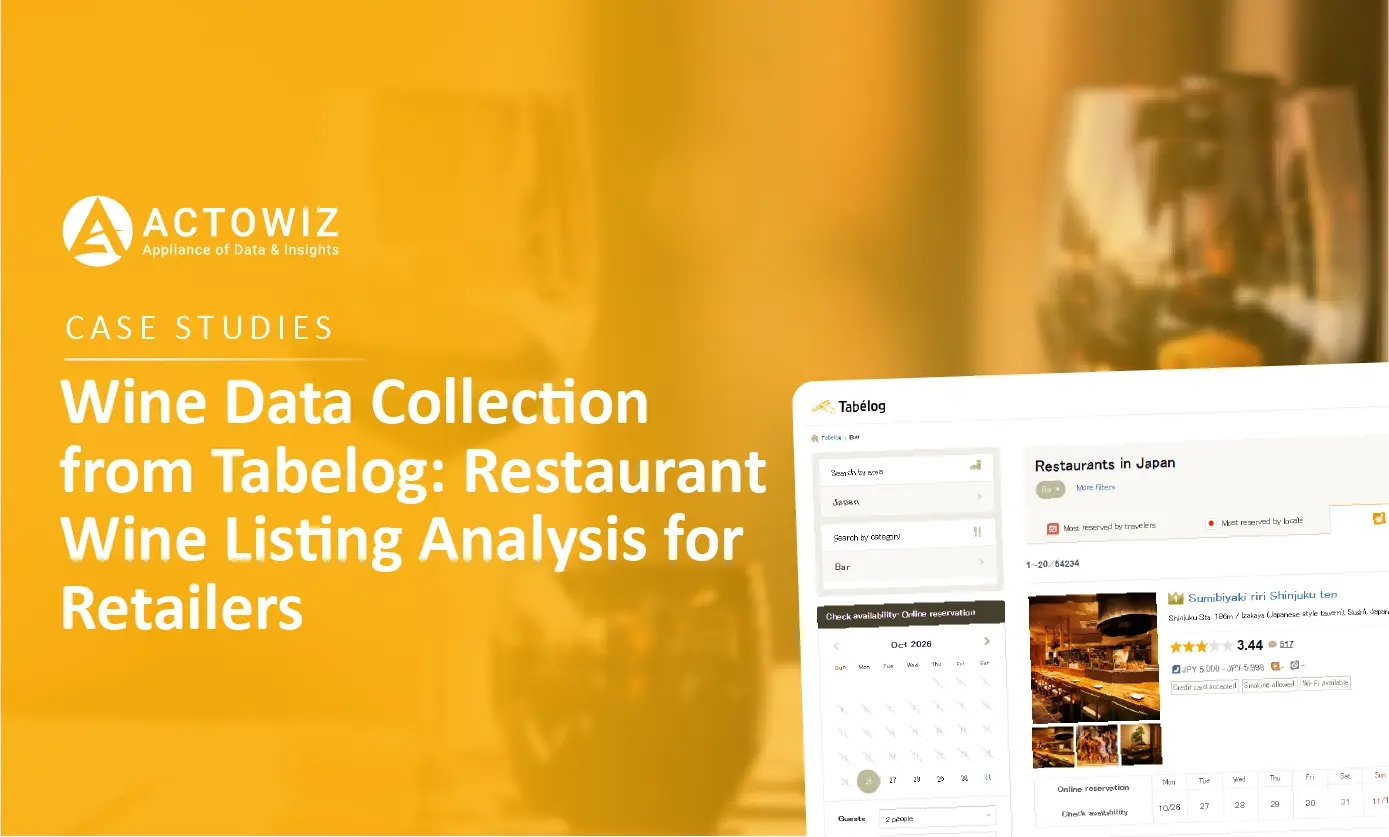
How We Helped a Wine Retailer Analyze Restaurant Wine Listings Using Wine Data Collection from Tabelog

Explore Wine Data Collection from Tabelog to analyze restaurant wine listings, compare prices, and uncover valuable market insights for your business.

thumb
Report

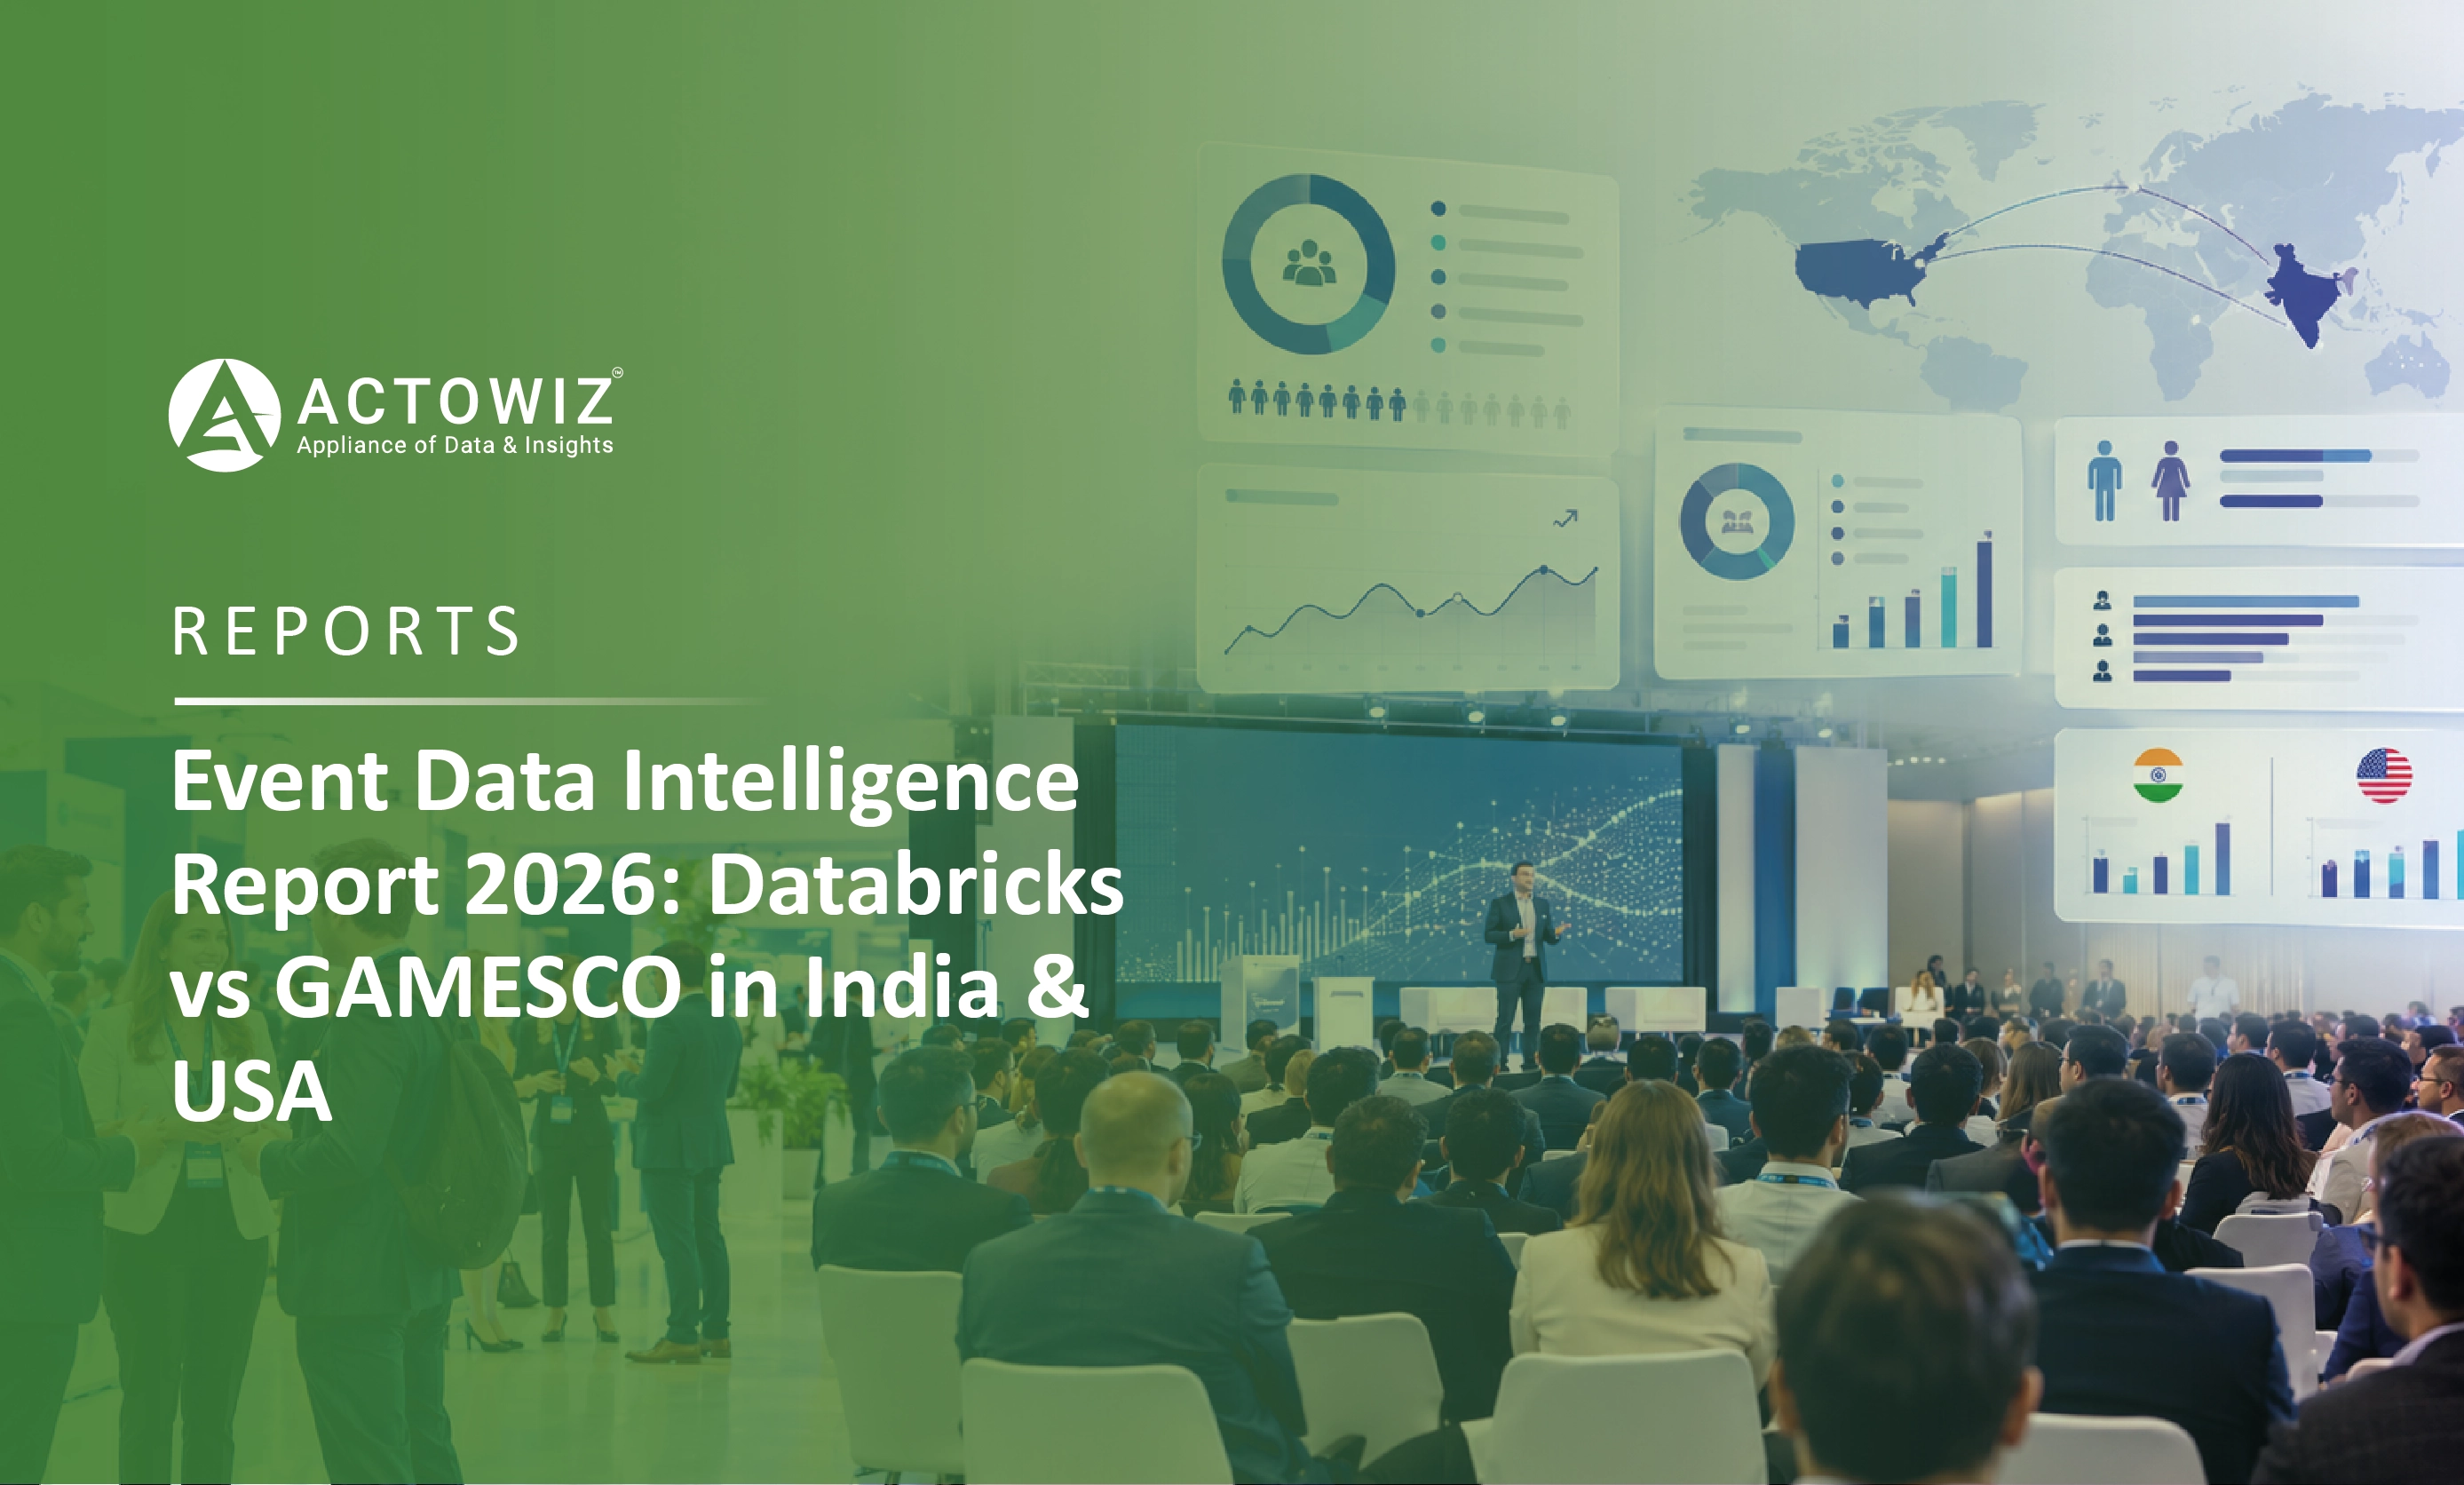
Attendee & Event Data Intelligence Report 2026 - DataBricks & GAMESCO in India/USA - Comparing Event Audiences, Engagement, and Market Insights

Attendee & Event Data Intelligence Report 2026 explores attendee, event, engagement, and market data to improve audience and competitive insights.

Start Where It Makes Sense for You

Whether you're a startup or a Fortune 500 — we have the right plan for your data needs.

icons
Enterprise
Book a Strategy Call
Custom solutions, dedicated support, volume pricing for large-scale needs.
icons
Growing Brand
Get Free Sample Data
Try before you buy — 500 rows of real data, delivered in 2 hours. No strings.
icons
Just Exploring
View Plans & Pricing
Transparent plans from $500/mo. Find the right fit for your budget and scale.

Request Free Sample Data

Our team will reach out within 2 hours with 500 rows of real data — no credit card required.

+1 ▼
✓ Free 500-row sample · No credit card · Response within 2 hours