🎃 HALLOWEEN OFF Spooky Savings Event! Get FLAT 20% OFF on all Web Scraping & Data Extraction Plans 20% OFF Web Scraping Plans!
Ends in: 00d : 00h : 00m : 00s
🦇
👻
🎃 Spooktacular Limited Offer

Don’t Let High Data Costs Haunt You! 🎃

Get FLAT 20% OFF

T&C Apply

Scrape competitor prices, monitor MAP, and extract real-time datasets at a spooky discount this Halloween.

Offer Expires In:
00d : 00h : 00m : 00s
⚡ Claim 20% Discount Now
🎃
Promo Code Copied!
SPOOKY30 (20% OFF Applied)
Core services
Enterprise Data Extraction

Scalable web, app and AI-powered collection across 40+ countries.

All 58 services →
New 2026
AI Training Data

Corpus building with provenance and opt-out compliance.

Learn more →
Free pilot
24-hour sample

We run collection on your own sources before you commit.

Get a sample →
58Services
40+Countries
DEVELOPER

Ready-Made Scrapers

Pre-built for top platforms. Self-serve, no setup.

View All →
TRY FREE

API Playground

Test endpoints instantly. No credit card.

Start Free →
28Tools
2SDKs
icons Delivery & SDKs
Streaming Crawl API Scheduler Realtime Alerts Webhook Delivery 🐍 Python SDK 💚 Node.js SDK

Need it managed instead?

Fixed monthly retainer, named engineer, no per-request metering.

Managed Data API →
HOT

Case Studies

How brands use Actowiz, with named outcomes.

Read →
FREE

Sample Datasets

Real output, no signup.

Download →
NEW

ROI Calculator

Model the return on a data engagement.

Calculate →
Jimmy Choo India Monthly E-Commerce Dataset

Introduction

India’s quick commerce sector has changed how consumers purchase groceries, dairy products, packaged foods, personal care items, and other everyday essentials. For FMCG manufacturers, grocery retailers, and market research teams, understanding product availability, pricing movements, assortment changes, and competitive positioning is increasingly important. Reliable digital shelf intelligence helps businesses evaluate market conditions and make better-informed commercial decisions.

The Milk Basket India Weekly Q-Commerce Dataset can serve as a focused data resource for studying product listings and weekly changes in the Milkbasket marketplace, provided the underlying collection includes the required fields and historical records. Through Quick Commerce Data Scraping, businesses can collect publicly accessible product information, prices, availability indicators, and product attributes for structured analysis, subject to applicable platform terms and access restrictions.

For Actowiz Solutions, the objective is to help businesses transform collected marketplace information into actionable insights. Instead of relying on assumptions about competitors or consumer demand, brands can use verified observations, consistent historical records, and clearly documented data sources to evaluate grocery market movements and identify areas that warrant further investigation.

Understanding Product-Level Price Changes and Promotional Activity

FMCG brands need consistent product-level observations to understand how listed prices and promotions change across online grocery channels. A Milk Basket India Weekly Products Pricing Dataset can organize product names, brand details, pack sizes, listed prices, promotional prices, and collection dates, where these fields are available from accessible listings. Such records help analysts distinguish a genuine price change from a difference caused by pack size, product variant, or temporary discount.

An AI Dynamic Pricing Software solution can use validated price histories as one input for pricing decisions. However, marketplace prices alone do not establish a competitor’s costs, margins, inventory position, or pricing strategy. Brands should combine observed prices with their own commercial data before changing retail prices.

India’s quick commerce market provides a strong reason to establish this monitoring process. According to the Bain and Flipkart How India Shops Online 2025 report, the sector’s gross merchandise value (GMV) increased from $1.5 billion in 2022 to an estimated $6–7 billion in 2024. These figures describe the overall market, not Milkbasket-specific sales or prices.

Year Verified market information
2020 No comparable Milkbasket-specific pricing figure is established by the cited sources.
2021 No comparable Milkbasket-specific pricing figure is established by the cited sources.
2022 Indian quick commerce GMV was reported at $1.5 billion.
2023 No annual Milkbasket-specific price series is established by the cited sources.
2024 Indian quick commerce GMV reached an estimated $6–7 billion.
2025 Bain and Flipkart published their report documenting the 2024 market figures.
2026 Full-year market results are not yet available as of October 15, 2026.

Source: Bain and Flipkart, How India Shops Online 2025. Missing Milkbasket-specific values are intentionally not estimated.

Weekly price histories can help businesses identify recurring discounts, compare equivalent pack sizes, and investigate unexpected price movements. The most useful output is a traceable record showing what changed, when it changed, and which source supports the observation.

Connecting Marketplace Records With Business Intelligence

Collecting product information is only the first step. Commercial teams also need a practical way to access, compare, and interpret the records. A Milk Basket SKU data API can make normalized product-level information available to internal applications, subject to the collection scope and the source platform’s permitted access methods.

A Quick-Commerce Dashboard can then display price histories, product availability, assortment changes, promotion observations, and differences between collection dates. Category managers can use these views to investigate whether a product disappeared from a listing, whether its displayed price changed, or whether a competitor introduced a new pack size.

For reliable comparisons, each product record should include a consistent identifier wherever possible, along with its brand, product title, pack quantity, variant, listing location, observed price, timestamp, and source URL. When a stable SKU identifier is unavailable, product matching should use multiple attributes rather than title alone. This reduces the risk of comparing different sizes or formulations as if they were the same product.

The broader market context supports the need for structured reporting. Bain and Flipkart reported that quick commerce accounted for approximately 70–75% of India’s e-grocery GMV in 2024, compared with around 35% in 2022. These are market-level estimates, not individual-platform shares.

A dashboard should separate directly observed information from calculated indicators. For example, the difference between two recorded prices is a calculation; the reason behind that difference is an interpretation that requires additional evidence.

Businesses can also use scheduled data delivery to reduce manual reporting. Daily or weekly collection schedules should be selected according to the volatility of the category, the business requirement, and the permitted frequency of source access. Reports should clearly identify missing observations and failed collection periods instead of silently treating unavailable records as zero.

Evaluating Category-Level Pricing and Historical Market Movements

A Milk Basket FMCG product pricing dataset India can help analysts examine differences in listed prices across product categories, pack sizes, and brands. For example, a category team may compare packaged dairy products, beverages, snacks, breakfast essentials, and household staples where these products are present in the collected listings. The analysis should reflect the actual assortment available in the selected market and collection period rather than assume that every category is listed.

The Milk Basket India Weekly Q-Commerce Dataset can support historical comparisons when archived records are available. A weekly snapshot collected in the present cannot independently establish what a product cost several years earlier. Reliable historical analysis requires dated source records, preserved snapshots, or another verifiable historical dataset.

The national market figures illustrate why businesses should distinguish broad industry expansion from individual product performance.

Indicator 2022 2024
Indian quick commerce GMV $1.5 billion $6–7 billion
Share of e-grocery GMV attributed to quick commerce Approximately 35% Approximately 70–75%
Source Bain and Flipkart Bain and Flipkart

Source: How India Shops Online 2025. Figures are reported market estimates, not Milkbasket-specific measurements.

These figures demonstrate the sector’s expansion between the reported years. They do not establish that every grocery category experienced the same growth, that every retailer changed prices at the same rate, or that Milkbasket’s individual sales followed the industry trend.

For FMCG companies, the practical approach is to compare historical observations within clearly defined product groups. Analysts can calculate changes in listed prices, track the frequency of observed promotions, and identify products that enter or leave the assortment. They should record changes in pack size, product specifications, and location alongside prices to preserve comparability.

When data for an earlier period is unavailable, the report should mark that period as missing. This is particularly important when presenting a 2020–2026 timeline: verified observations should be shown for their actual dates, while unverified historical values should not be interpolated or presented as measured results.

Comparing Prices Across Equivalent Grocery Products

Milk Basket Grocery price benchmarking can help category managers compare the listed prices of equivalent grocery products and investigate differences between brands, sizes, and variants. The first requirement is product normalization. A one-litre product should not be compared directly with a 500-millilitre pack without adjusting the unit price, and promotional prices should not be confused with standard listed prices.

A useful benchmarking process records the product identifier, brand, pack quantity, unit of measurement, displayed price, promotional price where applicable, observation date, and source. It should also capture location or serviceable area when pricing or availability varies by location.

For example, analysts can calculate a comparable price per kilogram or litre from a verified pack price and quantity. This is a mathematical normalization, not an additional market statistic. Any reported benchmark should explain whether it uses regular prices, promotional prices, or both.

Benchmarking field Why it matters

Product and brand Identifies the item being compared.
Pack size and unit Makes comparisons between different quantities meaningful.
Listed price Records the displayed selling price at collection time.
Promotional price Separates an observed offer from the standard listed price.
Collection timestamp Establishes when the observation was made.
Location or service area Helps identify geographic differences where the source exposes them.
Source URL Allows the original observation to be checked.

The table describes recommended data fields, not a claim that all these fields are currently available for every Milkbasket product.

Benchmarking also needs context. A lower price does not necessarily indicate a stronger competitor: product quality, pack format, promotions, fulfilment conditions, and availability may differ. Similarly, a product that is missing from a listing should not automatically be classified as out of stock unless the available evidence supports that conclusion.

Actowiz Solutions can help structure collected information into comparable records and reporting outputs. The resulting analysis can help businesses investigate pricing differences, monitor promotional activity, and prioritize further research. Decisions should be based on verified observations rather than assumptions about competitors’ margins or internal strategies.

Monitoring Availability and Assortment Changes Over Time

Real-Time Milkbasket inventory Monitoring can help grocery and FMCG teams track product availability signals and changes in visible listings, where the platform exposes this information and collection is permitted. For businesses managing frequently purchased essentials, availability is an important complement to pricing analysis: a competitive price has limited practical value if the product cannot be ordered in the relevant service area.

The Milk Basket India Weekly Q-Commerce Dataset can provide a historical view of assortment and availability when records are retained across collection dates. A well-designed process should distinguish between a product that is visibly available, one that is explicitly marked unavailable, and one for which availability could not be determined. These are different states and should not be combined into a single inventory figure.

Market-level figures provide context for the growing importance of this monitoring. Bain and Flipkart reported more than 20 million annual active quick commerce shoppers in India in 2024. Their report also estimated the sector’s workforce at approximately 400,000 for the first half of 2025. Neither figure measures Milkbasket’s customers, warehouse stock, or individual product availability.

An availability monitoring workflow can record:

  • Product listing status at each observation.
  • The displayed price and promotional status.
  • The date, time, and service area associated with the observation.
  • Changes in product titles, pack sizes, or listing identifiers.
  • Collection failures and periods where the status remains unknown.

Repeated observations can reveal whether a product is consistently listed or whether its visible status changes frequently. However, listing availability does not reveal actual warehouse inventory quantities unless those quantities are explicitly disclosed by the source. Nor does an unavailable listing automatically prove a supply-chain disruption.

For historical reporting covering 2020–2026, teams should use dated snapshots from the relevant periods. If the available records begin later, the report should state the coverage limitation clearly. A complete timeline is useful only when the underlying evidence supports it.

This distinction helps FMCG manufacturers investigate potential distribution gaps, assess assortment consistency, and identify products that may warrant further supply-chain review without overstating what public-facing marketplace data can establish.

Turning Collected Observations Into Market Intelligence

Milkbasket Quick commerce market Data intelligence brings product, pricing, assortment, and availability observations together to support commercial analysis. Its value depends on whether the underlying data is accurate, comparable, sufficiently current, and linked to verifiable sources.

For grocery and FMCG companies, the analytical workflow can begin with a defined set of products and service areas. Teams can then establish a collection schedule, validate product matches, preserve dated records, and review changes against a consistent baseline. Category managers may use the resulting reports to investigate pricing movements, identify assortment gaps, and compare the visibility of selected products.

Industry evidence shows why this work merits attention. Bain and Flipkart estimated that quick commerce accounted for roughly half of incremental e-retail growth in India between 2023 and 2024. Their report also projected annual quick commerce growth above 40% through 2030. The first figure describes the reported historical period; the second is a forecast, not a confirmed future result.

The table below separates established observations from the data required for product-level analysis.

Analysis area What the evidence can establish What additional data is needed
Price movements Recorded prices at specific times Consistent historical product observations
Promotions Offers displayed during collection Dated records and offer conditions
Assortment Products visible in captured listings Repeated snapshots and product matching
Availability Status displayed by the source Reliable status fields and service-area context
Market growth Published industry-level estimates A separate, verified Milkbasket dataset for platform-specific findings
2026 performance Observations collected during 2026 Dated data covering the relevant period; full-year results are not yet available

A sound market intelligence process does not turn national growth figures into claims about a particular platform or product. Instead, it combines published industry research with directly collected marketplace observations, keeping the two evidence types distinct.

For decision-makers, the outcome is a clearer record of what changed, where the change occurred, and which questions require additional investigation. That supports more defensible commercial decisions than relying on isolated screenshots, unverified competitor claims, or unsupported estimates.

How Actowiz Solutions Can Help

Actowiz Solutions provides data collection and extraction services that can help businesses build structured datasets from accessible online sources. Its published web scraping services cover product information, pricing, stock indicators, and marketplace listings, with delivery workflows tailored to defined requirements.

For brands researching Milkbasket, Milk Basket India Weekly Q-Commerce Dataset requirements can be translated into a defined collection scope, a standardized data schema, and a reporting workflow. The final coverage depends on source accessibility, available historical records, and permitted collection methods.

Actowiz Solutions can support the process through the following capabilities.

  • Product and price collection: Gather accessible product listings, brand attributes, pack sizes, and displayed prices to support structured comparisons.
  • Scheduled data collection: Configure collection frequencies according to business needs and source restrictions, with timestamps that help analysts understand when each observation was recorded.
  • Data validation and normalization: Standardize product attributes, identify potential duplicate records, and flag inconsistent or missing fields before analysis.
  • API and dashboard integration: Deliver structured records through suitable formats or integrations, depending on project requirements, so business teams can use the data in their reporting systems.
  • Availability and assortment analysis: Track visible listing changes and reported availability indicators where these are exposed by the source.
  • Historical reporting: Maintain dated snapshots from the point collection begins, allowing businesses to build a verifiable history rather than rely on invented historical values.

Actowiz Solutions also offers mobile app scraping services for publicly visible in-app information. App-based collection may be useful when relevant listings or offers appear differently in an application than on a website. Actual coverage depends on technical feasibility, access permissions, and applicable platform requirements.

Every engagement should define the required fields, source coverage, refresh frequency, data quality checks, and delivery format before implementation. Where historical information is unavailable, the output should identify the limitation instead of filling gaps with estimates. This approach makes the resulting dataset more suitable for audits, internal reporting, and evidence-based market analysis.

Conclusion

Quick commerce has become an important part of India’s digital grocery landscape, making reliable product-level information increasingly valuable to FMCG brands, grocery retailers, and market researchers. The strongest analysis combines verified market research with dated observations of product prices, promotions, assortment, and visible availability.

The Milk Basket India Weekly Q-Commerce Dataset can support this work when its records are collected consistently, validated carefully, and linked to traceable sources. Historical conclusions should reflect the actual coverage of the dataset, while market statistics and forecasts should retain their original context and attribution.

Actowiz Solutions can help businesses establish data collection workflows that support competitive benchmarking, pricing research, assortment monitoring, and market intelligence. Through structured Web Scraping, appropriate Mobile App Scraping, and a Real-time dataset tailored to agreed collection requirements, organizations can build a more reliable foundation for commercial decisions. Refresh rates and historical coverage depend on the source and project scope.

Ready to strengthen your quick commerce market research? Contact Actowiz Solutions to discuss your data collection requirements and explore a dataset tailored to your business needs.

You can also reach us for all your mobile app scraping, data collection, web scraping, and instant data scraper service requirements!

Social Proof That Converts

Trusted by Global Leaders Across Q-Commerce, Travel, Retail, and FoodTech

Our web scraping expertise is relied on by 4,000+ global enterprises including Zomato, Tata Consumer, Subway, and Expedia — helping them turn web data into growth.

4,000+ Enterprises Worldwide
50+ Countries Served
20+ Industries
Join 4,000+ companies growing with Actowiz →
Real Results from Real Clients

Hear It Directly from Our Clients

Watch how businesses like yours are using Actowiz data to drive growth.

▶
1 min
★★★★★
"Actowiz Solutions offered exceptional support with transparency and guidance throughout. Anna and Saga made the process easy for a non-technical user like me. Great service, fair pricing!"
TG
Thomas Galido
Co-Founder / Head of Product at Upright Data Inc.
▶
2 min
★★★★★
"Actowiz delivered impeccable results for our company. Their team ensured data accuracy and on-time delivery. The competitive intelligence completely transformed our pricing strategy."
II
Iulen Ibanez
CEO / Datacy.es
▶
1:30
★★★★★
"What impressed me most was the speed — we went from requirement to production data in under 48 hours. The API integration was seamless and the support team is always responsive."
FC
Febbin Chacko
-Fin, Small Business Owner
icons 4.8/5 Average Rating
icons 50+ Video Testimonials
icons 92% Client Retention
icons 50+ Countries Served

Join 4,000+ Companies Growing with Actowiz

From Zomato to Expedia — see why global leaders trust us with their data.

Why Global Leaders Trust Actowiz

Backed by automation, data volume, and enterprise-grade scale — we help businesses from startups to Fortune 500s extract competitive insights across the USA, UK, UAE, and beyond.

icons
7+
Years of Experience
Proven track record delivering enterprise-grade web scraping and data intelligence solutions.
icons
4,000+
Projects Delivered
Serving startups to Fortune 500 companies across 50+ countries worldwide.
icons
200+
In-House Experts
Dedicated engineers across scrapers, AI/ML models, APIs, and data quality assurance.
icons
9.2M
Automated Workflows
Running weekly across eCommerce, Quick Commerce, Travel, Real Estate, and Food industries.
icons
270+ TB
Data Transferred
Real-time and batch data scraping at massive scale, across industries globally.
icons
380M+
Pages Crawled Weekly
Scaled infrastructure for comprehensive global data coverage with 99% accuracy.

AI Solutions Engineered
for Your Needs

→
LLM-Powered Attribute Extraction: High-precision product matching using large language models for accurate data classification.
→
Advanced Computer Vision: Fine-grained object detection for precise product classification using text and image embeddings.
→
GPT-Based Analytics Layer: Natural language query-based reporting and visualization for business intelligence.
→
Human-in-the-Loop AI: Continuous feedback loop to improve AI model accuracy over time.
icons Product Matching icons Attribute Tagging icons Content Optimization icons Sentiment Analysis icons Prompt-Based Reporting

Connect the Dots Across
Your Retail Ecosystem

We partner with agencies, system integrators, and technology platforms to deliver end-to-end solutions across the retail and digital shelf ecosystem.

icons
Analytics Services
icons
Ad Tech
icons
Price Optimization
icons
Business Consulting
icons
System Integration
icons
Market Research
Become a Partner →

Popular Datasets — Ready to Download

Browse All Datasets →
icons
Amazon
eCommerce
Free 100 rows
icons
Zillow
Real Estate
Free 100 rows
icons
DoorDash
Food Delivery
Free 100 rows
icons
Walmart
Retail
Free 100 rows
icons
Booking.com
Travel
Free 100 rows
icons
Indeed
Jobs
Free 100 rows

Latest Insights & Resources

View All Resources →
thumb
Blog

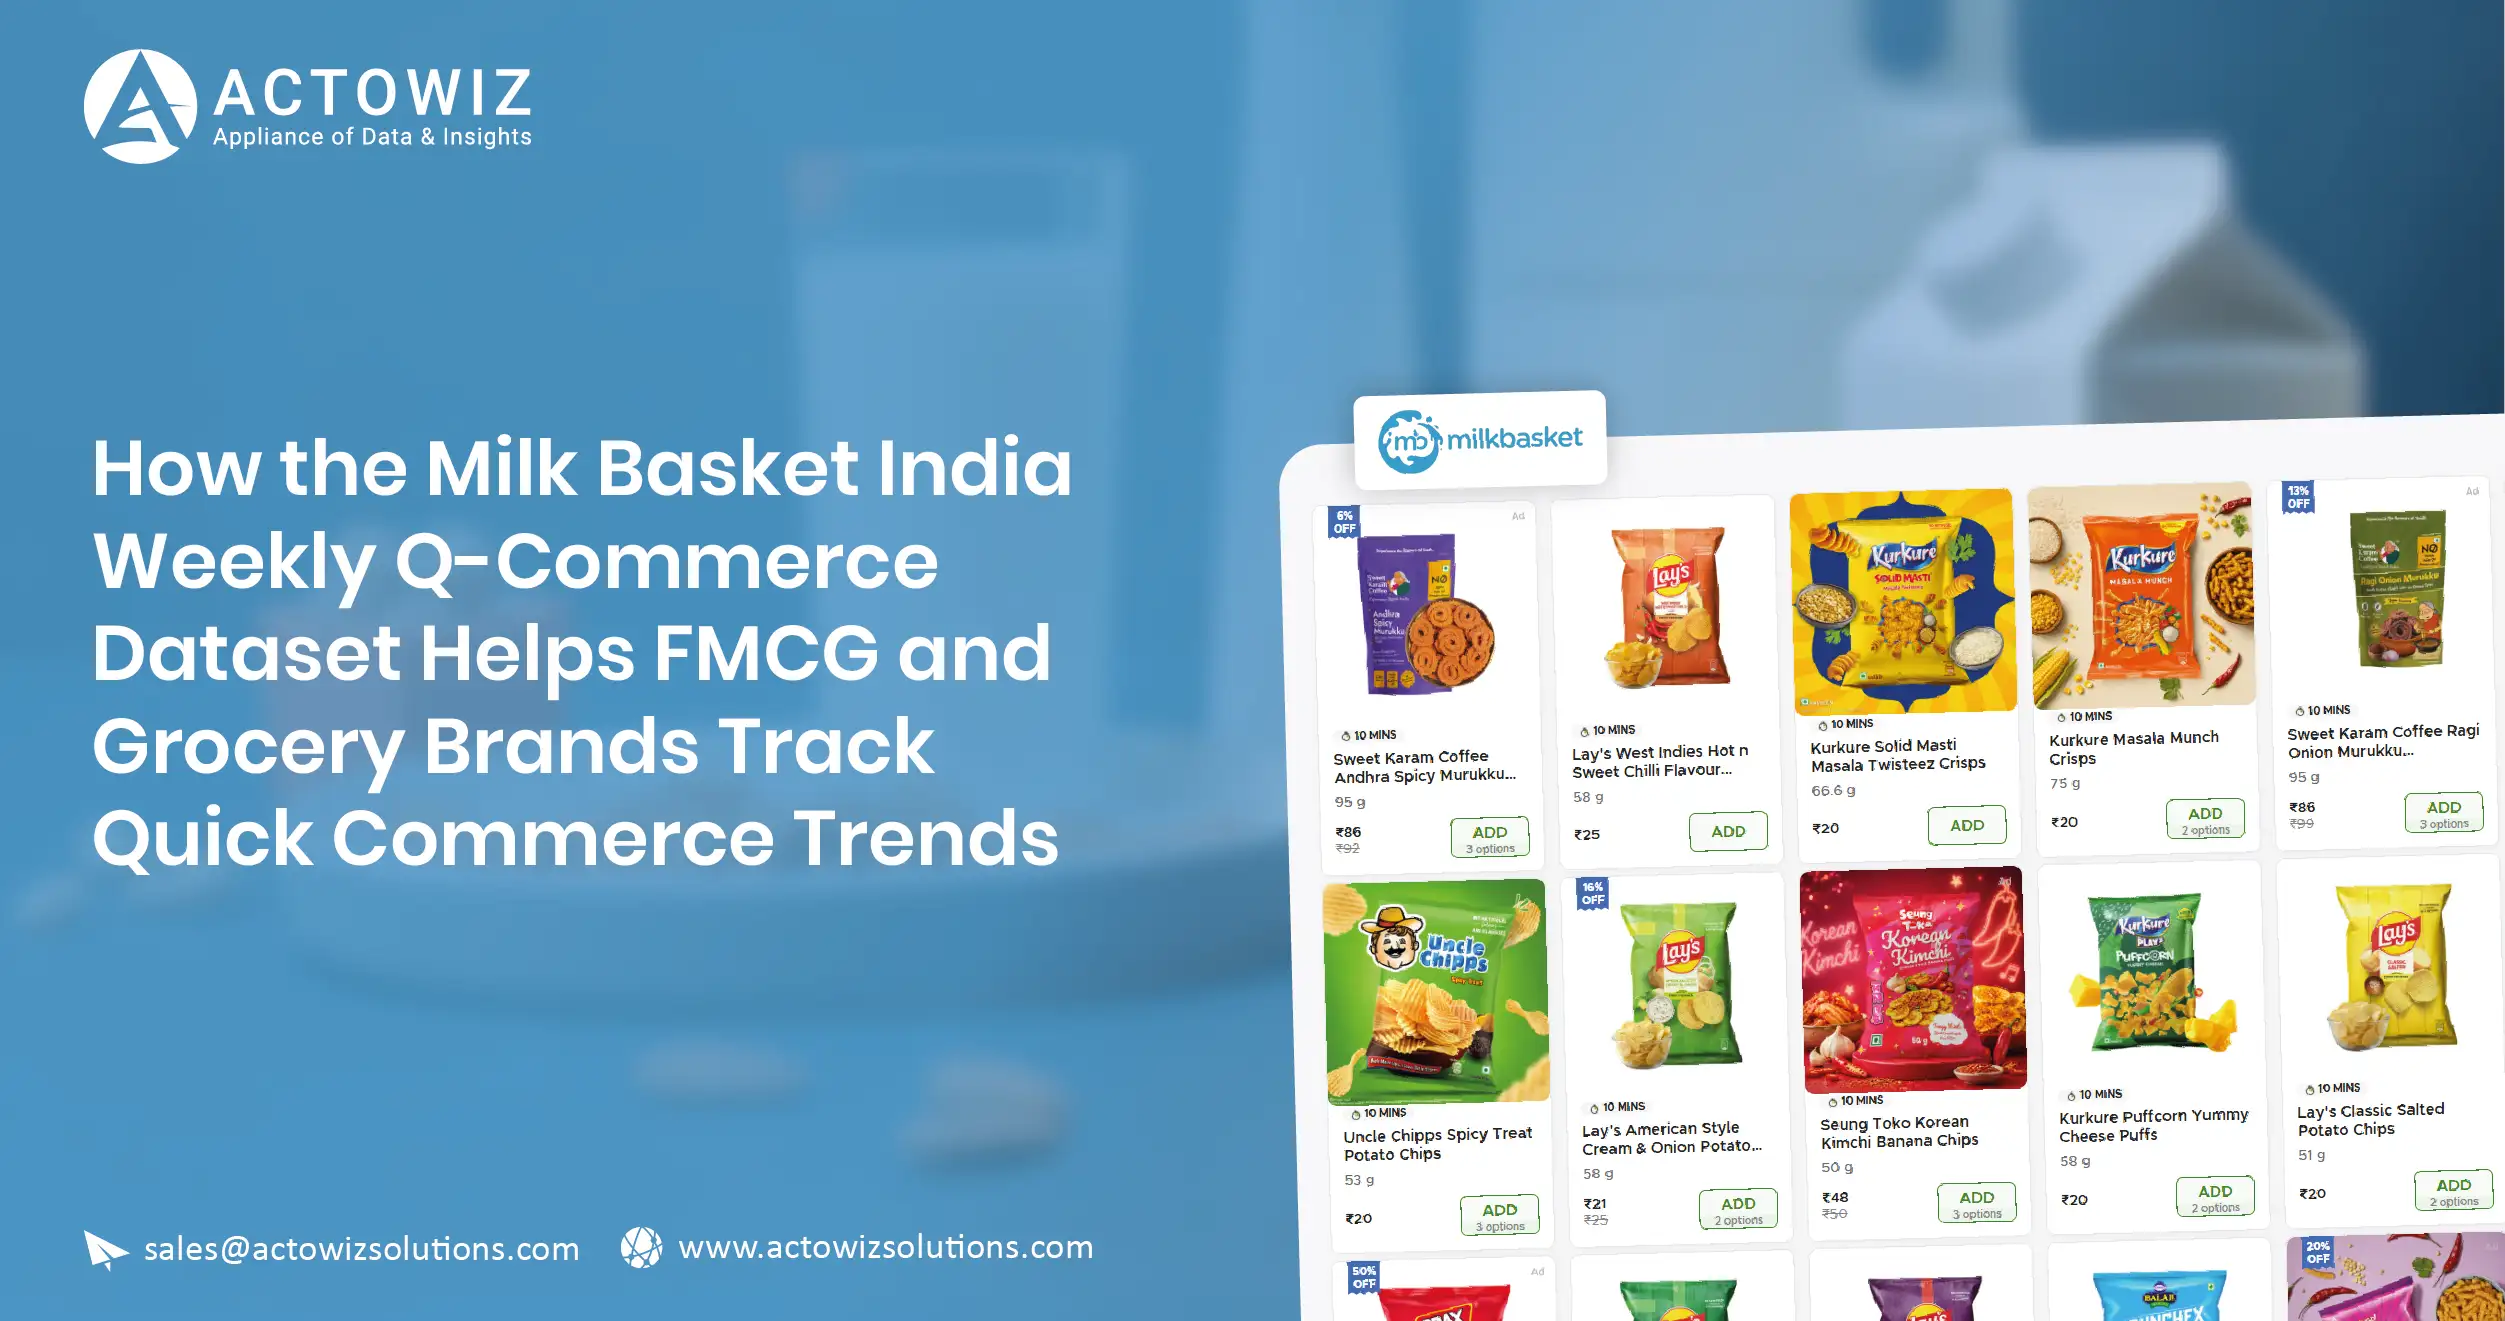
How the Milk Basket India Weekly Q-Commerce Dataset Helps FMCG and Grocery Brands Track Quick Commerce Trends

Explore the Milk Basket India Weekly Q-Commerce Dataset to track FMCG pricing, grocery trends, and quick commerce market insights.

thumb
Case Study

How We Helped a Retail Business Improve Product Data Accessibility with Product database & storage API

Simplify product data management with a Product database & storage API for organized storage, efficient access, and scalable business operations.

thumb
Report

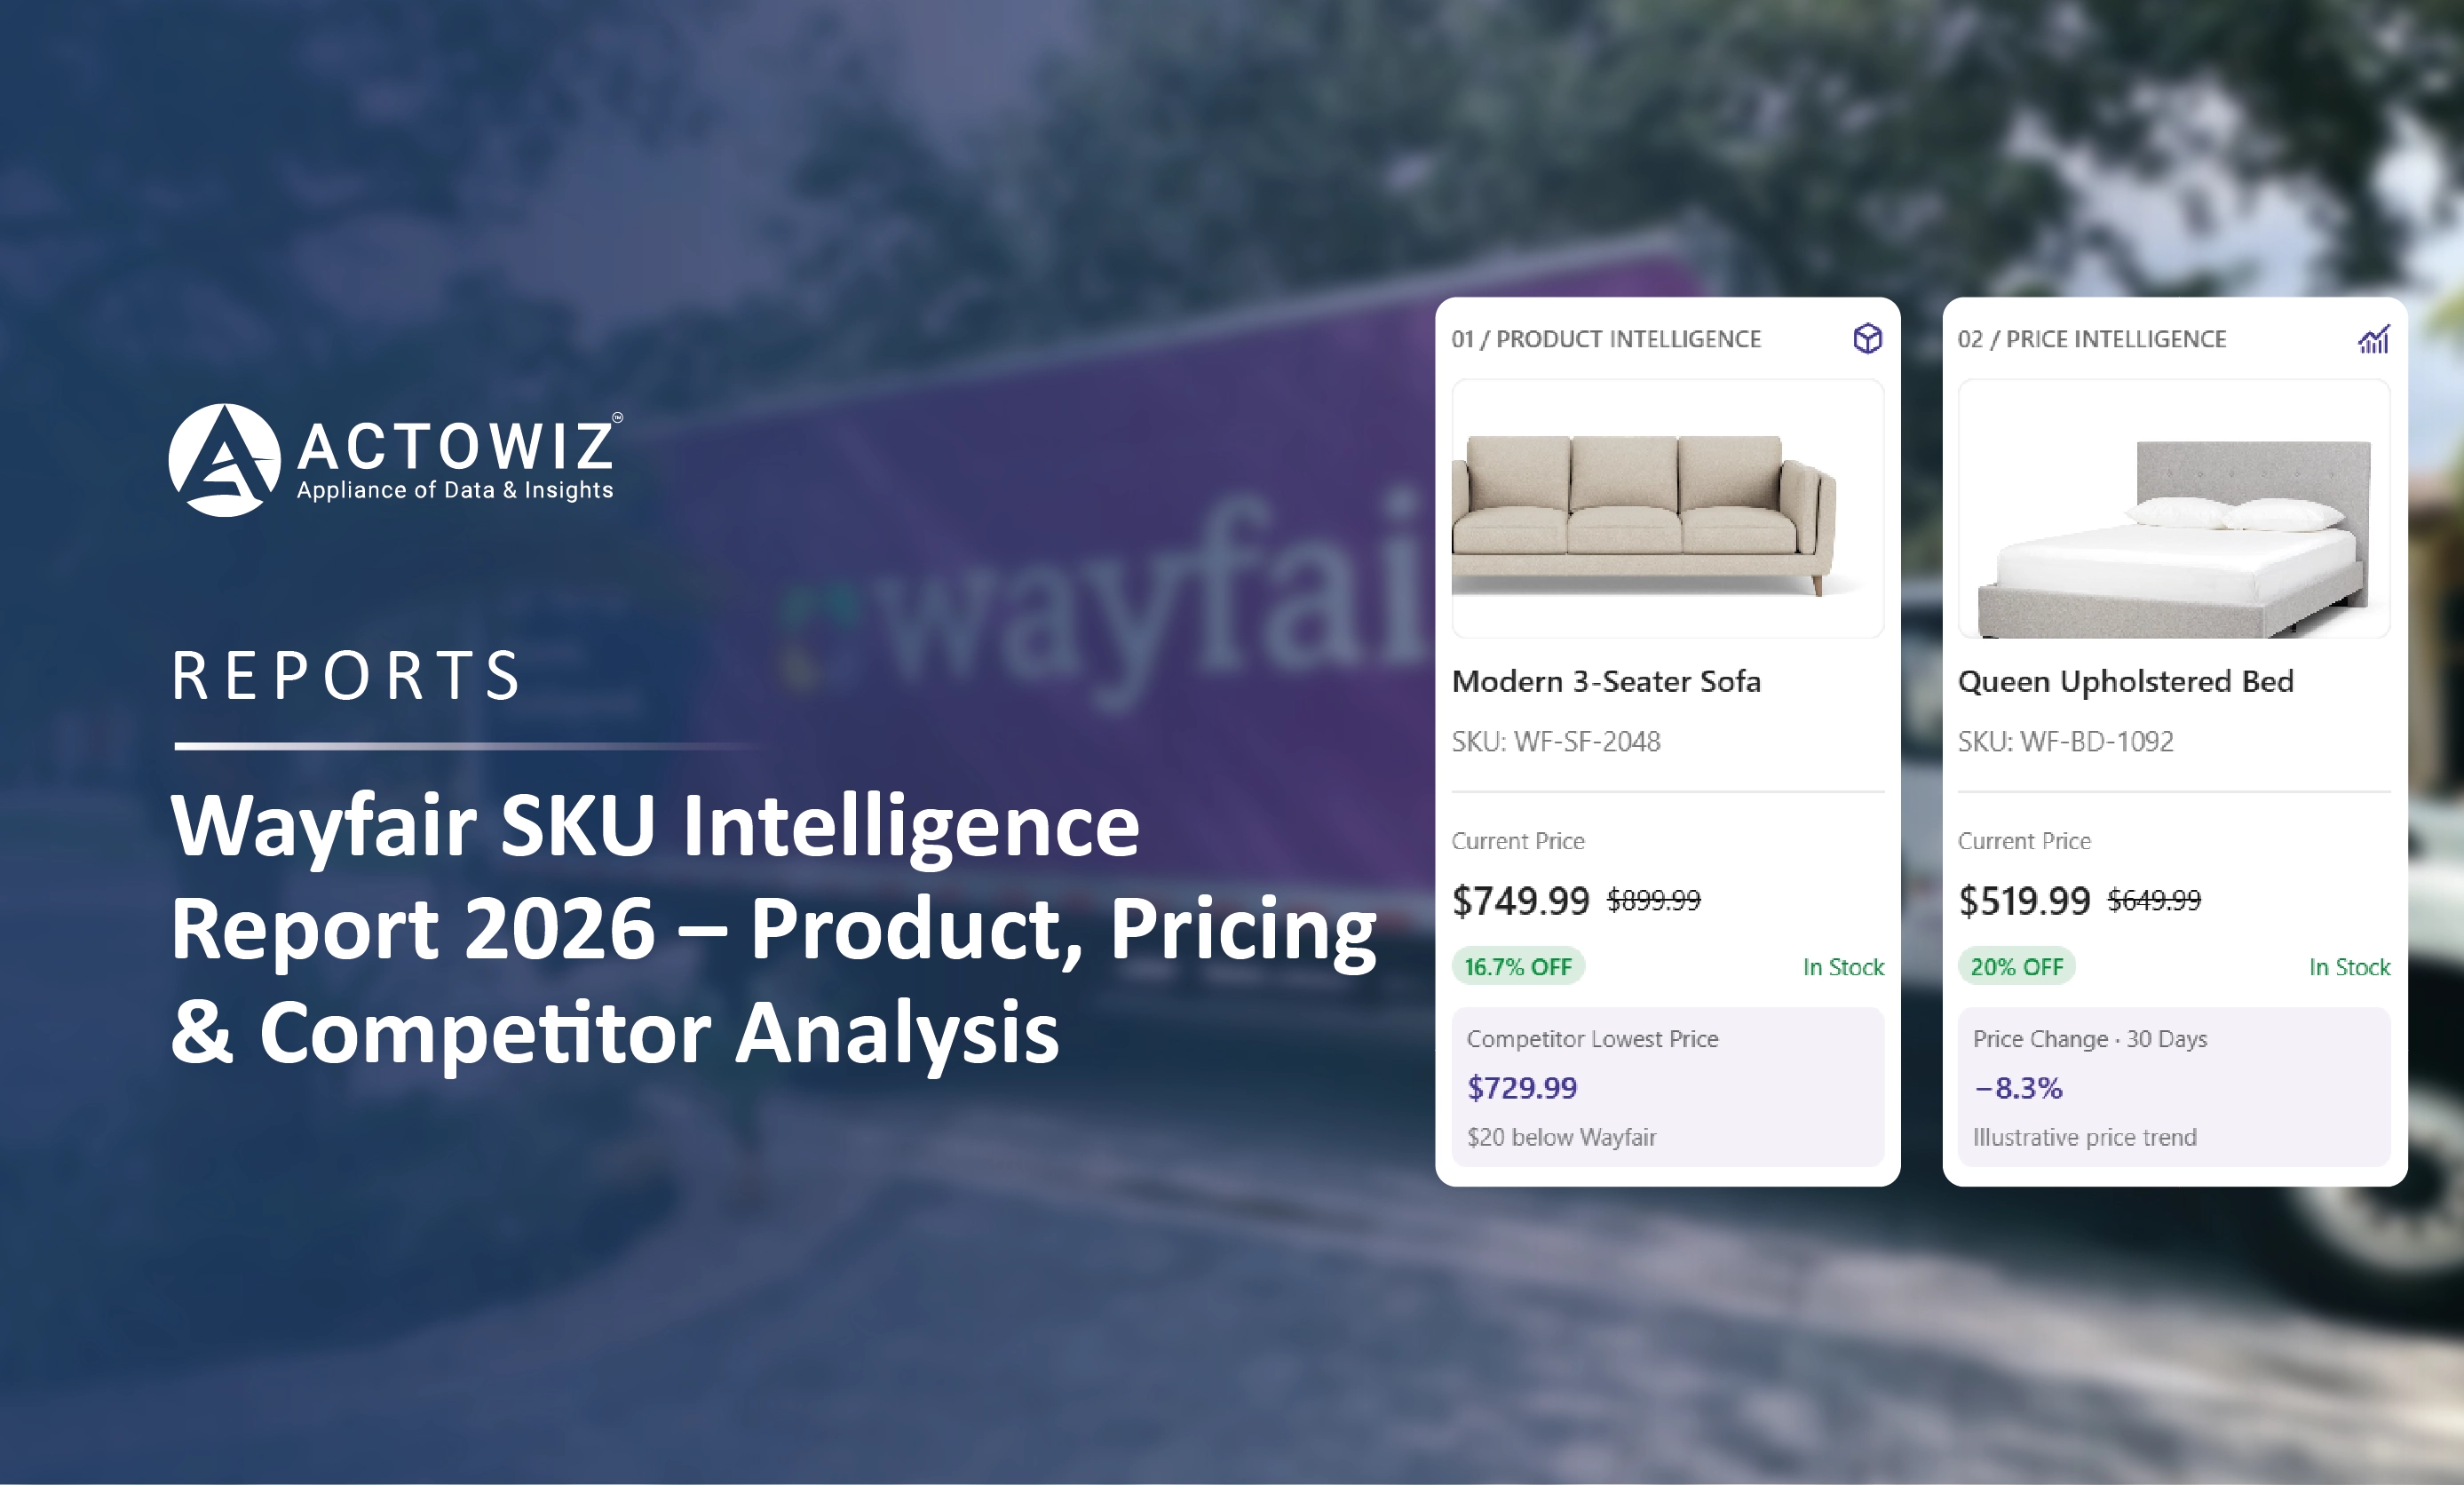
Wayfair SKU Data Intelligence Report 2026 - Home & Furniture, E-Commerce - Comparing Products, Prices, Assortment, and Competitors

Wayfair SKU Data Intelligence Report 2026 explores SKU, product, pricing, assortment, and competitor data for smarter home and furniture decisions.

Start Where It Makes Sense for You

Whether you're a startup or a Fortune 500 — we have the right plan for your data needs.

icons
Enterprise
Book a Strategy Call
Custom solutions, dedicated support, volume pricing for large-scale needs.
icons
Growing Brand
Get Free Sample Data
Try before you buy — 500 rows of real data, delivered in 2 hours. No strings.
icons
Just Exploring
View Plans & Pricing
Transparent plans from $500/mo. Find the right fit for your budget and scale.
Get in Touch
Let's Talk About
Your Data Needs
Tell us what data you need — we'll scope it for free and share a sample within hours.
  • icons
    Free Sample in 2 HoursShare your requirement, get 500 rows of real data — no commitment.
  • icons
    Plans from $500/monthFlexible pricing for startups, growing brands, and enterprises.
  • icons
    US-Based SupportOffices in New York & California. Aligned with your timezone.
  • icons
    ISO 9001 & 27001 CertifiedEnterprise-grade security and quality standards.
Request Free Sample Data
Fill the form below — our team will reach out within 2 hours.
+1 ▼
✓ Free 500-row sample · No credit card · Response within 2 hours

Request Free Sample Data

Our team will reach out within 2 hours with 500 rows of real data — no credit card required.

+1 ▼
✓ Free 500-row sample · No credit card · Response within 2 hours