Core services
Enterprise Data Extraction

Scalable web, app and AI-powered collection across 40+ countries.

All 58 services →
New 2026
AI Training Data

Corpus building with provenance and opt-out compliance.

Learn more →
Free pilot
24-hour sample

We run collection on your own sources before you commit.

Get a sample →
58Services
40+Countries
DEVELOPER

Ready-Made Scrapers

Pre-built for top platforms. Self-serve, no setup.

View All →
TRY FREE

API Playground

Test endpoints instantly. No credit card.

Start Free →
28Tools
2SDKs
icons Delivery & SDKs
Streaming Crawl API Scheduler Realtime Alerts Webhook Delivery 🐍 Python SDK 💚 Node.js SDK

Need it managed instead?

Fixed monthly retainer, named engineer, no per-request metering.

Managed Data API →
HOT

Case Studies

How brands use Actowiz, with named outcomes.

Read →
FREE

Sample Datasets

Real output, no signup.

Download →
NEW

ROI Calculator

Model the return on a data engagement.

Calculate →
Crex Data Scraping - Solving Accuracy and Data Consistency Issues in Cricket Analytics

Introduction

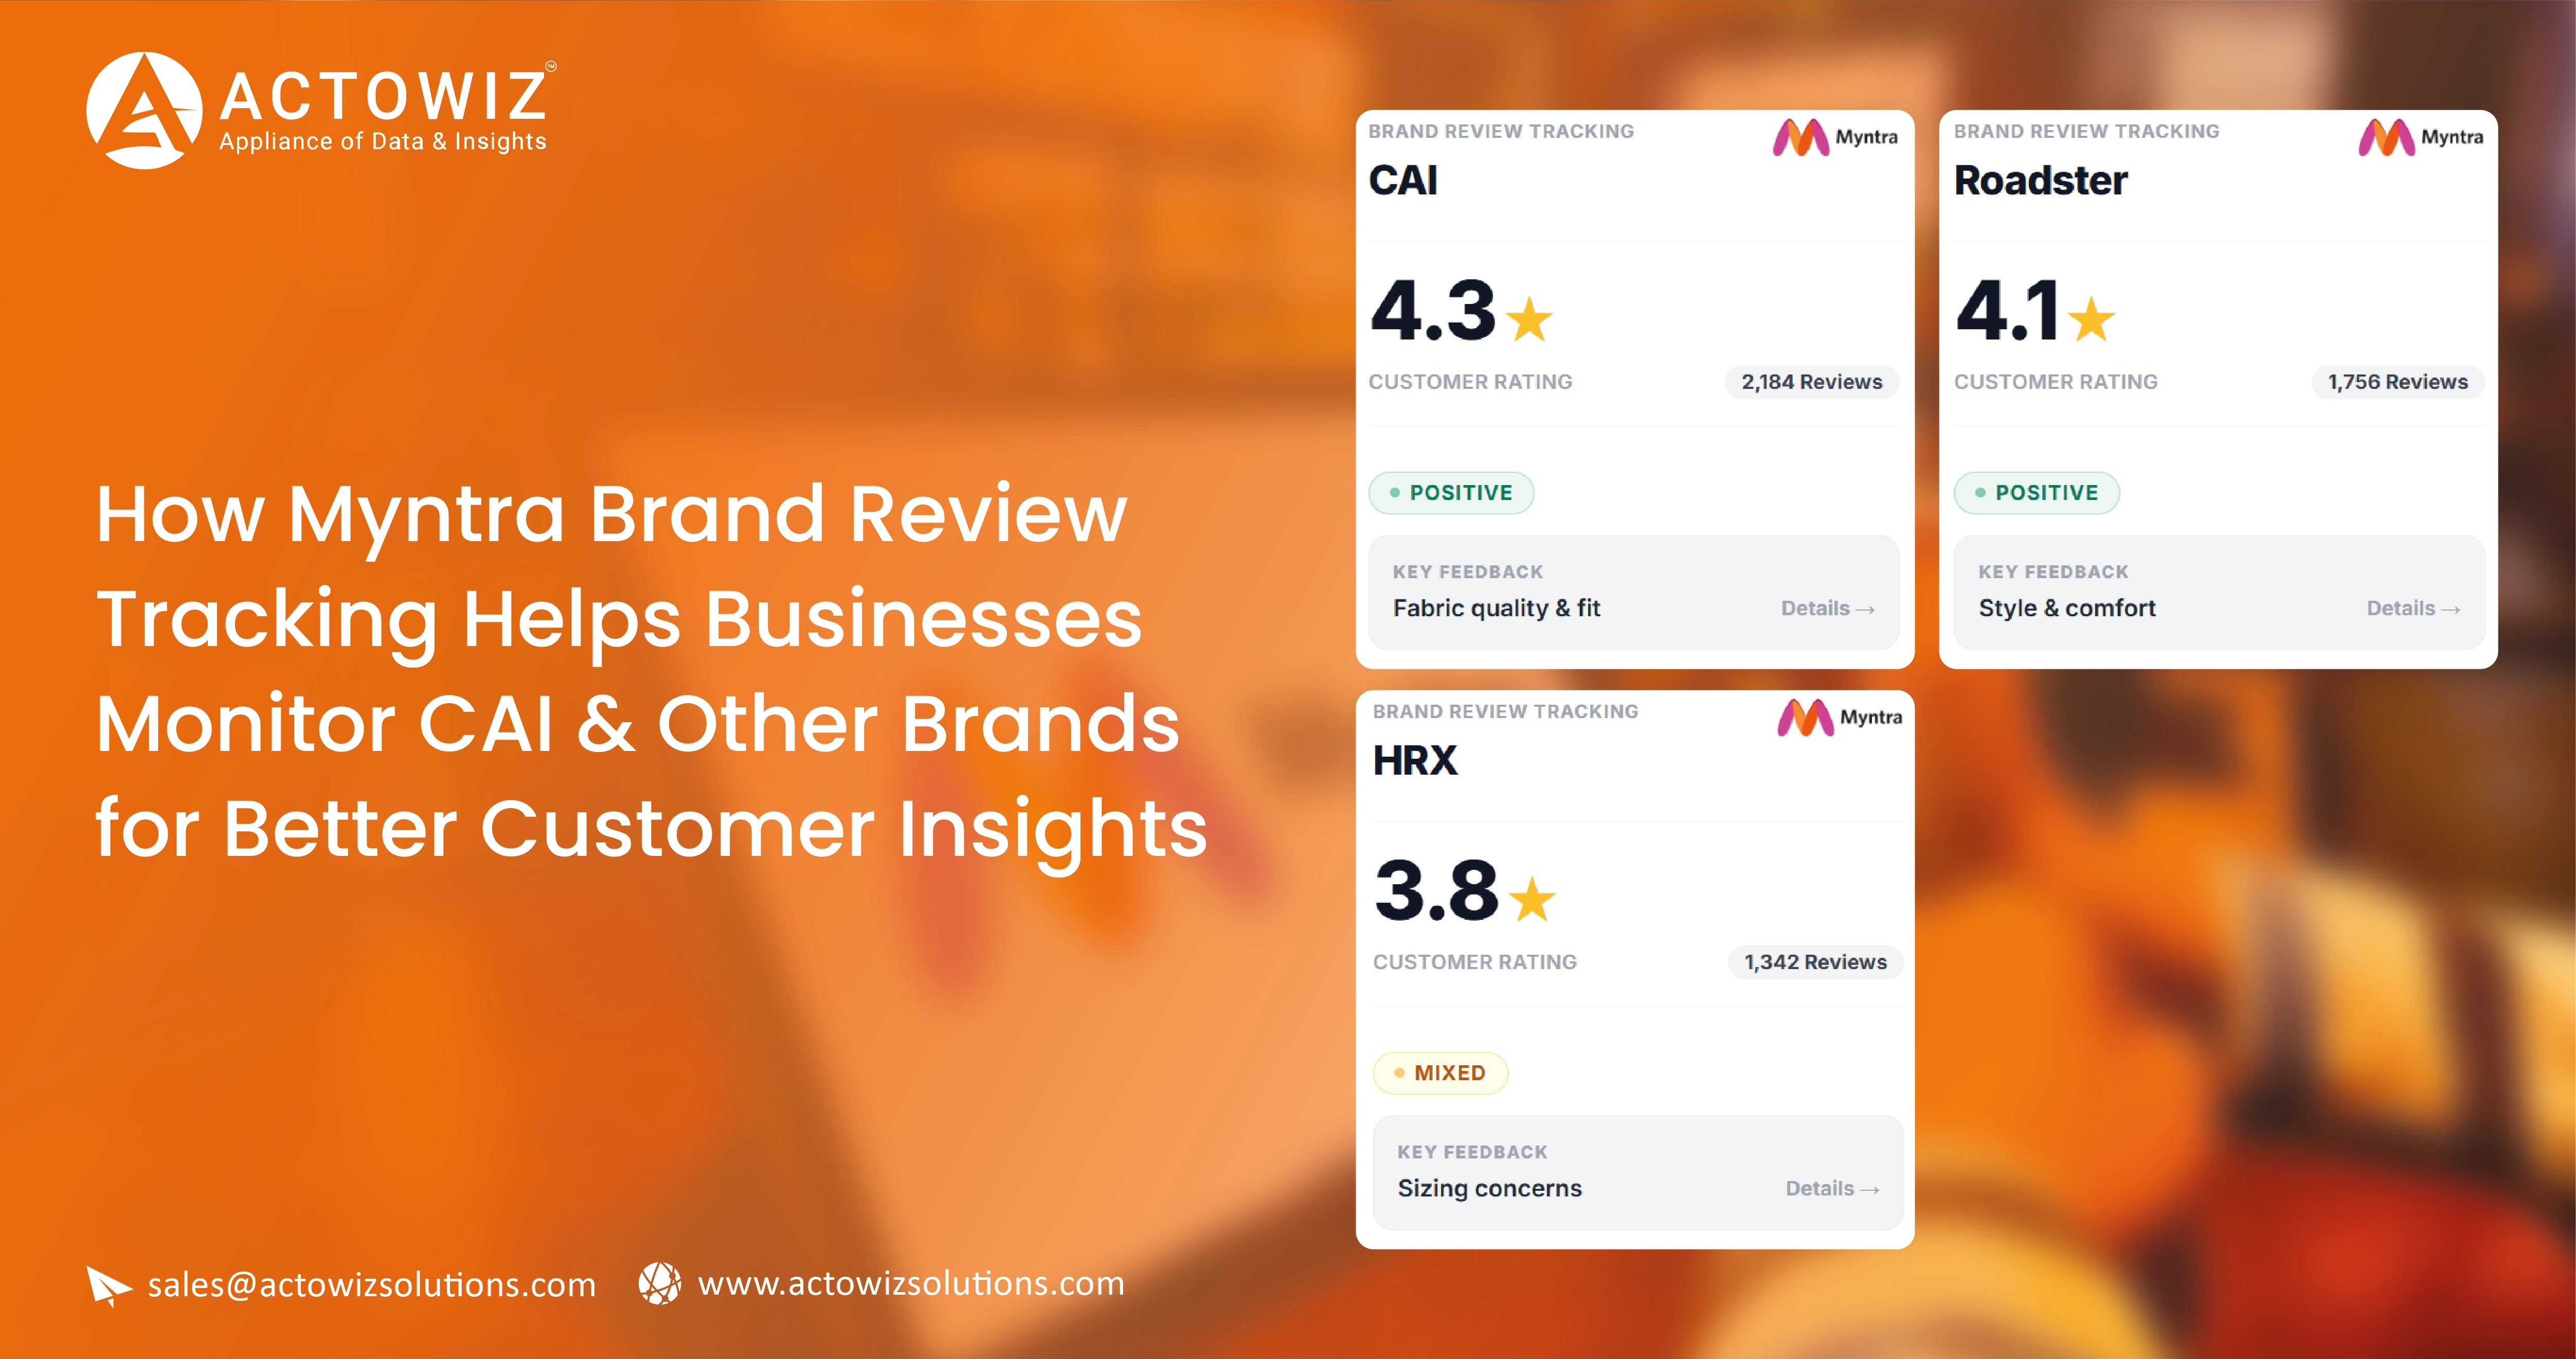
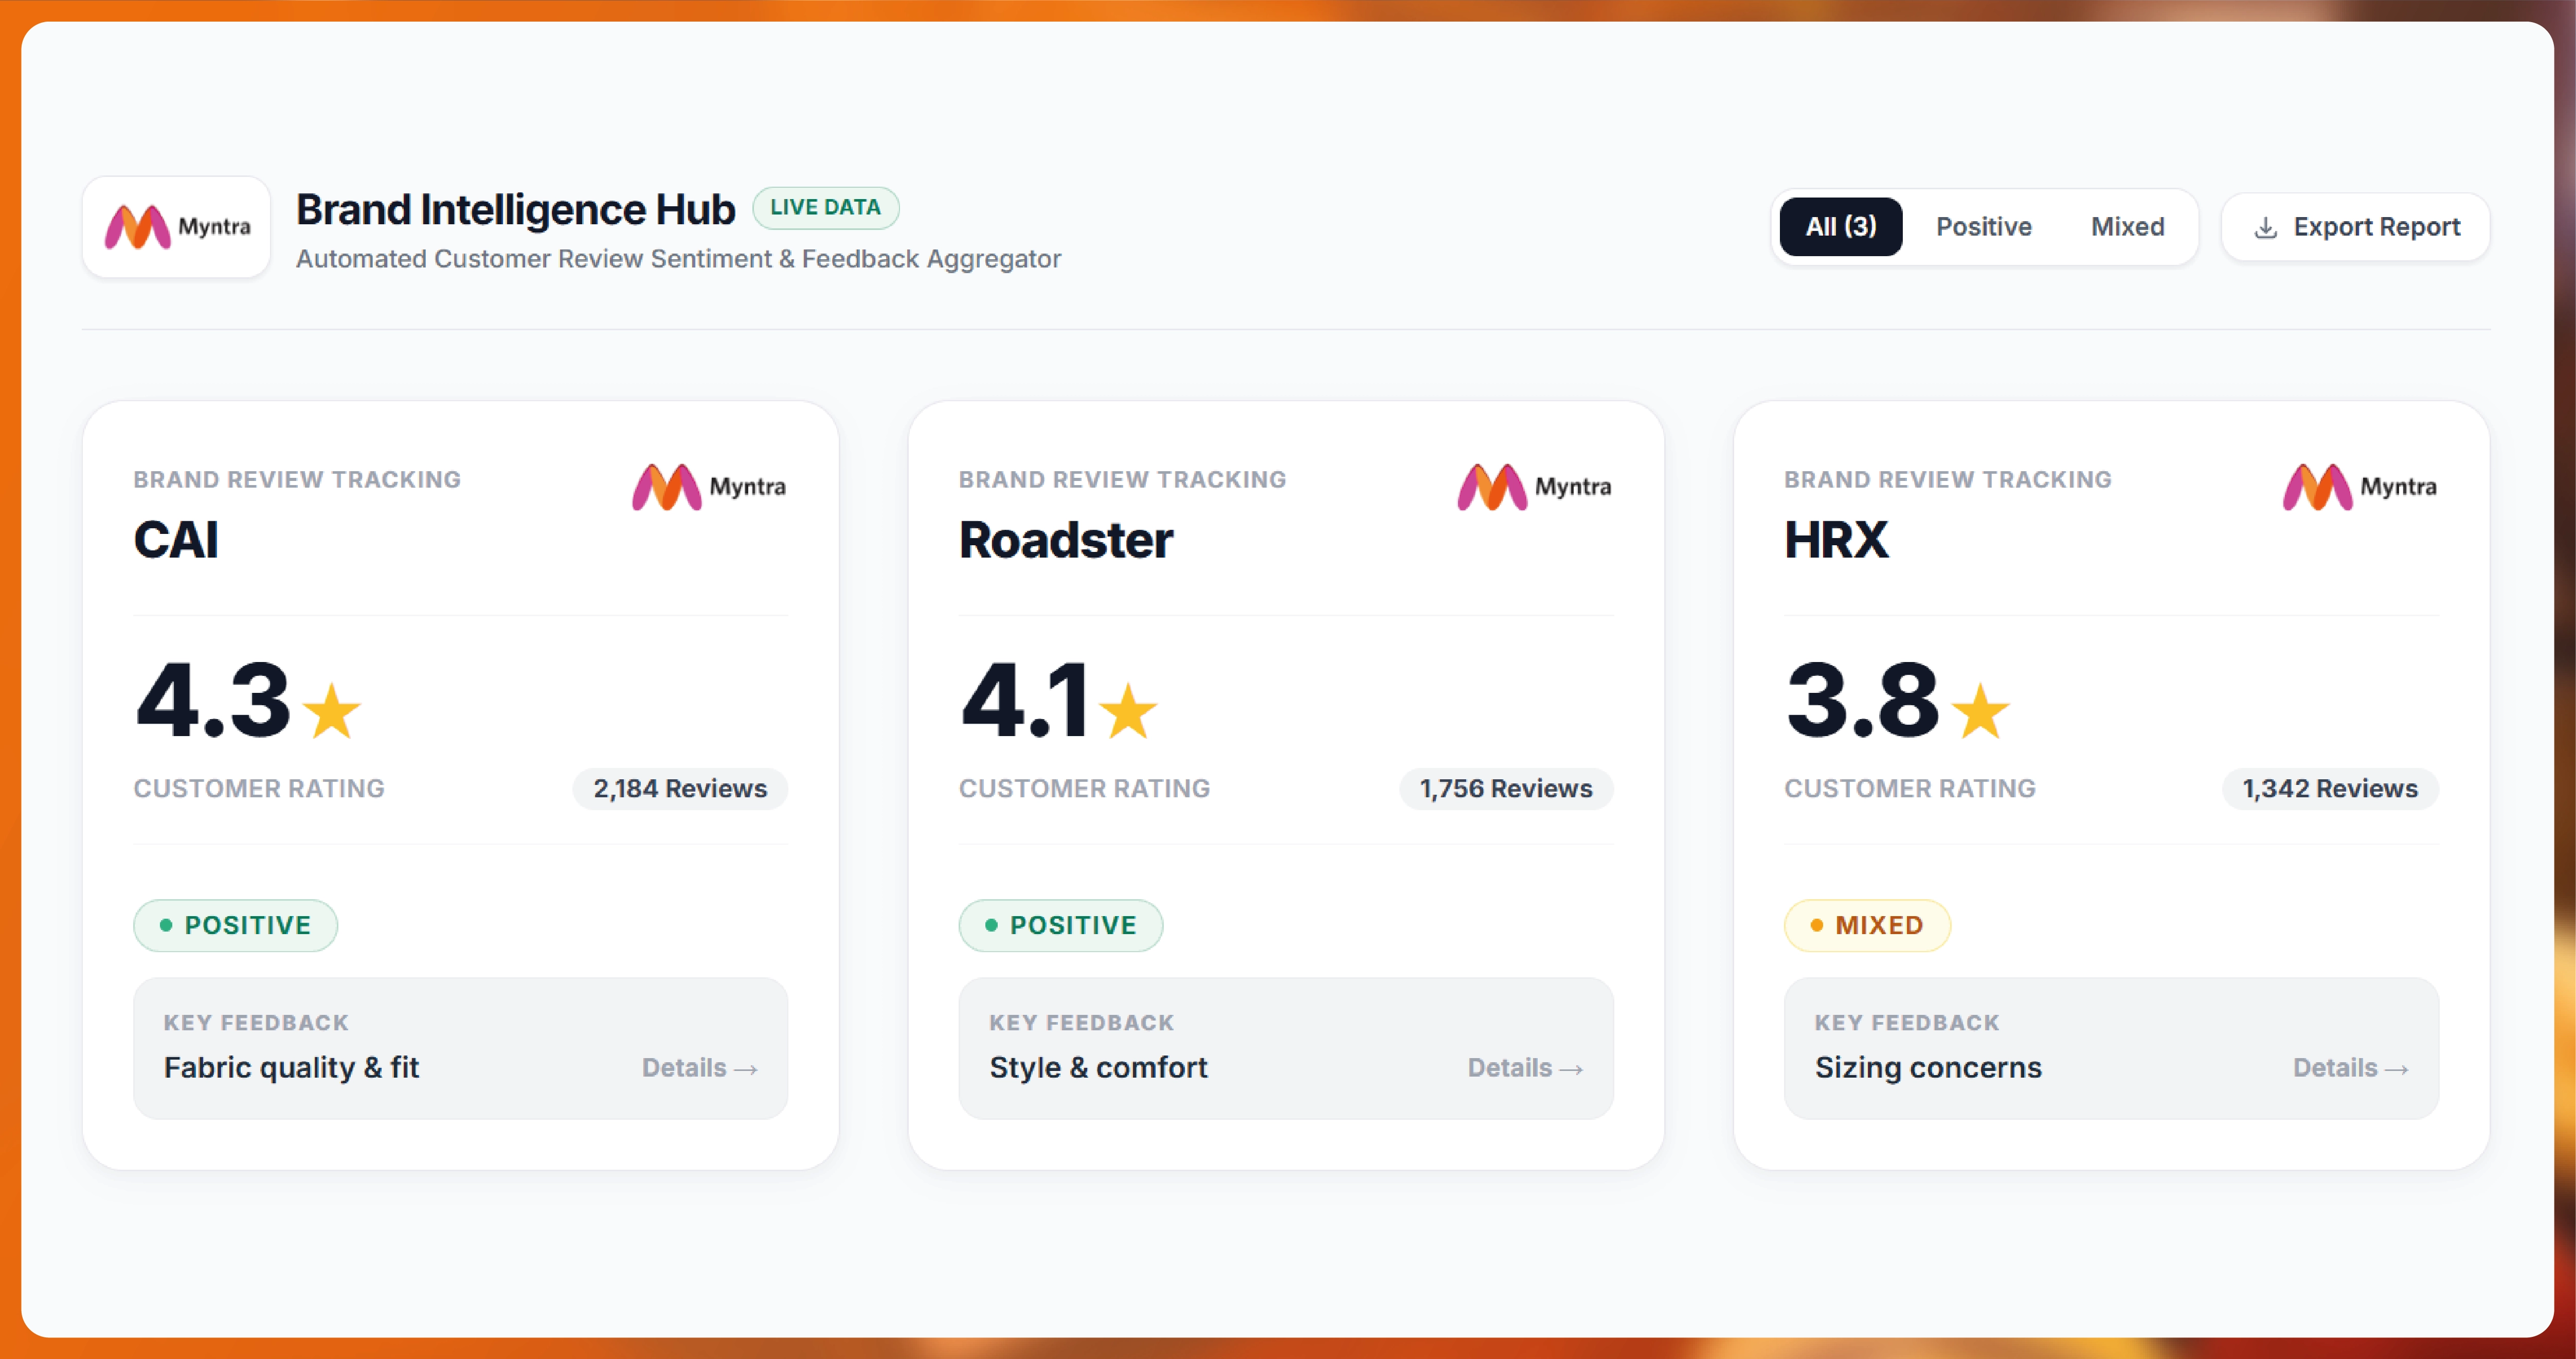
Myntra Brand Review Tracking helps fashion brands, retailers, marketplace sellers, and consumer intelligence teams systematically monitor ratings, reviews, customer feedback, and product-level sentiment. By combining review data with product, SKU, and pricing information, businesses can identify customer expectations, recurring complaints, product strengths, and competitive trends across CAI and other brands.

For fashion businesses operating in a competitive marketplace, customer reviews are more than post-purchase comments. They can reveal recurring issues related to fit, sizing, fabric quality, color accuracy, delivery experience, packaging, durability, and overall value.

Manual review monitoring becomes difficult when businesses need to analyze hundreds or thousands of products. Review & Ratings Data Scraping can help transform publicly accessible review information into structured datasets that can be filtered, categorized, and analyzed at scale.

Businesses can use review intelligence to answer questions such as:

  • Which products receive the highest and lowest ratings?
  • What complaints appear repeatedly across a product range?
  • How do customers perceive CAI compared with other brands?
  • Which product attributes generate positive feedback?
  • Are ratings improving or declining over time?
  • Which SKUs require closer attention?
  • What customer expectations are emerging within specific fashion categories?

The objective is not simply to collect reviews. The objective is to convert customer-generated marketplace content into structured intelligence that supports product development, brand management, merchandising, customer experience, and competitive analysis.

How Can Businesses Extract Fashion Reviews at Scale?

Crex Data Scraping - Solving Accuracy and Data Consistency Issues in Cricket Analytics

Myntra Fashion Review & Rating Data Extraction enables businesses to organize customer-generated feedback around individual products and brands.

A large fashion marketplace can contain products spanning apparel, footwear, accessories, beauty, and other categories. Each product can generate a different volume of ratings and written reviews. Monitoring these manually makes it difficult to identify broader patterns.

A structured extraction workflow can capture relevant fields such as:

Data Field Business Application
Product name Product identification
Brand Brand-level comparison
Product ID Consistent product matching
SKU SKU-level analysis
Rating Customer satisfaction indicator
Review text Qualitative feedback
Review date Trend analysis
Product category Category segmentation
Size information Fit-related analysis
Color Variant-level analysis
Product URL Source reference
Collection timestamp Historical monitoring

Why should brands analyze review text and ratings together?

A rating provides a numerical signal, but the review explains why customers assigned that rating.

For example, a product may receive a rating of 3.8/5. That number alone does not explain whether dissatisfaction is caused by:

  • Poor sizing
  • Fabric quality
  • Color mismatch
  • Product durability
  • Packaging
  • Delivery
  • Product expectations

Combining rating values with review text creates a richer analytical dataset.

How can review extraction support product teams?

Product teams can categorize feedback into recurring themes. If multiple customers mention that a particular garment runs smaller than expected, the brand can investigate sizing information, product measurements, or listing descriptions.

Similarly, repeated comments about material quality can indicate a potential product-quality issue that deserves further investigation.

The data should therefore be treated as an input for investigation rather than an automatic conclusion about product performance.

How Does SKU-Level Identification Improve Review Monitoring?

Scrape Myntra Fashion SKU ID Data workflows can help businesses connect reviews to specific products and variants.

SKU-level identification is important because a single product family may contain multiple sizes, colors, or variants. Without consistent identifiers, review datasets can become difficult to match with product catalogs.

What does SKU-level mapping provide?

A structured product record can contain:

Identifier Purpose
Product ID Product-level matching
SKU ID Variant-level tracking
Brand Brand segmentation
Product title Human-readable identification
Category Category analysis
Size Variant analysis
Color Variant analysis
Rating Review performance
Review count Feedback volume
Review text Customer insights
Price Commercial context

Why is SKU mapping important?

Consider a fashion product available in five sizes and four colors. Customer feedback may differ between variants.

One size may generate repeated fit-related complaints, while another receives more positive feedback. Likewise, a specific color may attract different comments about appearance or material.

A consistent SKU structure makes it easier to determine whether feedback is product-wide or concentrated around specific variants.

How can SKU data support historical monitoring?

Businesses can maintain records such as:

SKU → Product → Brand → Rating → Review Count → Review Text → Date

Over multiple collection periods, this can reveal changes in review volume and rating distribution.

For example, an analytics team may identify that review volume increased substantially after a product launch, while average ratings changed after customers began receiving the product at scale.

Such patterns can support deeper investigation by merchandising and product teams.

How Can Businesses Monitor CAI and Competing Brands?

Myntra CAI brand tracking provides a structured approach to observing customer feedback associated with CAI and other selected brands.

Competitive review tracking is useful because customers often evaluate products within the same category. A brand can therefore learn not only from its own feedback but also from recurring themes associated with competing products.

Which competitive signals should businesses monitor?

Businesses can track:

  • Average rating
  • Review count
  • Rating distribution
  • Positive review themes
  • Negative review themes
  • Product categories
  • Price ranges
  • Product attributes
  • Size-related complaints
  • Quality-related complaints
  • Customer expectations
  • Review growth over time
Metric Competitive Question
Average rating How are products rated overall?
Review volume Which products generate more feedback?
5-star share What proportion of ratings are highly positive?
1–2-star share Where are negative experiences concentrated?
Review themes What do customers discuss most?
Rating trend Is customer perception changing?
Product coverage Which categories generate the most feedback?

Why compare brands at the category level?

A brand should not necessarily compare its entire catalog against another brand's entire catalog. A more useful approach is to compare similar products.

For example:

  • Men's casual shirts vs. men's casual shirts
  • Women's ethnic wear vs. women's ethnic wear
  • Sports shoes vs. sports shoes
  • Handbags vs. handbags

This creates a more relevant competitive framework.

What should businesses avoid?

Businesses should avoid treating review ratings as a perfect measure of product quality. Review volume, customer expectations, product price, category, and product lifecycle can influence observed ratings.

Therefore, review intelligence works best when combined with product and marketplace context.

How Can CAI Reviews Be Collected and Structured for Analysis?

CAI brand Review Collection For Myntra can help businesses organize product-level customer feedback into a structured competitive dataset.

A review collection system should capture more than the review sentence itself. Contextual fields make the data significantly more useful.

What should a review dataset contain?

Field Example Purpose
Brand Brand comparison
Product name Product identification
SKU/Product ID Product matching
Rating Quantitative feedback
Review title Review summary
Review text Customer commentary
Review date Time-series analysis
Product category Category segmentation
Product price Value-context analysis
Variant Size/color analysis
Review count Feedback-volume analysis
Timestamp Data freshness

The final dataset can then be filtered by brand, category, product, rating, date, or review theme.

How can businesses identify recurring complaints?

Natural-language processing and rule-based classification can organize review text into themes such as:

Fit → Fabric → Color → Quality → Comfort → Durability → Packaging → Delivery → Value

For example, if multiple reviews contain references to sizing problems, the system can classify those reviews under a fit-related theme.

This helps analysts move from thousands of individual comments to a manageable set of recurring customer topics.

How does historical collection improve the analysis?

A single review snapshot shows the current state of available feedback. Historical collection provides additional context.

Businesses can compare:

  • Rating changes
  • Review-volume changes
  • Emerging complaint themes
  • Product-level sentiment changes
  • Competitive shifts
  • New product launches

This is particularly useful for products that remain active on the marketplace for long periods.

How Can Fashion Product Review Data Support Better Decisions?

Myntra Fashion Products Review Dataset can help brands combine customer feedback with product-level attributes for deeper marketplace intelligence.

The dataset can be designed for different business functions, including product management, category management, competitive intelligence, merchandising, and customer experience.

What insights can the dataset generate?

Business Function Potential Insight
Product management Identify recurring product complaints
Merchandising Understand category-level preferences
Marketing Identify frequently praised attributes
Customer experience Detect recurring dissatisfaction
Competitive intelligence Compare brand feedback
Category management Identify review patterns by category
Quality teams Detect repeated quality concerns

Can review data help identify product opportunities?

Yes. Repeated positive comments can reveal attributes customers value.

For example, customers may frequently mention:

  • Comfortable fit
  • Soft fabric
  • Accurate color
  • Good value
  • Durable material
  • Attractive design

These observations can help teams understand which attributes are frequently mentioned in customer feedback.

However, review data should complement, rather than replace, formal product research and customer research.

How can review volume be interpreted?

High review volume can indicate strong product visibility or sales activity, but review volume alone does not establish product quality.

A better framework considers multiple signals:

Rating + Review Volume + Sentiment + Review Themes + Price + Product Category

This multidimensional approach provides greater context than relying on one metric.

How Can Sentiment Analysis Reveal Customer Perception?

Myntra Brand Sentiment Analysis can classify customer feedback into positive, neutral, and negative sentiment while also identifying the specific topics associated with those sentiments.

Sentiment analysis is particularly useful when businesses have large volumes of review text that cannot be manually evaluated efficiently.

What can sentiment analysis identify?

A review can be classified across multiple dimensions:

Dimension Example Signals
Overall sentiment Positive, neutral, negative
Fit Comfortable, tight, loose
Quality Durable, poor quality
Fabric Soft, rough, thin
Appearance Attractive, color mismatch
Value Worth the price, expensive
Comfort Comfortable, uncomfortable
Delivery Fast, delayed
Packaging Good, damaged

This creates an aspect-based view of customer feedback.

Why is aspect-level analysis valuable?

Imagine a product with an overall positive sentiment but recurring negative comments about sizing.

An overall sentiment score could hide that issue.

Aspect-level analysis can instead show:

  • Design: Positive
  • Fabric: Positive
  • Comfort: Positive
  • Sizing: Negative
  • Value: Positive

This gives product and merchandising teams a more actionable picture.

How can brands compare sentiment?

Businesses can compare sentiment across:

  • Brands
  • Categories
  • Products
  • SKUs
  • Price bands
  • Time periods

They can also monitor whether certain complaint themes are increasing over time.

Importantly, automated sentiment analysis should be validated against sample reviews, particularly where language is ambiguous, sarcastic, multilingual, or context-dependent.

What Changed in Marketplace Review Intelligence From 2020 to 2026?

From 2020 to 2026, online marketplace reviews have become increasingly important as a source of customer-generated product intelligence. In 2020, changes in digital shopping behavior accelerated reliance on e-commerce marketplaces and made online product information more influential in purchase decisions. During 2021, brands increasingly had to manage larger volumes of customer-generated feedback across digital channels. In 2022, growing competition and changing consumer expectations increased the importance of understanding why customers rated products positively or negatively. During 2023, businesses increasingly moved beyond simple star-rating counts and began examining review text, recurring complaints, and product-level themes. In 2024, advances in natural-language processing made it easier to organize large review datasets into sentiment and topic categories. During 2025, competitive review intelligence became increasingly relevant for brands seeking to compare their customer perception with other brands within the same marketplace categories. By 2026, review datasets can be integrated with product, pricing, SKU, category, and historical marketplace information to create a broader view of customer and competitive intelligence. The evolution is therefore from manually reading individual reviews toward structured collection, classification, historical monitoring, and aspect-level analysis. For fashion brands, this approach can reveal recurring customer expectations around fit, quality, design, comfort, value, and other attributes while also helping teams monitor changes across products and competing brands.

How Can Actowiz Solutions Help With Review Intelligence?

Actowiz Solutions can help brands, retailers, marketplace sellers, and research teams collect and structure relevant publicly accessible product, review, rating, and marketplace information for analytical use.

The solution can be customized according to the required brands, categories, SKUs, fields, geographic scope, collection frequency, and output format.

What data collection capabilities are available?

Web Scraping can support structured collection of publicly accessible marketplace information from relevant web sources.

Mobile App Scraping can support collection from applicable mobile interfaces where technically feasible and permitted by the relevant platform terms and technical restrictions.

A Real-time dataset approach can be designed for businesses that require frequent refreshes and timely marketplace intelligence, subject to source availability.

How can the data workflow operate?

Source Identification → Product Discovery → SKU Mapping → Review Extraction → Data Normalization → Sentiment Classification → Validation → Historical Storage → Dataset Delivery

Each stage plays a specific role.

Product discovery establishes the marketplace scope. SKU mapping connects reviews to products. Review extraction collects relevant feedback. Normalization creates consistent fields. Classification organizes customer commentary. Validation helps identify data-quality issues.

How can dashboards simplify review analysis?

A Review-Sentiment Dashboard can consolidate ratings, review volume, sentiment, product categories, and recurring customer themes into a decision-oriented interface.

Potential dashboard views include:

Dashboard View Key Information
Brand Overview Rating and review trends
Product View Product-level feedback
SKU View Variant-level performance
Sentiment View Positive/negative themes
Competitor View Brand comparisons
Category View Category-level feedback
Historical View Changes over time

This enables business users to move from high-level trends to individual product or review records.

How Can Product, Pricing, and Review Data Work Together?

Myntra Product, Pricing & Review Datasets can provide a broader marketplace intelligence layer by connecting commercial and customer feedback signals.

Product information explains what is being sold.

Pricing information explains how it is positioned commercially.

Review information explains how customers respond to it.

When these datasets are connected through consistent product and SKU identifiers, businesses can conduct deeper analysis.

For example:

Product Price Rating Review Volume Sentiment
Product A ₹1,499 4.4 2,850 Positive
Product B ₹999 3.9 1,940 Mixed
Product C ₹1,799 4.6 3,420 Positive

Illustrative data only; figures are not presented as actual Myntra observations.

A business could then investigate whether premium-priced products receive different customer feedback from lower-priced alternatives.

The same framework can be applied to competing brands and product categories.

Conclusion

Customer reviews contain valuable signals about product experiences, expectations, and recurring pain points. However, extracting actionable intelligence from thousands of reviews requires structured collection, consistent product identification, historical tracking, and analytical classification.

By connecting product, SKU, rating, review, sentiment, pricing, and category information, brands can move beyond individual comments and identify broader customer trends.

For CAI and other fashion brands, this can support product research, competitive intelligence, category management, merchandising, and customer-experience initiatives.

The most effective review-monitoring strategy is not simply about collecting more reviews. It is about organizing the right data around the right products and converting it into insights that business teams can investigate and act upon.

Ready to turn marketplace reviews into actionable brand intelligence? Contact Actowiz Solutions today to build a customized review, product, pricing, and sentiment data solution for your business!

You can also reach us for all your mobile app scraping, data collection, web scraping , and instant data scraper service requirements!

Social Proof That Converts

Trusted by Global Leaders Across Q-Commerce, Travel, Retail, and FoodTech

Our web scraping expertise is relied on by 4,000+ global enterprises including Zomato, Tata Consumer, Subway, and Expedia — helping them turn web data into growth.

4,000+ Enterprises Worldwide
50+ Countries Served
20+ Industries
Join 4,000+ companies growing with Actowiz →
Real Results from Real Clients

Hear It Directly from Our Clients

Watch how businesses like yours are using Actowiz data to drive growth.

▶
1 min
★★★★★
"Actowiz Solutions offered exceptional support with transparency and guidance throughout. Anna and Saga made the process easy for a non-technical user like me. Great service, fair pricing!"
TG
Thomas Galido
Co-Founder / Head of Product at Upright Data Inc.
▶
2 min
★★★★★
"Actowiz delivered impeccable results for our company. Their team ensured data accuracy and on-time delivery. The competitive intelligence completely transformed our pricing strategy."
II
Iulen Ibanez
CEO / Datacy.es
▶
1:30
★★★★★
"What impressed me most was the speed — we went from requirement to production data in under 48 hours. The API integration was seamless and the support team is always responsive."
FC
Febbin Chacko
-Fin, Small Business Owner
icons 4.8/5 Average Rating
icons 50+ Video Testimonials
icons 92% Client Retention
icons 50+ Countries Served

Join 4,000+ Companies Growing with Actowiz

From Zomato to Expedia — see why global leaders trust us with their data.

Why Global Leaders Trust Actowiz

Backed by automation, data volume, and enterprise-grade scale — we help businesses from startups to Fortune 500s extract competitive insights across the USA, UK, UAE, and beyond.

icons
7+
Years of Experience
Proven track record delivering enterprise-grade web scraping and data intelligence solutions.
icons
4,000+
Projects Delivered
Serving startups to Fortune 500 companies across 50+ countries worldwide.
icons
200+
In-House Experts
Dedicated engineers across scrapers, AI/ML models, APIs, and data quality assurance.
icons
9.2M
Automated Workflows
Running weekly across eCommerce, Quick Commerce, Travel, Real Estate, and Food industries.
icons
270+ TB
Data Transferred
Real-time and batch data scraping at massive scale, across industries globally.
icons
380M+
Pages Crawled Weekly
Scaled infrastructure for comprehensive global data coverage with 99% accuracy.

AI Solutions Engineered
for Your Needs

→
LLM-Powered Attribute Extraction: High-precision product matching using large language models for accurate data classification.
→
Advanced Computer Vision: Fine-grained object detection for precise product classification using text and image embeddings.
→
GPT-Based Analytics Layer: Natural language query-based reporting and visualization for business intelligence.
→
Human-in-the-Loop AI: Continuous feedback loop to improve AI model accuracy over time.
icons Product Matching icons Attribute Tagging icons Content Optimization icons Sentiment Analysis icons Prompt-Based Reporting

Connect the Dots Across
Your Retail Ecosystem

We partner with agencies, system integrators, and technology platforms to deliver end-to-end solutions across the retail and digital shelf ecosystem.

icons
Analytics Services
icons
Ad Tech
icons
Price Optimization
icons
Business Consulting
icons
System Integration
icons
Market Research
Become a Partner →

Popular Datasets — Ready to Download

Browse All Datasets →
icons
Amazon
eCommerce
Free 100 rows
icons
Zillow
Real Estate
Free 100 rows
icons
DoorDash
Food Delivery
Free 100 rows
icons
Walmart
Retail
Free 100 rows
icons
Booking.com
Travel
Free 100 rows
icons
Indeed
Jobs
Free 100 rows

Latest Insights & Resources

View All Resources →
thumb
Blog

Hotel Points vs Cash Prices: Collecting Comparable Rate Data

How to collect hotel award and cash rates that are actually comparable: rate-plan pinning, fee handling, cadence design, and cents-per-point caveats.

thumb
Case Study

How Sensitive Skin Skincare Product Data API Helps Brands Track Cleansers, Serums, Moisturizers, and Sunscreens

Sensitive Skin Skincare Product Data API helps brands track cleansers, serums, moisturizers, and sunscreens with structured product data.

thumb
Report

Quick Commerce Availability Index Q4 2026: Market Data Report for Top 50 FMCG Brands Across 10 Indian Cities

Quick commerce availability index for Q4 2026: OOS rate, listing coverage and price index for 50 FMCG brands across 10 Indian cities.

Start Where It Makes Sense for You

Whether you're a startup or a Fortune 500 — we have the right plan for your data needs.

icons
Enterprise
Book a Strategy Call
Custom solutions, dedicated support, volume pricing for large-scale needs.
icons
Growing Brand
Get Free Sample Data
Try before you buy — 500 rows of real data, delivered in 2 hours. No strings.
icons
Just Exploring
View Plans & Pricing
Transparent plans from $500/mo. Find the right fit for your budget and scale.
Get in Touch
Let's Talk About
Your Data Needs
Tell us what data you need — we'll scope it for free and share a sample within hours.
  • icons
    Free Sample in 2 HoursShare your requirement, get 500 rows of real data — no commitment.
  • icons
    Plans from $500/monthFlexible pricing for startups, growing brands, and enterprises.
  • icons
    US-Based SupportOffices in New York & California. Aligned with your timezone.
  • icons
    ISO 9001 & 27001 CertifiedEnterprise-grade security and quality standards.
Request Free Sample Data
Fill the form below — our team will reach out within 2 hours.
+1 ▼
✓ Free 500-row sample · No credit card · Response within 2 hours

Request Free Sample Data

Our team will reach out within 2 hours with 500 rows of real data — no credit card required.

+1 ▼
✓ Free 500-row sample · No credit card · Response within 2 hours