Introduction
India’s fashion e-commerce market has expanded significantly as consumers increasingly use digital marketplaces to discover apparel, footwear, accessories, beauty products, and lifestyle merchandise. For brands and retailers, this shift has made product-level visibility increasingly important. Pricing, availability, assortment, ratings, discounts, and product attributes can change frequently, making periodic market research less useful when businesses need a current view of the digital shelf.
The Myntra India Thrice a week E-Commerce Dataset can help organize recurring observations of publicly accessible product information, including product names, brands, categories, prices, discounts, ratings, availability indicators, sizes, and timestamps. Collecting observations three times a week can provide a structured historical record without implying that every product or every location is monitored continuously.
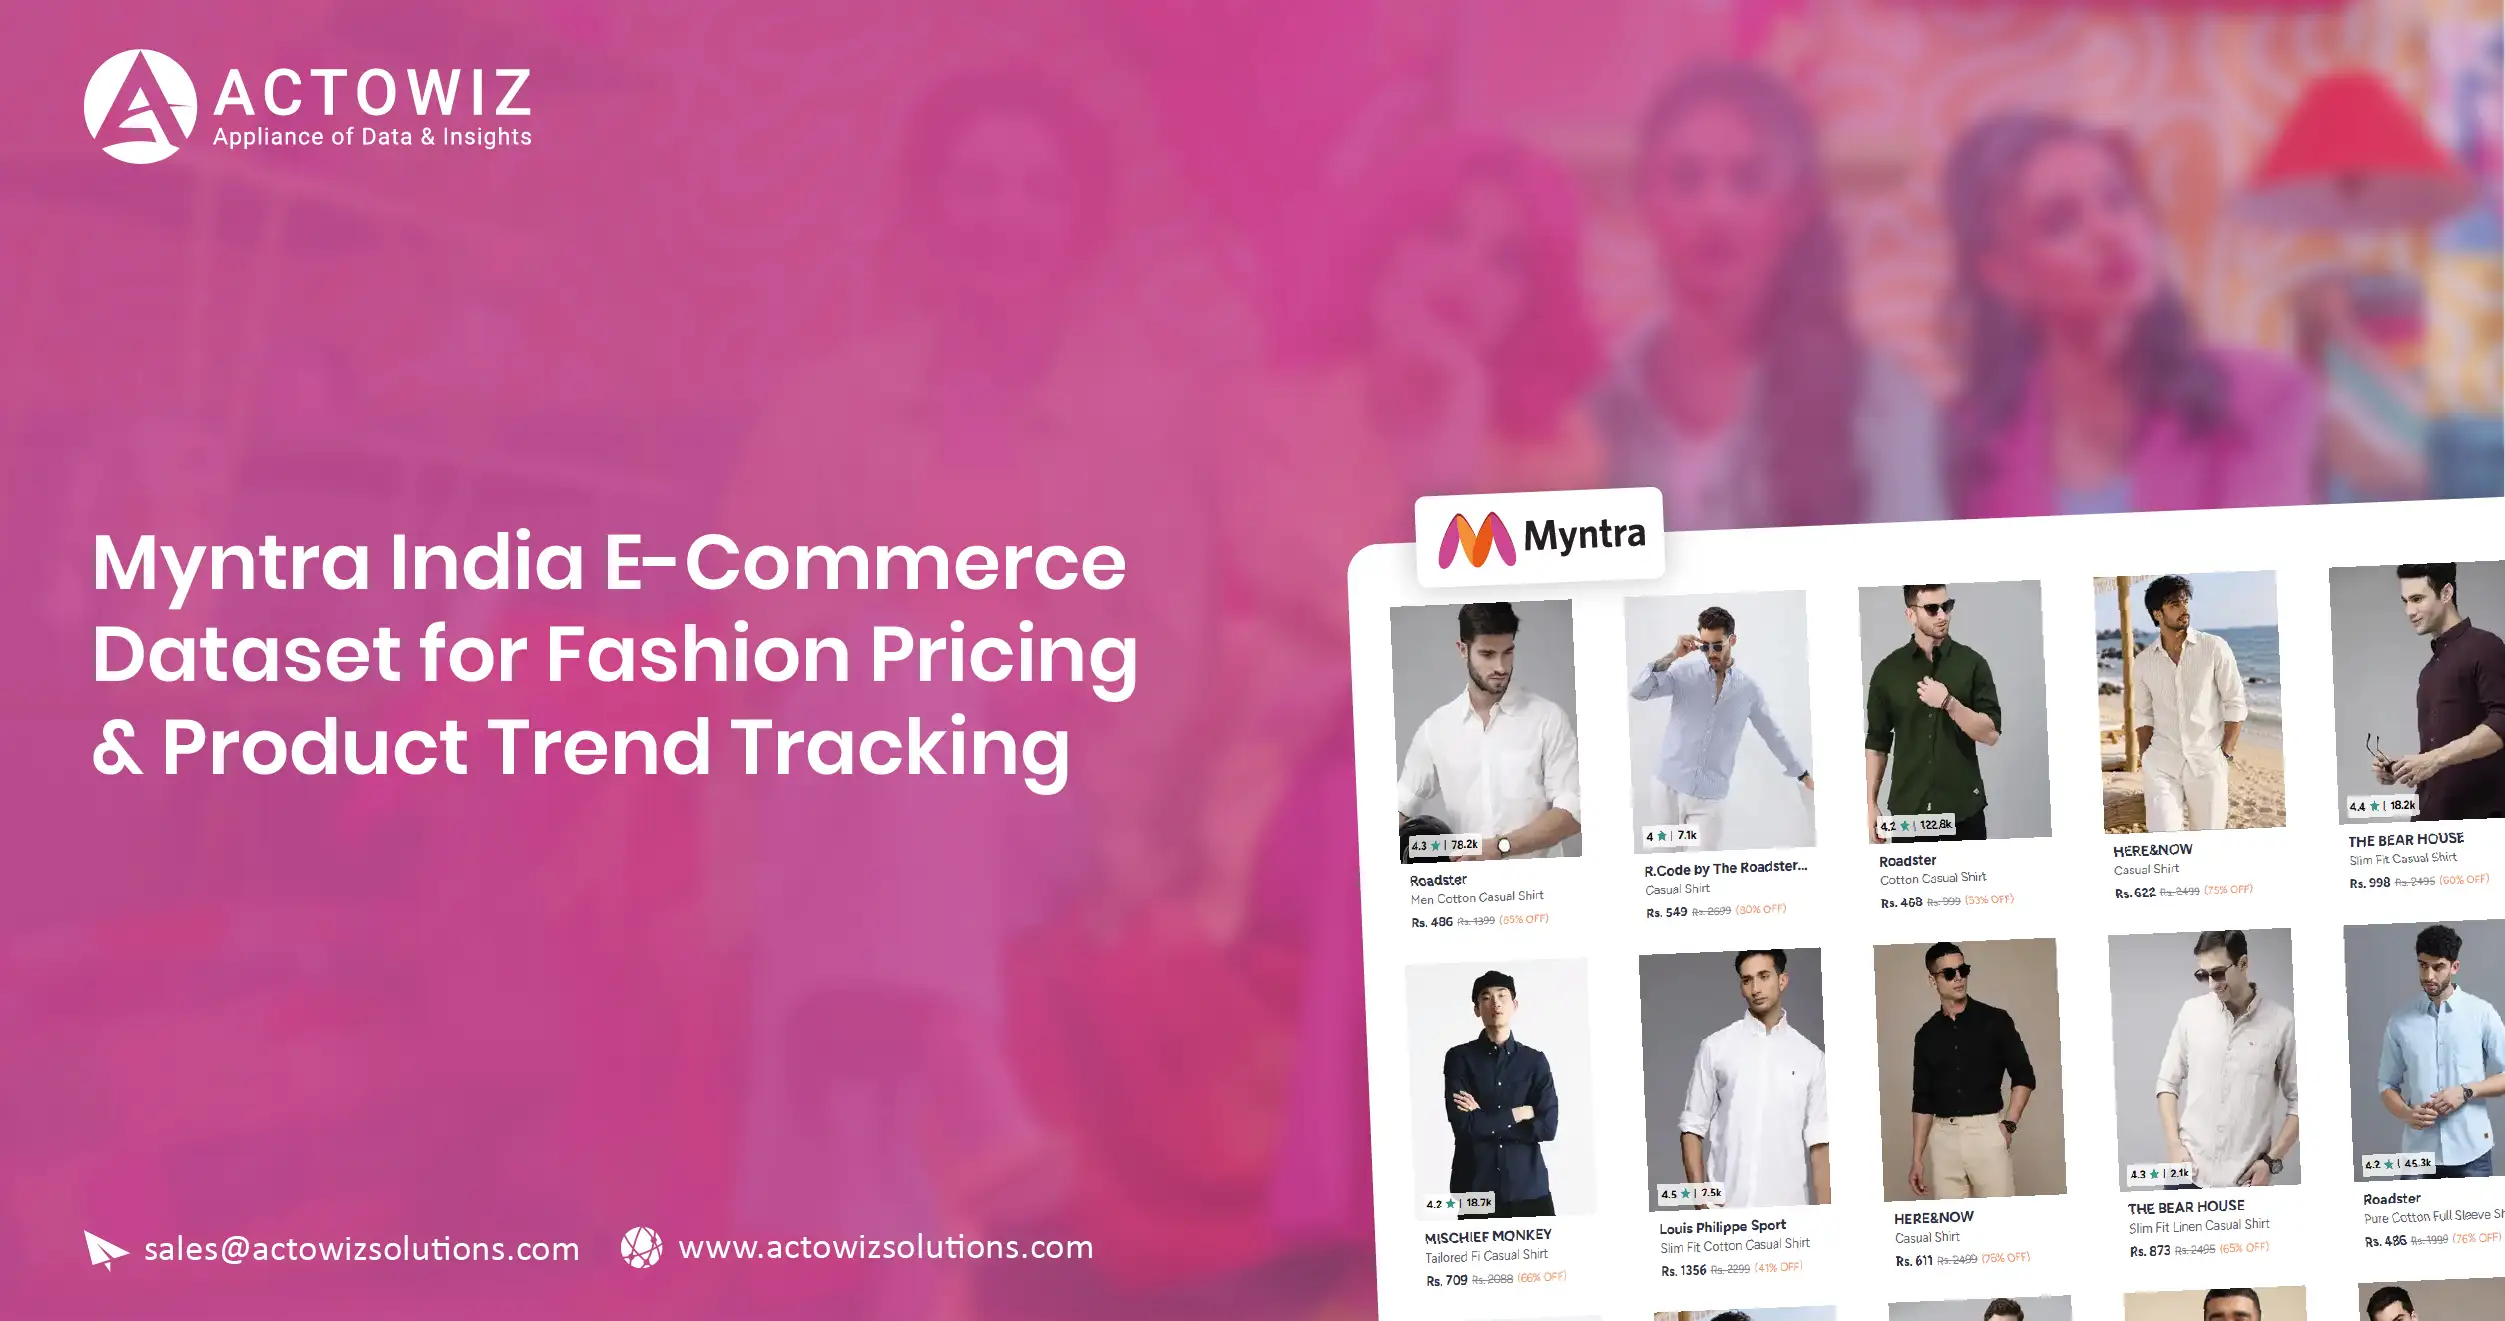
This type of dataset is particularly relevant for fashion brands because product attributes can change alongside pricing and inventory conditions. Myntra product pages currently display information such as selling price, maximum retail price, discount percentage, sizes, ratings, reviews, and visible availability indicators. Myntra
Real-Time Price Monitoring can complement scheduled marketplace collection by identifying important price movements between regular observation cycles. The resulting information can support competitive research, assortment analysis, promotional tracking, and pricing decisions when combined with verified internal business data.
Building a Reliable View of Customer Feedback and Product Movement
A Myntra Review & Rating Data API can provide structured access to review and rating information where the required data is publicly accessible and collection is permitted. Ratings can add useful context to product-level research because a fashion listing can contain not only price and availability information but also customer feedback, review counts, fit-related information, and verified-buyer ratings.
Myntra product pages demonstrate the breadth of information available for individual listings. A current Myntra listing, for example, displays a product rating, number of ratings, selling price, MRP, discount percentage, size availability, product specifications, and customer reviews. Myntra
Through Ecommerce Data Scraping, businesses can structure such information into records that can be compared across collection dates. A record can contain the product identifier, brand, category, price, MRP, discount, rating, review count, available sizes, and collection timestamp. This allows analysts to distinguish a price change from a change in product assortment or variant.
The Myntra India Thrice a week E-Commerce Dataset can preserve these observations at defined intervals. Rather than relying on a single product-page visit, businesses can compare repeated observations to determine whether an item remained listed, whether its price changed, or whether its visible rating and review count changed.
| Year |
Verified Myntra-related evidence |
| 2020 |
Myntra reported about 3.5 million customers during its June 2020 End of Reason Sale, with more than 700,000 first-time customers. ETRetail.com |
| 2021 |
Myntra reported consolidated revenue of ₹2,466.6 crore for FY21, up from ₹1,718.5 crore in FY20. Inc42 |
| 2022 |
Myntra's operating revenue increased 45% to ₹3,501 crore in FY22. The Economic Times |
| 2023 |
Myntra reported operating revenue of ₹4,375 crore for FY23. The Economic Times |
| 2024 |
Myntra reported FY24 revenue of ₹5,122 crore and a net profit of ₹31 crore. The Economic Times |
| 2025 |
Myntra's 2025 full-year financial result is not used here because a sufficiently detailed, directly verified source was not established for this article. |
| 2026 |
Full-year 2026 results are not yet available as of October 15, 2026. |
These figures describe company-level financial or event information; they are not dataset measurements and should not be interpreted as product-level sales, pricing, or inventory statistics.
For fashion companies, this distinction is important. A marketplace dataset can show what was publicly displayed at a particular time, while financial reports show company-level performance. Combining the two without clearly separating their meanings can produce misleading conclusions.
Monitoring Changes in Product Availability
Real-Time Myntra inventory monitoring can help businesses observe visible product availability signals across selected listings. In fashion e-commerce, availability can vary by product, size, color, seller, and location. A product may remain listed while particular sizes are unavailable, meaning that product-level monitoring alone may not provide the complete picture.
Current Myntra product pages demonstrate this distinction. Individual listings can show available and unavailable sizes, while some sizes may have only limited visible availability. One current product page, for instance, shows selected sizes and indicates limited availability for specific sizes. Myntra
For businesses, the useful approach is to preserve availability at the most granular level supported by the source.
A monitoring record can include:
- Product ID or product code
- Product name
- Brand
- Category
- Variant or color
- Size
- Selling price
- Discount
- Availability status
- Collection timestamp
- Product URL
This makes it possible to distinguish between a product being unavailable entirely and a particular size being unavailable.
The distinction is particularly useful during seasonal sales. Myntra has historically operated major promotional events, and its 2020 End of Reason Sale illustrates the scale of activity that can occur around large fashion promotions. Myntra reported approximately 3.5 million customers for that event and a 30% year-on-year increase in traffic. ETRetail.com
However, these historical figures should not be used as current traffic estimates. A dataset should capture actual observations from the relevant collection period rather than extrapolating old event statistics into later years.
For inventory analysis, businesses should also avoid treating an unavailable product page as proof of zero inventory. Public-facing e-commerce pages generally provide availability signals rather than exact warehouse quantities. If the source does not expose a numeric stock count, the dataset should retain the observed status rather than inventing an inventory figure.
Repeated collection allows teams to identify observable changes. For example, analysts can determine whether a particular size moved from available to unavailable between collection points. This can help support merchandising research and product availability analysis while remaining within the boundaries of what marketplace data actually reveals.
Tracking Product-Level Pricing With Consistent Identifiers
A Myntra SKU-level price and availability dataset can help businesses connect individual products with repeated price and availability observations. SKU-level organization is important because fashion marketplaces contain many variants of seemingly similar products.
A T-shirt, for example, can have multiple sizes, colors, or seller-specific attributes. Treating the product title as the only identifier can lead to inaccurate comparisons. Product codes, URLs, variant information, brand names, and specifications can provide stronger matching signals.
The Myntra India Thrice a week E-Commerce Dataset can retain those identifiers alongside every observation. This means that a price recorded during one collection cycle can be compared with a later observation for the same product rather than being compared with a similar-looking but different listing.
Myntra's current product pages demonstrate the value of this structure. Listings can contain a product code, seller information, price, MRP, discount, sizes, specifications, ratings, and customer reviews. Myntra
| Data field |
Role in analysis |
| Product code |
Helps maintain product identity |
| Brand |
Supports brand-level comparison |
| Category |
Enables category analysis |
| Variant |
Separates color, shade, or style differences |
| Size |
Prevents inaccurate availability comparisons |
| MRP |
Records the displayed reference price |
| Selling price |
Records the observed marketplace price |
| Discount |
Captures the displayed reduction |
| Availability |
Records visible purchasing status |
| Rating |
Adds customer-feedback context |
| Timestamp |
Establishes when the observation was made |
Historical company data also shows why product-level monitoring can be relevant to a growing fashion platform. Myntra's reported operating revenue increased from ₹3,501 crore in FY22 to ₹4,375 crore in FY23 and then to ₹5,122 crore in FY24. The Economic Times
Those figures do not establish individual product performance. They simply provide verified company-level context. A SKU dataset addresses a different question: what happened to specific publicly visible products across defined observation periods?
This distinction is essential when preparing business reports. Company revenue cannot be substituted for product sales, and marketplace pricing cannot be substituted for a company's internal revenue or margin data.
A structured product-level dataset can nevertheless help analysts calculate observed price changes, compare promotional periods, and examine assortment movement. Every calculated metric should remain traceable to the underlying observations.
Establishing a Regular Pricing Observation Cycle
Myntra 3 times weekly price Data tracking provides a scheduled approach to monitoring price changes. The purpose of a three-times-weekly collection schedule is to create consistent snapshots that can be compared over time.
The value of scheduled collection becomes clearer when marketplace listings include both standard pricing and promotional pricing. Myntra product pages currently show MRP, selling price, and discount percentage on individual listings. For example, a current listing can display an MRP of ₹6,999 alongside a selling price of ₹3,499 and a 50% discount. Myntra Another current listing displays ₹799 against an MRP of ₹1,499 with a 47% discount. Myntra
These are current product-page observations, not generalized market averages.
A recurring dataset can capture the same fields on each scheduled collection date.
| Collection cycle |
Information captured |
| First weekly observation |
Product, price, MRP, discount, availability |
| Second weekly observation |
Updated product-level information |
| Third weekly observation |
Updated product-level information |
| Historical comparison |
Difference between recorded observations |
This structure allows analysts to identify observed price movements without claiming that a particular price remained unchanged between collection points.
The frequency also matters during promotional periods. A product may have one displayed price during an ordinary period and another during a promotion. A three-times-weekly schedule can capture more changes than an occasional monthly review, although it still does not represent continuous real-time monitoring.
The history of Myntra's financial performance provides context for the scale of the platform. Revenue increased from ₹1,718.5 crore in FY20 to ₹2,466.6 crore in FY21, ₹3,501 crore in FY22, ₹4,375 crore in FY23, and ₹5,122 crore in FY24, according to reported financial information. Inc42
| Financial year |
Reported operating/revenue figure |
| FY20 |
₹1,718.5 crore |
| FY21 |
₹2,466.6 crore |
| FY22 |
₹3,501 crore |
| FY23 |
₹4,375 crore |
| FY24 |
₹5,122 crore |
| FY25 |
Not included without a sufficiently verified source in this article |
| FY26 |
Full-year result not yet available as of October 15, 2026 |
These company-level figures should not be used as a substitute for price-monitoring data. The purpose of the dataset is to provide product-level observations that can be analyzed independently.
Understanding Changes Across Women's Fashion
Myntra women's fashion data Scraping can help brands and researchers collect structured information from women's apparel and related product categories where the required information is publicly accessible.
Women's fashion includes a wide range of products, including ethnic wear, western wear, dresses, tops, footwear, accessories, activewear, and other categories. Each segment can have different sizing, seasonal, pricing, and promotional characteristics. For that reason, category and product normalization are important before comparing prices or availability.
The Myntra India Thrice a week E-Commerce Dataset can organize product-level observations with fields such as category, subcategory, brand, product title, price, MRP, discount, size, color, rating, and availability. This allows businesses to build category-specific monitoring instead of treating all fashion products as one group.
Myntra's own 2020 reporting highlighted strong demand in women's ethnic, kidswear, active and sportswear, and beauty and personal care during the post-lockdown period. The Economic Times In 2024, Myntra's chief product and technology officer said that the platform was seeing significant demand from Tier 2 and Tier 3 cities and reported that 75 million new users joined the platform in 2023. Business Standard
These verified statements provide market context, but they do not establish the performance of any particular women's fashion SKU.
A structured category dataset can instead answer questions such as:
- Which products were visibly listed during each observation period?
- Which sizes were available?
- Which displayed prices changed?
- Which products carried visible discounts?
- Which categories had changes in assortment?
- How did displayed ratings and review counts change?
For brands, these observations can support competitive research and merchandising discussions. They can also help teams identify products that require closer investigation.
Product-level monitoring should always preserve the original attributes. A dress listed in one size or color should not automatically be treated as equivalent to another variant. Similarly, an observed discount should be recorded as displayed rather than interpreted as a permanent price reduction.
This is particularly important in fashion, where product variants can change rapidly. Accurate product matching ensures that a reported price movement actually belongs to the same product or SKU.
Converting Repeated Observations Into Fashion Market Intelligence
The Myntra India Thrice a week E-Commerce Dataset can become more valuable when individual product observations are transformed into consistent analytical records.
A business may use the dataset to monitor prices, availability, ratings, discounts, product categories, and assortment changes. When these fields are captured repeatedly, analysts can establish a historical record that supports comparison between collection dates.
Myntra's reported financial results demonstrate the platform's business scale. Its operating revenue increased from ₹2,466.6 crore in FY21 to ₹3,501 crore in FY22, followed by ₹4,375 crore in FY23 and ₹5,122 crore in FY24. Inc42 In FY24, Myntra also reported a net profit of ₹31 crore after reporting a loss of ₹782 crore in FY23. The Economic Times
These numbers provide company-level context for the platform's development. They do not tell a brand which products changed price or became unavailable.
A product intelligence dataset can address that narrower question.
| Research area |
Directly observable information |
Additional evidence required |
| Pricing |
Displayed price and MRP |
Internal costs and margins for profitability analysis |
| Discounts |
Displayed discount and promotional text |
Actual transaction-level discount realization |
| Availability |
Visible size/product status |
Exact warehouse inventory quantity |
| Ratings |
Displayed rating and review count |
Broader consumer sentiment beyond platform reviews |
| Assortment |
Products captured in listings |
Complete company-wide catalog unless coverage is comprehensive |
| Product movement |
Changes between collection snapshots |
Reasons for delisting or assortment changes |
| Market performance |
Published company or industry statistics |
Product-level sales data |
This separation protects the integrity of market research.
A recurring dataset can also support historical trend analysis. If a product is captured three times each week over several months, analysts can calculate the number of observations showing a particular price, identify recorded promotional periods, and document availability transitions. These calculations should always use the actual collected observations.
The dataset should also preserve missing observations rather than replacing them with estimated values. If a collection fails on a particular date, that date should be marked accordingly. This is preferable to presenting a fabricated price or availability status.
For 2025 and 2026, current marketplace observations can be collected and analyzed, but full-year performance figures should only be included once official or otherwise credible sources publish them. As of October 15, 2026, a complete FY26 result cannot be presented as an established annual figure.
How Actowiz Solutions Can Help?
Actowiz Solutions can help brands, retailers, researchers, and e-commerce businesses build structured marketplace data workflows around defined product and pricing requirements.
Pricing & Product Data Scraping can be used to collect accessible product attributes such as product names, categories, brands, displayed prices, MRP, discounts, ratings, reviews, availability indicators, and product specifications. The exact fields depend on what the source exposes and the agreed collection scope.
The Myntra India Thrice a week E-Commerce Dataset can be structured around recurring observations so that businesses receive consistent records rather than isolated snapshots.
Actowiz Solutions can support the following areas:
Product and Price Collection
Businesses can define the categories, brands, SKUs, locations, and fields they want to monitor. Product-level records can then be organized with collection timestamps for historical comparison.
Availability Tracking
Visible product and size-level availability can be recorded where the source provides those signals. Exact inventory quantities should only be reported when the source explicitly provides them.
Discount Monitoring
Displayed MRP, selling price, discount percentage, and promotional messaging can be captured for comparison across observation dates.
Product Attribute Normalization
Brands can standardize fields such as product category, size, color, brand, product ID, and pack or variant information. This improves the reliability of like-for-like comparisons.
Review and Rating Collection
Where accessible and permitted, rating and review information can be structured alongside product records. This allows teams to study customer-feedback indicators alongside pricing and availability.
Scheduled Data Delivery
A three-times-weekly schedule can be implemented for businesses that need recurring observations without requiring continuous collection. Frequency can be adjusted based on project requirements and source-access considerations.
Data Quality Checks
Collected records can be checked for missing values, inconsistent product identifiers, duplicate listings, and unexpected attribute changes. These checks help reduce errors before the information reaches business dashboards or analytical workflows.
Historical Data Development
If businesses begin collecting information today, the resulting records can establish a verified historical series from the start date onward. Previous years should only be included when reliable historical records exist.
This evidence-first approach is particularly important for competitive intelligence. A dataset should show what was actually observed rather than infer competitor sales, stock levels, margins, or strategy from incomplete marketplace information.
Conclusion
Fashion e-commerce is increasingly data-driven, and recurring product-level observations can provide brands with a clearer view of digital marketplace activity. Myntra's reported revenue increased from ₹1,718.5 crore in FY20 to ₹5,122 crore in FY24, while its 2020 End of Reason Sale demonstrated substantial customer and traffic activity. Inc42
The Myntra India Thrice a week E-Commerce Dataset can help businesses organize repeated observations of product pricing, discounts, ratings, reviews, assortment, and visible availability. The three-times-weekly approach creates a consistent snapshot structure that can be used for historical comparisons and competitive research.
For businesses requiring more frequent observation, Web Scraping, Mobile App Scraping, and a Real-time dataset workflow can be considered according to source accessibility, technical feasibility, and applicable platform requirements. The resulting information can support pricing research, product benchmarking, assortment analysis, and digital shelf monitoring.
The most important principle is data integrity. Marketplace observations should remain separate from company financial results, industry forecasts, and assumptions about consumer behavior. If a source does not provide exact inventory quantities, those quantities should not be invented. If historical data does not exist for a particular year, the gap should remain visible rather than being filled with estimates.
For fashion brands, retailers, and research teams, this approach can create a more reliable foundation for understanding product-level movements and making evidence-based decisions.
Ready to strengthen your fashion e-commerce intelligence? Contact Actowiz Solutions to build a structured product, pricing, availability, and competitive data collection solution tailored to your requirements!
You can also reach us for all your mobile app scraping, data collection, web scraping, and instant data scraper service requirements!

 By industry🏷 By platform🌐 By market
 Pricing & Promotions
MAP Violations Brand Protection Counterfeit Detection Price Intelligence AI HOT Data Intelligence
 Brand & Intelligence
Share of Search Content Audit & PDP Reviews & Ratings Retail Media Buy Box Monitoring Social Commerce HOT Live Commerce NEW Agentic Commerce NEW
 Digital Shelf & Search
Assortment Planning Competitive Benchmarking Product Availability Q-Commerce NEW
 AssortmentE-commerce Intelligence Hyperlocal Insights POI & Store Locator DTC Brand Analytics NEW
 For Retailers
 E-Commerce Dashboard
 Flipkart Insights (Live) #1
 Grocery Intelligence
.svg) Grocery Price (U.S.)
.svg) Quick Commerce (India) HOT
 Food & Restaurant
 Fashion Intelligence
 Automotive
 Travel & Hospitality
 Real Estate
 Food Delivery Intelligence NEW
 OTT & Streaming NEW
 Fuel & EV Charging Price Tracker NEW
 By Use Case
 Pricing Intelligence
 Digital Shelf Analytics
 MAP Monitoring HOT
 Cross-Border Price Parity NEW
 Share of Search
 Review Sentiment
 Kitchen Market Gaps NEW
 Dynamic Pricing / AI Repricing NEW
 Promotions & Deals Alerts NEW
 B2B / POI & Lead Data NEW
 AI Search Visibility Dashboard NEW
 Baby Products on Quick Commerce NEW
 Hotel & Flight Rate Parity NEW
 By Region🇮🇳 India 🇺🇸 USA 🇦🇪 Middle East 🇬🇧 UK 🇦🇺 Australia 🌏 SE Asia 🇪🇺 Europe 🌎 LATAMIndia
 Flipkart Real-Time Insights
 Quick Commerce — Zepto · Blinkit
 Pincode Price Tracker
Middle East
 GCC Q-Commerce — Talabat · Noon NEW
UK & Australia
 UK Grocery — Tesco, Sainsbury's, Asda
 AU Grocery — Coles & Woolworths NEW
 Marketplace Scrapers
Amazon API TikTok Shop API HOT Uber Eats API Airbnb API Zepto / Blinkit API Instacart API NEW Talabat API NEW
 Developer APIsWeb Extract API Reviews API SERP API Pricing Webhook NEW
 Universal APIsStreaming Crawl API Scheduler Realtime Alerts Webhook Delivery 🐍 Python SDK 💚 Node.js SDK
 Delivery & SDKs
 Knowledge Center
Digital Shelf Playbook MAP Compliance Guide Pricing Intel Guide Scraping Compliance TikTok Shop Guide NEW Cross-Border Guide NEW
 Guides & Playbooks
🎉 Seasonal & event tracking NEWBlack Friday pricing report Festive season, India Ramadan, GCC grocery All seasonal reportsSample Datasets HOT ROI Calculator NEW API Postman Collection Demo Dashboards Free API Playground NEW Press Kit
 Downloads & Tools
Trust Center About Us FAQs Careers
 Trust & CompanyRetail shelf research NEWRetail shelf research


 4.8/5 Average Rating
 50+ Video Testimonials
 92% Client Retention
 50+ Countries Served